Disparities in Distance to Abortion Care Under Reversal of Roe v. Wade

Abstract

Background: With federal abortion protections under threat, it is important to consider how abortion care access will change in certain places and populations if abortion laws revert to states. Abortion policy and access have strong spatial patterns in the US. State-level bans could severely reduce access in vast regions, worsening access in areas with already poor access. This may exacerbate disparities and lead to large-scale impacts on reproductive health. Beyond describing where abortion care may change, we sought to describe which populations could experience the most dramatic impacts if state-level bans are enacted.

Methods: We conducted an ecological and spatial analysisof abortion facilities and county-level populations in the contiguous United States (CONUS). Outcomes were Euclidean distance to abortion care, as well as change in distance after policy changes.

Findings: If states enact abortion bans as expected, 46.7% of the country’s women would see an increase in distance to abortion care. Currently, more than half (62.6%) of all U.S. women live within 10 miles of an abortion clinic, but if state-level abortion bans go into effect, only 40.2% of women would live that close. The median distance would increase from 38.9 miles to 113.5 miles. In particular, women in the Deep South, Midwest, and Intermountain West could have to travel much farther for care. State-level bans may disproportionately impact women of color, those living in poverty, and people with less education.

Interpretation: The impacts of state-level abortion bans will span across racial, ethnic, and socioeconomic demographics, but the effects will be felt disproportionately by Black, Hispanic/Latinx, and impoverished women and those with less education. The changes have potential to exacerbate disparities in maternal healthcare outcomes at a large scale.

Funding: We have no funding sources to disclose.

Introduction

As abortion-restricting legislation has been enacted at the state level, spatial disparities in abortion care access have grown1 — and with the Supreme Court’s expected majority ruling to strike down Roe v. Wade, access to abortion care will likely become substantially worse in large regions of the country.

In the decades since the Roe v. Wade decision, abortion has been the target of numerous legal restrictions.2 By mid-year, 2021 was already the most prolific year for abortion legislation, with 21 state governments enacting restrictive abortion laws.3 In the most extreme case, the Texas legislature prohibited abortion beyond six weeks of gestation with Senate Bill 8 (SB 8), effectively banning most abortions; healthcare providers estimated that 85 to 90% of patients seeking an abortion in Texas were beyond the six-week mark.4

On December 1, 2021, the Supreme Court heard arguments in the case of Dobbs v. Jackson Women’s Health Organization, in which the state of Mississippi has asked the court to reverse all prior abortion decisions. This would remove federal protections of the right to abortion before fetal viability, allowing states to establish laws that could restrict abortion completely. While a formal decision is not expected until June 2022, the majority of justices are in favor of reversing or weakening Roe v. Wade.5,6

When abortion access is restricted, women seeking an abortion experience more stress, incur more out-of-pocket expenses, and must travel farther to obtain care.7 Restricting access to abortion services is also associated with adverse maternal and infant health outcomes.7–9 When restrictive legislation was enacted at the state-level in Texas, women of color were disproportionately affected. Average abortion rates progressively decreased as distance to clinics increased, but women of color were less likely to successfully obtain an abortion than White women.10 While disparities in abortion care have previously been documented, the scale and degree of impact on sociodemographic groups with state bans has not been investigated in a published study.11 Herein we quantify how distance to abortion care is expected to change in the US without Roe v. Wade.

Methods

A list of 1,045 abortion clinics was obtained from the Advancing New Standards in Reproductive Health (ANSIRH) group’s Abortion Facilities Database. ANSIRH is based at the University of California San Francisco (UCSF), and the database is updated periodically. Clinics that have closed (N = 238) or do not provide abortion services (N = 294) were excluded, leaving a total of 739 clinics for analysis.

County-level characteristics were obtained for women aged 15–49 in 3,108 counties in the contiguous US, and these attributes were applied to the county population-weighted centroids. We examined differences in expected increase in distance to care by race (Black, White, American Indian, Asian, Pacific Islander, Multiple Races), ethnicity (Hispanic or Latinx, not Hispanic or Latinx), educational attainment (some high school, high school diploma, some college, college degree), poverty, and rurality. Racial and ethnic composition and population estimates for 2019 were obtained from the US Census Bureau (USCB).12 Poverty, education, and rurality measures were obtained from the USDA Economic Rural Development Society (ERDS), which were based on the 2020 Census and 2015-2019 American Community Survey (ACS).13,14 Of note, ACS measures of educational attainment only describe individuals aged 25 or older.

Twenty-one states have legislation in place that would almost certainly ban abortion if Roe v. Wade were overturned or weakened, and five additional states would be likely to ban abortion without federal protections in place.15 These include most Southern states (Alabama, Arkansas, Florida, Georgia, Kentucky, Louisiana, Mississippi, Oklahoma, South Carolina, Tennessee, Texas, West Virginia), areas of the Midwest (Indiana, Iowa, Michigan, Missouri, Nebraska, North Dakota, Ohio, Wisconsin) and parts of the West (Arizona, Idaho, Montana, Utah, Wyoming).15

Change in distance to abortion clinics was out primary outcome, with a secondary outcome of the amount of change in distance. Using ArcGIS Pro software from the Environmental Systems Research Institute (ESRI), Euclidean distance to the nearest abortion clinic was calculated in miles for all county centroids.16,17 Clinics in states likely to ban abortion were then removed, and the Euclidean distance was re-calculated. If distance to abortion care increased, that county population was considered to be affected by potential abortion bans. These geographic measures were merged with sociodemographic variables, and the resulting data were analyzed further in R statistical software. Counties were grouped by expected increase in distance to abortion care (no change, ≤50 miles, ≤100 miles, ≤150 miles, ≤300 miles, ≤400 miles, and >400 miles). Distance increments were chosen for interpretability and visualization, with larger increments at greater distances.

Results

More than half (62.6%) of all U.S. women currently live within 10 miles of an abortion clinic, but if state-level abortion bans go into effect, only 39.0 percent of women would live that close. Most counties (N = 1694, 62.0%) would experience an increase in distance to abortion clinics. The median distance to the nearest clinic is currently 38.9 miles, but with bans the typical distance would increase almost three-fold (median: 113.0 miles).

With state-level abortion bans, about 50 million women aged 15–49 (59.5% of this population) would live in counties without a clinic — 1.7-times more than present. As Figure 1 shows, wide swathes of the country would have to travel hundreds of miles for care, including most of the South, portions of the Midwest, and throughout the Intermountain West. Figure 2 illustrates where the change would have the most pronounced impact, with county populations experiencing the greatest change in distance to care. In the top map of Figure 2, dark red areas represent counties with an increase of greater than 100-fold. These are primarily urban counties containing abortion clinics, and populations in these areas would experience the most dramatic impacts. For instance, a typical person in Miami-Dade County, Florida currently needs to travel less than a mile for care — but that distance would increase by 426 miles. The lower map in Figure 2 shows this change in distance in terms of miles. Distance to care would increase by hundreds of miles for the Deep South, with no bordering states providing care. Table 1 shows county-level sociodemographic characteristics by expected change in distance (no change, ≤50 mi, ≤100 mi, ≤150 mi, ≤300 mi, ≤400 mi, >400 mi).

Figure 1. Euclidean distance to abortion providers from contiguous US county populations.
Figure 2. Relative and absolute change in distance to abortion care.

Both rural and urban areas will be impacted if state-level bans are implemented. About 59% of rural counties (N = 1,077) and 66% of urban counties (N = 865) will be affected. Of Both rural and urban areas will be impacted if state-level bans are implemented. About 66% of rural counties (N = 680) and 60% of urban counties (N = 1,014) will be affected. Of the 46 counties that will see an increase of more than 400 miles, 89.1% are also urban. As shown in Figure 2, the relative change in distance to care would increase most dramatically in urban areas, where most clinics are currently located.11 More than 36 million women in urban areas will be impacted to some degree. Relatively small changes (increases of less than 50 miles) will be experienced by more rural areas (56.9%), because most clinics are further from rural populations. Across all groups, 68.7% of women of reproductive age in rural populations would see an increase in distance required to reach an abortion clinic.

Economic measures tend to change as distance to care increases. The most affluent group, with the highest median household income at $60,724, will experience no change in distance to care. Poverty levels (11.1%) are also lowest in this group and highest (14.0%) in the next group, which will experience the smallest impacts (change of ≤50 mi). In unaffected areas, a college degree is the most common educational attainment (24%). In places with relatively minor impacts (change of ≤50 mi), a high school diploma is more common than a college degree (21.9% vs. 16.3%). Areas with the biggest impacts (change of >400 miles) also have the highest proportion of people without a high school diploma at 10.9% and the highest poverty rate (14.9%).

Proportions of Asian people and those of two or more races were highest in areas with no change. In these counties, 12.0% of people are Black. By contrast, counties with the biggest expected impacts are 18.5% Black. This group also has the lowest proportion of White people at 74.3%, although 45.0% of the people in these areas are also Hispanic or Latinx. This area, visualized in the absolute change map of Figure 2, consists of most of the coast of the Gulf of Mexico, encompassing large regions of Texas and Florida, most of Louisiana, and areas of Mississippi and Alabama. It also includes one county in Montana.

About 45 million women of reproductive age (53.5%) will experience no change in distance to abortion care. Roughly 16 million (19.3%) may have to travel up to 150 miles further than they do currently. Combined, 24 million women (29.3%) will see an increase in travel distance greater than 150 miles to obtain care.

It is important to note that, while the degree and relative amount of impact varies across demographic groups, all sociodemographic groups would, on average, see an increase in distance to abortion care on average.

Discussion

Millions of women would be affected by state-level abortion restrictions, and racial, ethnic, and socioeconomic disparities in distance to care would be exacerbated. These results represent the worse-case scenario, assuming Roe v. Wade is overturned all 26 states restrict abortion to the point that all clinics close. However, because 12 states (including Utah) have “trigger” bans3 — set to take effect immediately if Roe v. Wade is overturned — some of these impacts are guaranteed to take effect, if the Supreme Court rules in favor of Mississippi.

While distance to abortion care will increase dramatically in some areas, access will be more difficult for some than others. Women with resources enabling them to travel will likely be more successful in obtaining an abortion. However, our results show that distance to abortion care would increase the most for counties whose populations are already the most disadvantaged. This could exacerbate existing healthcare disparities, both geospatial and sociodemographic.19

Across all distance to care, there will be urban and rural populations. Rural areas, which already have disparate access to healthcare, will be positioned even further from abortion care. Some urban areas, despite having concentrated populations and greater demand for health services, would become deserts for abortion care, as shown in Figure 1. Salt Lake City, Utah, for example, has the nearest abortion clinic to some parts of Wyoming, Idaho, and Nevada. Without it, even Salt Lake City residents would need to travel hundreds of miles to reach the nearest clinic, in Colorado. Changes like this could create a complex issue of managing reproductive care for a variety of geographically diverse populations, and meeting this need will likely require a multi-pronged approach.

Given the magnitude of state-level bans, we expect to see a variety of large-scale impacts from state-level bans, particularly if these policies do not increase contraceptive access. Unfortunately, some women will likely be desperate enough to resort to unsafe methods for terminating their pregnancy.8 Poor access to abortion care is associated with poor maternal and infant health, and many groups may experience increases in these impacts.9 With millions more women living farther from care, the clinics that remain open will likely experience higher patient volume. After restrictions were imposed in Texas in 2020, the number of out-of-state abortions increased by more than 600%.20

In some ways, the Supreme Court’s decision could set women’s health back decades — however, America today is not the same as pre-Roe America. Women can easily learn about their options online. They can find providers, connect with advocates, and learn about the dangers of attempting to end their pregnancy without a medical professional. As always with the internet, misinformation will likely spread as well.

Limitations

Because we used areal units, this study is subject to ecological bias. The ability to obtain an abortion likely varies within counties, and beyond this, people with financial means can travel farther distances for care. Furthermore, the demographic composition of counties does not perfectly reflect the populations seeking an abortion.

We used Euclidean distance to approximate travel distance. Calculating Euclidean distance with population-weighted centroids tends to underestimate driving distance to healthcare facilities in both rural and urban areas.19 However, not all women have access to a vehicle, and in regions where women may need to travel hundreds of miles for care, those with financial means may choose to travel by airplane. Because Euclidean distance performs equally well for rural and urban areas and does not assume mode of travel, we preferred this method.

Medication abortions are becoming more widely available, although these may be targeted by state-level policies, as well. These may be sought online, preventing travel, but it will be difficult to predict the scale of medication abortions, particularly when obtained illegally.

The disparities described here only reflect the disparities in distance to care — but this will likely compound with other disparities. As this study was conducted at the county level, we were not able to parse out the intersectionality of these issues, although it is worthy of further investigation.

Conclusion

Millions of women will be impacted if Roe v. Wade is overturned or weakened. State-level abortion bans may exacerbate racial, ethnic, and socioeconomic disparities. Healthcare professionals and patient advocates should prepare to address these disparities and provide for patients as abortion care dynamics evolve.

Acknowledgments

We thank Advancing New Standards in Reproductive Health (ANSIRH), University of California, San Francisco, for providing abortion facility data.

Funding: The authors have no conflicts of interest or funding sources to declare.

Data Sharing: County-level data and a data dictionary will be made available to others upon publication (brenna.kelly@hsc.utah.edu). In accordance with ANSIRH’s Abortion Facilities Database Confidentiality Agreement, facility data and identifying information cannot be disclosed.

References

  1. Policy Surveillance Program. State abortion laws. Updated March 1, 2022. Accessed March 23, 2022. https://lawatlas.org/datasets/abortion-laws
  2. Berer M. Abortion law and policy around the world: In search of decriminalization. Health and Human Rights 2017; 19.
  3. Nash E, Guttmacher Institute, Cross L. 26 states are certain or likely to ban abortion without Roe: Here’s which ones and why. Guttmacher Institute. 2021; published online Oct 26.
  4. White K, Vizcarra E, Palomares L, et al. Initial Impacts of Texas’ Senate Bill 8 on Abortions in Texas and at Out-of-State Facilities. Austin, TX, 2021.
  5. Totenberg N. Roe v. Wade’s future is in doubt after historic arguments at Supreme Court. National Public Radio. 2021; published online Dec 1.
  6. Dobbs v. Jackson Women’s Health Organization. Supreme Court of the United States, No. 19-1392 (draft, circulated Feb 10, 2022) Accessed May 3, 2022. https://s3.documentcloud.org/documents/21835435/scotus-initial-draft.pdf
  7. Gerdts C, Fuentes L, Grossman D, et al. Impact of clinic closures on women obtaining abortion services after implementation of a restrictive law in Texas. American Journal of Public Health 2016; 106. DOI:10.2105/AJPH.2016.303134.
  8. Harris LH, Grossman D. Complications of Unsafe and Self-Managed Abortion. New England Journal of Medicine 2020; 382. DOI:10.1056/nejmra1908412.
  9. Pabayo R, Ehntholt A, Cook DM, Reynolds M, Muennig P, Liu SY. Laws restricting access to abortion services and infant mortality risk in the United States. International Journal of Environmental Research and Public Health 2020; 17. DOI:10.3390/ijerph17113773.
  10. Goyal V, Brooks IHML, Powers DA. Differences in abortion rates by race–ethnicity after implementation of a restrictive Texas law. Contraception 2020; 102. DOI:10.1016/j.contraception.2020.04.008.
  11. Bearak JM, Burke KL, Jones RK. Disparities and change over time in distance women would need to travel to have an abortion in the USA: a spatial analysis. The Lancet Public Health 2017; 2. DOI:10.1016/S2468-2667(17)30158-5.
  12. US Census Bureau. 2010-2019 Annual County Resident Population Estimates by Age, Sex, Race, and Hispanic Origin. https://www.census.gov/data/tables/time-series/demo/popest/2010s-counties-detail.html 2020. (Accessed Dec 15, 2021)
  13. Economic Research Service. Poverty estimates for the U.S., States, and counties, 2019. https://www.ers.usda.gov/data-products/county-level-data-sets/ 2019. (Accessed Dec 10, 2021)
  14. Economic Research Service. Educational attainment for the U.S., States, and counties, 1970-2019. https://www.ers.usda.gov/data-products/county-level-data-sets/ 2019. (Accessed Dec 10, 2021)
  15. Nash E, Guttmacher Institute, Naide S. State policy trends at Midyear 2021: Already the worst legislative year ever for U.S. abortion rights. Guttmacher Institute. 2021; published online Oct 28.
  16. ESRI. ESRI ArcGIS Pro. Redlands, CA, USA. 2021.
  17. US Census Bureau. Centers of population. https://www.census.gov/geographies/reference-files/time-series/geo/centers-population.html 2020. (Accessed Dec 1, 2021)
  18. Team RC. R: A language and environment for statistical computing v. 3.6. 1 (R Foundation for Statistical Computing, Vienna, Austria, 2019). Scientific Reports 2021; 11.
  19. Wakefield D v., Carnell M, Dove APH, et al. Location as Destiny: Identifying Geospatial Disparities in Radiation Treatment Interruption by Neighborhood, Race, and Insurance. International Journal of Radiation Oncology Biology Physics 2020; 107. DOI:10.1016/j.ijrobp.2020.03.016.
  20. White K, Kumar B, Goyal V, Wallace R, Roberts SCM, Grossman D. Changes in abortion in Texas following an executive order ban during the coronavirus pandemic. JAMA – Journal of the American Medical Association. 2021; 325. DOI:10.1001/jama.2020.24096.

Citation

Kelly BC, Brewer SC, Hanson HA. (2022). Disparities in Distance to Abortion Care Under Reversal of Roe v. Wade. Utah Women’s Health Review. doi: 10.26054/0d-4zt7-ts67

PDF

View / download

What Role Does Hispanic/Latina Ethnicity Play in the Relationship Between Maternal Mental Health and Preterm Birth?

Abstract

Objective: To investigate the association of prepregnancy and prenatal depression and/or anxiety on preterm birth (PTB), while also exploring Hispanic/Latina ethnicity as a potential effect modifier.

Methods: Study population included respondents of  UT-PRAMS (2016–2019). Associations between prepregnancy and prenatal depression and/or anxiety and PTB were evaluated using Poisson regression models accounting for stratified survey sampling.

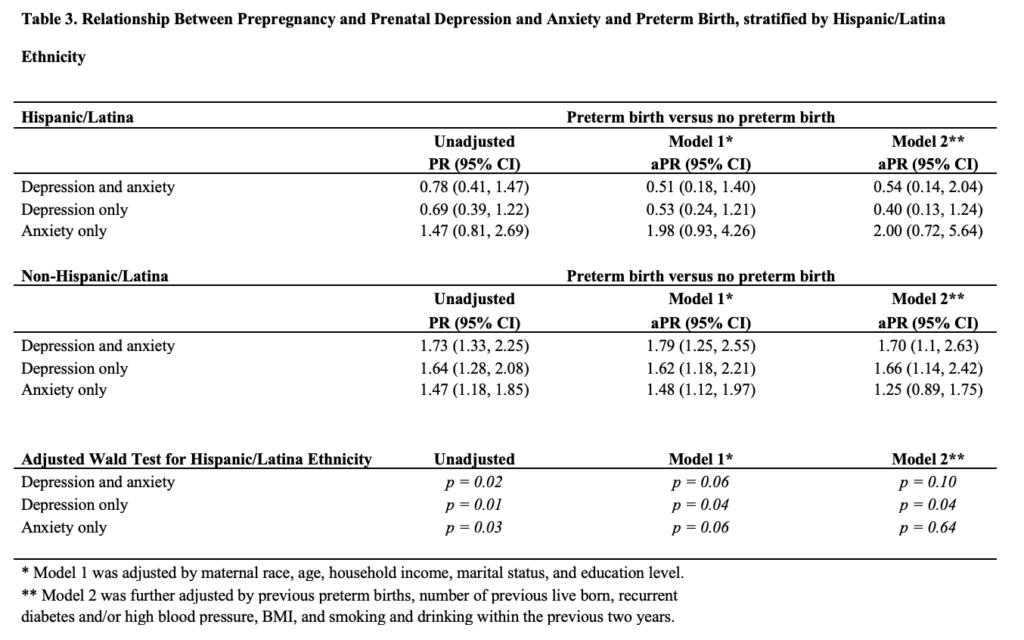
Results: Women with prepregnancy and prenatal depression and anxiety, compared to those without, had a 67 percent (95% CI: 19%, 134%) higher probability of experiencing PTB, after controlling for relevant sociodemographic, lifestyle, and reproductive history factors. Impact of depression on PTB was slightly higher than impact of anxiety. Hispanic/Latina ethnicity was found to protect against PTB for those with prepregnancy and prenatal depression alone (aPR: 0.53, 95% CI: 0.24, 1.21) or both depression and anxiety (aPR: 0.51, 95% CI: 0.18, 1.40) compared to being non-Hispanic/Latina (aPR: 1.79, 95% CI: 1.25, 2.55 for depression alone; aPR: 1.62, 95% CI: 1.18, 2.21 for depression and anxiety).

Conclusions: Overall, Utah women reporting prepregnancy and prenatal depression and anxiety were more likely to have a PTB. Being of Hispanic/Latina ethnicity was found to mitigate the risk of PTB among women with depression and anxiety.

Implications: Prepregnancy and prenatal mental health screenings and treatment are key to lessening the impacts of depression and anxiety on both mother and infant. Hispanic/Latina ethnicity may be  protective against PTB among women experiencing mental distress. Whether this is through increased social support or through a different mechanism should be explored in future research.

Introduction

In 2019, the national preterm birth (PTB) rate rose for the fifth year in a row, affecting approximately 10 percent of infants and causing growing concern among medical and public health officials.2 PTB poses several risks to an infant including immature lungs, difficulty regulating body temperature, poor feeding, and slow weight gain.3 Maternal depression and anxiety have been directly linked to PTB, with long-term effects on both mother and baby.4-7 This is especially relevant since depression is the most common psychiatric disorder in the US and highest among women, with anxiety not far behind.9 A recent study reported that women with both mental health disorders were found to have a higher rate of PTB than those with only depression, only anxiety, or without either disorder.10 An extensive body of prior literature has established that a history of prepregnancy depression and anxiety is a strong risk factor for prenatal depression11-17 and that prepregnancy and prenatal depression and anxiety are highly comorbid.18,19 For that reason, this study explores the potential cumulative impact of prepregnancy and prenatal depression and anxiety (PPDA) on the likelihood of PTB in Utah. Ethnicity is also highly associated with the risk of PTB,20 and this study will look at what effect Hispanic/Latina ethnicity, which makes up the second-largest ethnic group in Utah, may have on risk for PTB.

Methods

Study Population: This is a cross-sectional study design using data from the Utah Pregnancy Risk Assessment Monitoring System (UT-PRAMS) survey, Phase 8 (January 1, 2016, through December 31, 2019). The Centers for Disease Control (CDC) developed the standardized data collection methodology used for the national-level PRAMS survey and continues to provide oversight for the survey’s methodology and protocol.21-23 PRAMS is a mixed-mode surveillance system (mail and telephone) that uses birth certificate information as its population-based sampling frame. One key aspect of PRAMS is the stratified systematic sampling, which oversamples on features related to high-risk women such as mothers of low­-birthweight infants, living in high-risk geographic areas, and belonging to racial/ethnic minority groups.21

UT-PRAMS Phase 8 drew stratified (by maternal education and infant birthweight) samples of approximately 200 new mothers (2–6 months after delivery of a live birth) every month.24 New mothers were contacted via mailed questionnaire (available in English and Spanish) multiple times and telephone follow-up. An informed consent document was included with each survey packet explaining the participants’ rights. Consent is implied if the survey is completed. The total sample of Utah mothers completing the PRAMS Phase 8 questionnaire was 5814, reflecting an estimated population of 188,700 women. The sample comprises 16.2 percent Hispanic/Latinas and 10.9 percent non-White, making it representative of Utah’s race/ethnicity makeup consisting of Hispanic/Latinas (14.4%), Blacks or African Americans (1.5%), American Indians or Alaskan Natives (1.6%), Asians (2.7%), Native Hawaiians or Pacific Islanders (1.1%), or those of two or more races (2.2%).25 The expected national PRAMS response rate is 60%, with Utah exceeding this goal at 65% (2016), 66% (2017), 62% (2018), and 69.5% (2019).

Mothers’ responses were linked to extracted birth certificate data items, including pregnancy complications for index birth. The PRAMS weighting process produces an analysis weight considering the stratified sampling along with nonresponse and noncoverage components. The analysis weight of the PRAMS data can be interpreted as the number of women like herself in the population that each respondent represents. This study and the use of PRAMS data (de-identified) have been acknowledged by the University of Utah Institutional Review Board as nonhuman subject research.

Outcome: The primary outcome of interest was whether or not a woman experienced PTB, defined as a live birth before 37 weeks into the pregnancy.2 The obstetric estimation of gestation, which uses ultrasonography within the first two trimesters to determine gestational age and the estimated delivery date, is added to the birth certificate within 24–48 hours of the birth.26,27 However, it is important to note that the obstetric estimation of gestation may vary by up to 10–14 days.28

Exposure: The PRAMS questionnaire asks women whether they had experienced depression or anxiety (each requiring yes/no answers) during the 3 months before the most recent pregnancy (prepregnancy) or during the most recent pregnancy (prenatal). We created a combined impact variable to include women who had both depression and anxiety in the 3 months prior to conception and during pregnancy (PPDA). This combined impact variable was chosen due to the common comorbidity of these 2 disorders in women (both prepregnant and prenatal) as well as the possibility that the combination for a sustained period of time may result in a cumulative impact increasing the risk for PTB.

Covariates: Confounding factors believed to influence both depression and anxiety as well as PTB were determined based on prior literature. Demographic and lifestyle factors included race/ethnicity, maternal age, marital status, maternal education, total household income, and body mass index (BMI). Additionally, smoking, drinking, and prior history of high blood pressure and diabetes as well as reproductive history were also considered as potential confounding factors.7,20, 29-32 Given prior theories on the role that maternal race/ethnicity may play in mental health-adverse birth outcome associations,33 we additionally tested whether Hispanic/Latina ethnicity may modify the association between prepregnancy and prenatal depression and/or anxiety and PTB.

Statistical Analysis: Participant characteristics were reported by the exposure of interest (ie, PPDA) and took into account PRAMS’ weighted analysis formatting.19 All variables were dichotomous or categorical and reported as weighted percentages.

To explore the associations between prepregnancy and prenatal depression and/or anxiety and PTB, we used Poisson regression models with a robust error variance. The models, accounting for PRAMS’ use of stratified sampling, generated adjusted prevalence ratios (PR) and 95% confidence intervals (CI).34,35 The referent group was women without PPDA. Mothers who did not have data for key exposure variables were removed from the analysis population. Effect modification by Hispanic/Latina ethnicity was conducted via a stratified analysis and on a multiplicative scale using the Wald test. Stata 15.1 was used for the analysis.

Results

After excluding missing values from key exposure variables (depression before/during pregnancy and anxiety before/during pregnancy), 4166 women (72%) were included in the primary analyses, reflecting an estimated population of 136,090 women (Figure 1).

Among this study population, 13 percent had PPDA while 87 percent did not (Table 1). White non-Hispanic/Latina women were more likely to report PPDA (16%) compared to white Hispanic/Latina women (11%).

The median age was 28 years (mean age 28.8, SE 8.7). The majority of women were White (89.1%), non-Hispanic/Latina (83.8%), married (83.3%), had at least some college (72.9%), and did not smoke (91.5%) or drink alcohol (67.6%) within 2 years before pregnancy. A high percentage did not have the common comorbidities of diabetes (99.6%) or high blood pressure (98.8%) within 2 years prior to pregnancy. Household income ranged from $20,001 to $57,000 for 46.4 percent of the population and was above $57,001 for the remaining participants (Table 1).

Almost a third of mothers in this study gave birth for the first time (34.8%) while the others had experienced 1–3 (56.7%), 4–7 (8.2%), and 8+ (0.3%) previous live births, respectively. Of those with previous live births, 98.1%  delivered a single child, 1.8% delivered twins, and 0.1%  delivered multiples. Of women with a previous live birth 5% of women reported previous PTB. The prepregnancy BMI categories for participants was underweight (10.7%), normal weight (50.8%), overweight (13.5%), and obese (25%). Women with PPDA, compared to those without, were more likely to have a history of smoking and/or drinking alcohol within the past 2 years, to be obese, have high blood pressure, a history of PTB, and/or given birth to multiples.

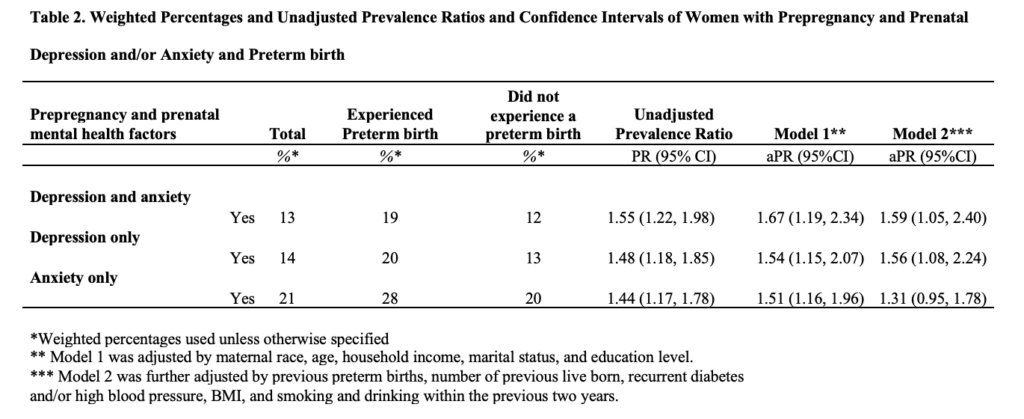
Association Between Depression and/or Anxiety and Preterm Birth: In the unadjusted analysis we found that women reporting PPDA, compared to those without, were 1.55 (95% CI, 1.22, 1.99) times more likely to experience PTB. Those with depression alone were 1.48 (95% CI, 1.18, 1.85) times more likely to experience PTB, and those with anxiety alone were 1.44 (95% CI, 1.17, 1.78) times more likely (Table 2).

After adjusting for maternal race, age, household income, marital status, and education level, women with PPDA, compared to those without, were 1.67 (95% CI, 1.19, 2.34) more likely to have PTB. Those with depression were 1.54 (95% CI, 1.15, 2.07) times more likely to experience PTB, while those with anxiety were 1.51 (95% CI, 1.16, 1.96) times more likely  (Table 2).

After additional adjustment for previous preterm births, number of previous live born, recurrent diabetes and/or high blood pressure, BMI, and smoking and drinking within the previous 2 years, those with PPDA were 1.59 (95% CI, 1.05, 2.40) more likely to have PTB, while those with depression were 1.56 (95% CI, 1.08, 2.24) more likely to experience PTB and those with anxiety 1.31 (95% CI, 0.95, 1.78) more likely (Table 2). Stratification by Hispanic/Latina ethnicity showed effect modification for prepregnancy and prenatal depression and PTB in both the parsimoniously adjusted model and fully adjusted model (Wald P for both=0.04) (Table 3).

Discussion

After accounting for relevant sociodemographic, lifestyle, and reproductive history factors, women with prepregnancy and prenatal depression and anxiety, compared to those without, had a 67 percent higher probability of experiencing PTB. Women experiencing depression but not anxiety had a 56 percent higher probability of experiencing PTB, and those with anxiety but not depression were 51 percent more likely to have PTB. Our findings indicate that among the entire study population, the cumulative effect of depression and anxiety has a greater potential impact on PTB risk than either alone. Effect modification by Hispanic/Latina ethnicity was found to act as a protective factor against PTB for those with prepregnancy and prenatal depression and anxiety as well as those with depression only.36

Strengths of the Study: The use of PRAMS data allows for a population-based analysis that is representative of all women in Utah, including at-risk women, due to its systematic stratified sampling scheme. Our ability to capture self-reported depression and anxiety data before and during pregnancy and to link these data to birth records for PTB assessment is novel, especially since questions on maternal depression and anxiety were added to the UT-PRAMS survey only in 2016.37 The UT-PRAMS questionnaire and linked birth records also allow us to take into account multiple important confounding factors including sociodemographic, lifestyle, health, and reproductive history.

Limitations of the Data: This study faces the limitation of selection bias by only focusing on mothers who had a live birth.38,39 The precision and accuracy of obstetric estimation of gestation, which can vary up to 14 days, may potentially lead to misclassification bias. Missing data for the outcome, key exposures, and covariates could lead to selection bias. Recall bias may also be a factor, as the questionnaire asks women at 2–6 months postpartum on experiences they had before and during pregnancy. Social desirability bias may also be a factor as not all mothers may wish to report on their smoking, drinking, or drug use due to the stigma associated with them. Additionally, the PRAMS questionnaire asks women to confirm that they experienced anxiety and/or depression before and during pregnancy without regard to standardized testing and clinical diagnoses.40 This may result in the data overestimating the prevalence of diagnosed depression and anxiety or underestimating based on poor screening.41 The severity of the mental disorder(s) is also not addressed. During PRAMS Phase 8, 43.8% of women were screened for depression during the 12 months before pregnancy, compared with 68.9% during prenatal care visits, and 85.9% during postpartum health care visits. This study did not explore the impact of stress and abuse factors on PTB among UT-PRAMS participants. The intensity of alcohol consumption and tobacco use are not provided in the data, which may directly impact the potential association between health behavior and the risk of PTB; these questions should be included in future questionnaires. The impact of prepregnancy and prenatal depression and/or anxiety on postpartum depression would also benefit from additional study.2, 42 Finally, we were not able to explore how race may modify the association between maternal depression and/or anxiety and PTB due to only having access to dichotomous race variable (White vs non-White). Given the high rate of PTB among Black women, more research is needed on potential factors that can explain this disparity.33

Interpretation: The findings of an association between prepregnancy and prenatal depression and anxiety and PTB is in harmony with a large body of prior research.2, 7, 25, 34-45 It is notable that many studies look at depression and anxiety separately instead of as ongoing comorbidities, and this has led to varying results in the literature.2,17,27 Adhikhari, et al, found that when depression and anxiety coexist, the symptoms are likely to be more severe and pose a higher risk of PTB.7 Similar to our findings, both maternal smoking and alcohol consumption can increase the risk of PTB.46-50 Unlike other studies,24,29 however, our study did not find that age played a significant role in predicting PTB among women with prepregnancy and prenatal depression and anxiety. This may be because only 13.4% of this sample fell in the high-risk categories of under 18 or over 35 years of age. Liu, et al, reported that prepregnancy obesity is associated with PTB in the general population, which is similar to this study’s findings of a mild association between obesity (BMI >29) and PTB.

The finding of Hispanic/Latina ethnicity as a protective factor against PTB is also in line with existing literature.26, 27, 46 Future research should delve further into reasons that Hispanic/Latina ethnicity may be protective, including through increased social support, as has been hypothesized.26, 27, 46

Health Implications

Pregnancy is a particularly vulnerable time for mothers, and the cumulative impact of prepregnancy and prenatal depression and anxiety can affect maternal mood and increase the likelihood of PTB and impaired fetal development. This, in turn, can lead to long-lasting psychological and neurological effects for the child.32 Additional research with a larger, more diverse group is needed to further test the overall associations between a mother’s age, race, ethnicity, and prepregnancy and prenatal depression and anxiety, and PTB.52,53 Mental health screening during prepregnancy, prenatal, and postpartum visits is imperative to develop appropriate mitigation measures.54

Conclusion

By looking at the existence of both depression and anxiety from prepregnancy to birth, the prevalence and cumulative impact of these mental disorders and their association with experiencing PTB can be better understood. This study highlights a positive association, which translates into a higher risk for PTB among women who experience the cumulative impact of prepregnancy and prenatal depression and anxiety, compared to those with only one disorder or none at all. The finding of an effect modification by Hispanic/Latina ethnicity emphasizes the impact of, most likely, social factors associated with maternal ethnicity and the risk of PTB.

Acknowledgements

Data were provided by the Utah Pregnancy Risk Assessment and Monitoring System (PRAMS), a project of the Utah Department of Health (UDOH), the Office of Vital Records and Health Statistics of the UDOH, and the Centers for Disease Control Prevention and Prevention (CDC) of the US Health and Human Services Department. This report does not represent the official views of the CDC or UDOH. We thank Dr. Charles Rogers for his insightful comments and critiques of various versions of the manuscript.

Funding: Research was partially supported by National Institute of Aging (NIA) grants “Hypertensive Disorders of Pregnancy and Subsequent Risk of Vascular Dementia, Alzheimer’s Disease, or Related Dementia: A Retrospective Cohort Study Taking into Account Mid-Life Mediating Factors” (Project K01AG058781; PI: Karen Schliep)

References

  1. A Pregnancy Risk Assessment Monitoring System Report – January 2021 Maternal Mental Health in Utah. PRAMS perspectives. https://mihp.utah.gov/wp-content/uploads/Maternal-Mental-Health-Utah-PRAMS-2016-2019.pdf. Published 2021. Accessed May 8, 2022.
  2. Effects of Maternal Age and Age-Specific Preterm Birth Rates on Overall Preterm Birth Rates — United States, 2007 and 2014. https://www.cdc.gov/mmwr/volumes/65/wr/mm6543a1.htm. Accessed May 8, 2022.
  3. Preterm Birth. https://www.who.int/news-room/fact-sheets/detail/preterm-birth. Published 2021. Accessed June 17, 2021.
  4. Biaggi A, Conroy S, Pawlby S, Pariante C. Identifying the women at risk of antenatal anxiety and depression: A systematic review. J Affect Disord. 2016; 191:62-77. doi:10.1016/j.jad.2015.11.014
  5. Dunkel Schetter C, Tanner L. Anxiety, depression and stress in pregnancy: implications for mothers, children, research, and practice. Curr Opin Psychiatry. 2012;25(2):141-148. doi:10.1097/yco.0b013e3283503680
  6. Glover V. Maternal depression, anxiety and stress during pregnancy and child outcome; what needs to be done. Best Practice Research Clinical Obstetrics Gynaecology. 2014;28(1):25-35. doi:10.1016/j.bpobgyn.2013.08.017
  7. Kinsella M, Monk C. Impact of Maternal Stress, Depression and Anxiety on Fetal Neurobehavioral Development. Clin Obstet Gynecol. 2009;52(3):425-440. doi:10.1097/grf.0b013e3181b52df1
  8. Healthy People 2010. 2nd ed. Washington, DC: U.S. Dept. of Health and Human Services; 2000.
  9. Major Depression. National Institute of Mental Health (NIMH). https://www.nimh.nih.gov/health/statistics/major-depression#part_155029. Published 2022. Accessed May 8, 2022.
  10. Adhikari K, Patten S, Williamson T et al. Neighbourhood socioeconomic status modifies the association between anxiety and depression during pregnancy and preterm birth: a Community-based Canadian cohort study. BMJ Open. 2020;10(2):e031035. doi:10.1136/bmjopen-2019-031035
  11. Marcus S, Flynn H, Blow F, Barry K. Depressive Symptoms among Pregnant Women Screened in Obstetrics Settings. J Womens Health. 2003;12(4):373-380. doi:10.1089/154099903765448880
  12. Fellenzer J, Cibula D. Intendedness of Pregnancy and Other Predictive Factors for Symptoms of Prenatal Depression in a Population-Based Study. Matern Child Health J. 2014;18(10):2426-2436. doi:10.1007/s10995-014-1481-4
  13. Edwards B, Galletly C, Semmler-Booth T, Dekker G. Antenatal Psychosocial Risk Factors and Depression Among Women Living in Socioeconomically Disadvantaged Suburbs in Adelaide, South Australia. Australian & New Zealand Journal of Psychiatry. 2008;42(1):45-50. doi:10.1080/00048670701732673
  14. Bayrampour H, McDonald S, Tough S. Risk factors of transient and persistent anxiety during pregnancy. Midwifery. 2015;31(6):582-589. doi:10.1016/j.midw.2015.02.009
  15. Giardinelli L, Innocenti A, Benni L et al. Depression and anxiety in perinatal period: prevalence and risk factors in an Italian sample. Arch Womens Ment Health. 2011;15(1):21-30. doi:10.1007/s00737-011-0249-8
  16. Martini J, Petzoldt J, Einsle F, Beesdo-Baum K, Höfler M, Wittchen H. Risk factors and course patterns of anxiety and depressive disorders during pregnancy and after delivery: A prospective-longitudinal study. J Affect Disord. 2015;175:385-395. doi:10.1016/j.jad.2015.01.012
  17. Nasreen H, Kabir Z, Forsell Y, Edhborg M. Prevalence and associated factors of depressive and anxiety symptoms during pregnancy: A population based study in rural Bangladesh. BMC Womens Health. 2011;11(1). doi:10.1186/1472-6874-11-22
  18. Lancaster C, Gold K, Flynn H, Yoo H, Marcus S, Davis M. Risk factors for depressive symptoms during pregnancy: a systematic review. Am J Obstet Gynecol. 2010;202(1):5-14. doi:10.1016/j.ajog.2009.09.007
  19. Verreault N, Da Costa D, Marchand A, Ireland K, Dritsa M, Khalifé S. Rates and risk factors associated with depressive symptoms during pregnancy and with postpartum onset. Journal of Psychosomatic Obstetrics & Gynecology. 2014;35(3):84-91. doi:10.3109/0167482x.2014.947953
  20. Goldenberg R, Culhane J, Iams J, Romero R. Epidemiology and causes of preterm birth. The Lancet. 2008;371(9606):75-84. doi:10.1016/s0140-6736(08)60074-4
  21. Kotelchuck M. Pregnancy Risk Assessment Monitoring System (PRAMS): Possible New Roles for a National MCH Data System. Public Health Rep. 2006;121(1):6-10. doi:10.1177/003335490612100105
  22. Shulman H, D’Angelo D, Harrison L, Smith R, Warner L. The Pregnancy Risk Assessment Monitoring System (PRAMS): Overview of Design and Methodology. Am J Public Health. 2018;108(10):1305-1313. doi:10.2105/ajph.2018.304563
  23. Pregnancy Risk Assessment Monitoring System (PRAMS). https://www.cdc.gov/prams/index.htm. Accessed May 8, 2022.
  24. Maternal and Infant Health Program: PRAMS. https://mihp.utah.gov/pregnancy-and-risk-assessment. Accessed May 8, 2022.
  25. Utah Quick Facts. https://www.census.gov/quickfacts/UT. Published 2020. Accessed May 8, 2022.
  26. Martin J. United States vital statistics and the measurement of gestational age. Paediatr Perinat Epidemiol. 2007;21(s2):13-21. doi:10.1111/j.1365-3016.2007.00857
  27. Committee Opinion No 700: Methods for Estimating the Due Date. Obstetrics & Gynecology. 2017;129(5):e150-e154. doi:10.1097/aog.0000000000002046
  28. Salomon L, Alfirevic Z, Da Silva Costa F et al. ISUOG Practice Guidelines: ultrasound assessment of fetal biometry and growth. Ultrasound in Obstetrics & Gynecology. 2019;53(6):715-723. doi:10.1002/uog.20272
  29. Fuchs F, Monet B, Ducruet T, Chaillet N, Audibert F. Effect of maternal age on the risk of preterm birth: A large cohort study. PLoS One. 2018;13(1):e0191002. doi:10.1371/journal.pone.0191002
  30. Szegda K, Markenson G, Bertone-Johnson E, Chasan-Taber L. Depression during pregnancy: a risk factor for adverse neonatal outcomes? A critical review of the literature. The Journal of Maternal-Fetal & Neonatal Medicine. 2013;27(9):960-967. doi:10.3109/14767058.2013.845157
  31. Manuck T. Racial and ethnic differences in preterm birth: A complex, multifactorial problem. Semin Perinatol. 2017;41(8):511-518. doi:10.1053/j.semperi.2017.08.010
  32. Watson L, Rayner J, King J, Jolley D, Forster D, Lumley J. Modelling prior reproductive history to improve prediction of risk for very preterm birth. Paediatr Perinat Epidemiol. 2010;24(5):402-415. doi:10.1111/j.1365-3016.2010.01134.x
  33. Atkinson K, Nobles C, Kanner J, Männistö T, Mendola P. Does maternal race or ethnicity modify the association between maternal psychiatric disorders and preterm birth?. Ann Epidemiol. 2021;56:34-39.e2. doi:10.1016/j.annepidem.2020.10.009
  34. Santos C, Fiaccone R, Oliveira N et al. Estimating adjusted prevalence ratio in clustered cross-sectional epidemiological data. BMC Med Res Methodol. 2008;8:80. doi:10.1186/1471-2288-8-80
  35. Petersen M, Deddens J. A comparison of two methods for estimating prevalence ratios. BMC Med Res Methodol. 2008;8:9. doi:10.1186/1471-2288-8-9
  36. Mason S, Kaufman J, Daniels J, Emch M, Hogan V, Savitz D. Neighborhood ethnic density and preterm birth across seven ethnic groups in New York City. Health Place. 2011;17(1):280-288. doi:10.1016/j.healthplace.2010.11.006
  37. A Pregnancy Risk Assessment Monitoring System Report – January 2021 Maternal Mental Health in Utah. PRAMS perspectives. https://mihp.utah.gov/wp-content/uploads/Maternal-Mental-Health-Utah-PRAMS-2016-2019.pdf. Published 2021. Accessed May 8, 2022.
  38. Accortt E, Cheadle A, Dunkel Schetter C. Prenatal Depression and Adverse Birth Outcomes: An Updated Systematic Review. Matern Child Health J. 2014;19(6):1306-1337. doi:10.1007/s10995-014-1637-2
  39. What are possible causes of stillbirth?. National Institute of Health. https://www.nichd.nih.gov/health/topics/stillbirth/topicinfo/causes. Accessed May 8, 2022.
  40. Le H. Linking MCH and WIC: Integrating perinatal depression screening and prevention for high risk pregnant women | MCHB. HRSA. https://mchb.hrsa.gov/research/project_info.asp?ID=143. Published 2022. Accessed May 9, 2022.
  41. A Pregnancy Risk Assessment Monitoring System Report – January 2021 Maternal Mental Health in Utah. PRAMS perspectives. https://mihp.utah.gov/wp-content/uploads/Maternal-Mental-Health-Utah-PRAMS-2016-2019.pdf. Published 2021. Accessed May 8, 2022.
  42. Norhayati M, Nik Hazlina N, Asrenee A, Wan Emilin W. Magnitude and risk factors for postpartum symptoms: A literature review. J Affect Disord. 2015;175:34-52. doi:10.1016/j.jad.2014.12.041
  43. Should Race Be Used as a Variable in Research on Preterm Birth?. AMA J Ethics. 2018;20(3):296-302. doi:10.1001/journalofethics.2018.20.3.sect1-1803
  44. DeFranco E, Hall E, Muglia L. Racial disparity in previable birth. Am J Obstet Gynecol. 2016;214(3):394.e1-394.e7. doi:10.1016/j.ajog.2015.12.034
  45. Staneva A, Bogossian F, Pritchard M, Wittkowski A. The effects of maternal depression, anxiety, and perceived stress during pregnancy on preterm birth: A systematic review. Women and Birth. 2015;28(3):179-193. doi:10.1016/j.wombi.2015.02.003
  46. Cnattingius S. The epidemiology of smoking during pregnancy: Smoking prevalence, maternal characteristics, and pregnancy outcomes. Nicotine & Tobacco Research. 2004;6:125-140. doi:10.1080/14622200410001669187
  47. Ikehara S, Kimura T, Kakigano A et al. Association between maternal alcohol consumption during pregnancy and risk of preterm delivery: the Japan Environment and Children’s Study. BJOG: An International Journal of Obstetrics & Gynaecology. 2019;126(12):1448-1454. doi:10.1111/1471-0528.15899
  48. Hamułka J, Zielińska MA, Chądzyńska K. The combined effects of alcohol and tobacco use during pregnancy on birth outcomes. Rocz Panstw Zakl Hig. 2018;69(1):45-54.
  49. Abuidhail J, Abujilban S. Characteristics of Jordanian depressed pregnant women: a comparison study. J Psychiatr Ment Health Nurs. 2013;21(7):573-579. doi:10.1111/jpm.12125
  50. Räisänen S, Lehto S, Nielsen H, Gissler M, Kramer M, Heinonen S. Risk factors for and perinatal outcomes of major depression during pregnancy: a population-based analysis during 2002–2010 in Finland. BMJ Open. 2014;4(11):e004883. doi:10.1136/bmjopen-2014-004883
  51. Mercer B, Goldenberg R, Moawad A et al. The Preterm Prediction Study: Effect of gestational age and cause of preterm birth on subsequent obstetric outcome. Am J Obstet Gynecol. 1999;181(5):1216-1221. doi:10.1016/s0002-9378(99)70111-0
  52. Liu B, Xu G, Sun Y et al. Association between maternal pre-pregnancy obesity and preterm birth according to maternal age and race or ethnicity: a population-based study. The Lancet Diabetes & Endocrinology. 2019;7(9):707-714. doi:10.1016/s2213-8587(19)30193-7
  53. Lynch A, Hart J, Agwu O, Fisher B, West N, Gibbs R. Association of extremes of prepregnancy BMI with the clinical presentations of preterm birth. Am J Obstet Gynecol. 2014;210(5):428.e1-428.e9. doi:10.1016/j.ajog.2013.12.011
  54. Bauman B, Ko J, Cox S et al. Vital Signs: Postpartum Depressive Symptoms and Provider Discussions About Perinatal Depression — United States, 2018. MMWR Morb Mortal Wkly Rep. 2020;69(19):575-581. doi:10.15585/mmwr.mm6919a2

Citation

Seage M, Petersen M, Carlson M, VanDerslice J, Stanford J, & Schliep K. (2022). What Role Does Hispanic/Latina Ethnicity Play in the Relationship Between Maternal Mental Health and Preterm Birth? Utah Women’s Health Review. doi: 10.26054/0d-dkas-c5qe

PDF

View / download

The Cognitive Health of Widows in the United States

Problem Statement

In the United States, more than 900,000 older adults are widowed each year.1 Losing a spouse is considered one of the most stressful life events,2,3 one that is predominantly experienced by older women.4-6 About 30% of women aged 60 to 74 years are widowed,5 and over 40% of women aged 65 years and older are widowed compared to only 13% of men aged 65 and older.6 Women typically live another 15 years after the loss of their spouse5 and face aging-related challenges without their life companion.2

The loss of a spouse can be a very isolating experience,4,7 leaving the surviving partner to grieve not only the death of a loved one but also the loss of their planned life as a couple.7 Since women tend to outlive male partners, this primarily affects widows. The transition to widowhood entails the process of grieving and the need to adjust to a new livelihood2 as well as challenges related to loneliness. This significantly stressful life event can also negatively affect social connections, life satisfaction, and mental health.7 Through the increased stress and changes, spousal loss also affects the cognitive health of older adults.3

Status of Literature

Several studies have confirmed that older widows experience poorer cognition and accelerated decline in their cognitive function.8-10, 1, 11-13 Assessing cognitive health is a complicated process,4 but various explanations exists.

First of all, the loss of a spouse can be detrimental for the brain because it may result in dysregulation of the hypothalamic-pituitary-adrenal axis.3 Secondly, this loss commonly increases depressive symptoms and may cause major depressive disorder.14,12,3 Lastly, spousal loss usually means the loss of one of the most important social contacts—a critical source of daily cognitive stimulation–which may accelerate cognitive decline.2,3,13

Cognitive interventions may target those who have been recently widowed.1 As widowed women navigate through the process of rebuilding their social world, social leisure activities (SLA) may help maintain cognition and better adjust to life during widowhood.2,7 SLA can be defined as important determinants of health and well-being for older adults that encompass a variety of activities and shared experiences.7,15 These activities can be physical or cognitive, such as attending a church, group, or organization meeting; visiting with friends or family members; participating in a fitness class; sharing interests with a group; going out for dinner or shopping; or walking and hiking outdoors.15

Social leisure can play an integral role in the coping process for widowed women by allowing them to find distraction, new paths forward, and social groups where they can discover and build a sense of community. In one study, leisure provided widowed women with a safe space to explore the adjustment to widowhood and learn from other women who have already been living this lifestyle. This sense of understanding and peer-mentorship created hope for recently widowed women that their loss may not be painful forever and that they could live a meaningful and pleasurable life.7

Call to Action

The growing large number of older widows suffering from cognitive decline poses a heavy burden currently not met by sufficient attention and policy interventions.13 It is crucial to find ways for widows to maintain cognitive functioning.2

SLA provide a protective role for widowed women and may serve as a coping strategy to preserve cognitive functioning.2 Given the research and findings, interventions at community and policy levels that encourage social involvement and engagement in cognitive activities for older widowed women should be favorably supported.2,7 Social workers, program directors, and other community leaders should be engaged in efforts that promote, advocate, and implement these types of community-based programs for widowed women.7

References

1. Singham, T., Bell, G., Saunders, R., & Stott, J. (2021). Widowhood and cognitive decline in adults aged 50 and over: A systematic review and meta-analysis. Ageing Research Reviews, 71.

2. Lee, Y., Chi, I., & A. Palinkas, L. (2019). Widowhood, leisure activity engagement, and cognitive function among older adults. Aging & mental health, 23(6), 771-780. doi: 10.1093/geroni/igy023.642

3. Wörn, J., Comijs, H., & Aartsen, M. (2020). Spousal loss and change in cognitive functioning: An examination of temporal patterns and gender differences. The Journals of Gerontology: Series B, 75(1), 195-206. doi: 10.1093/geronb/gby104

4. Frost, C. J. & Digre, K.B. (2016). The 7 domains of women’s health: Multidisciplinary considerations of women’s health in the 21st century. Dubuque, Iowa: Kendall Hunt Publishers.

5. Høy, B., & Hall, E. O. (2020). “Take good care of yourself” An integrative review of older widows’ self-care for health and well-being. Journal of women & aging, 1-30. doi: 10.1080/08952841.2020.1753484 

6. Konigsberg, R. D. (2017). Grief, bereavement, mourning the death of a spouse. https://www.aarp.org/caregiving/basics/info-2017/truth-about-grief.html 

7. Standridge, S. H., Dunlap, R., Kleiber, D. A., & Aday, R. H. (2020). Widowhood and leisure: An exploration of leisure’s role in coping and finding a new self. Journal of Leisure Research, 1-17. doi: 10.1080/00222216.2020.1844553

8. Liu, H., Zhang, Y., Burgard, S. A., & Needham, B. L. (2019). Marital status and cognitive impairment in the United States: Evidence from the National Health and Aging Trends Study. Annals of epidemiology, 38, 28-34. doi: 10.1016/j.annepidem.2019.08.007

9. Shin, S. H., Kim, G., & Park, S. (2018). Widowhood status as a risk factor for cognitive decline among older adults. The American Journal of Geriatric Psychiatry, 26(7), 778-787. doi: 10.1016/j.jagp.2018.03.013

10. Shin, S. H., Behrens, E. A., Parmelee, P. A., & Kim, G. (2021). The role of purpose in life in the relationship between widowhood and cognitive decline among older adults in the US. The American Journal of Geriatric Psychiatry. doi: 10.1016/j.jagp.2021.07.010

11. Sommerlad, A., Ruegger, J., Singh-Manoux, A., Lewis, G., & Livingston, G. (2018). Marriage and risk of dementia: Systematic review and meta-analysis of observational studies. Journal of Neurology, Neurosurgery & Psychiatry, 89(3), 231-238.

12. Vable, A. M., Subramanian, S. V., Rist, P. M., & Glymour, M. M. (2015). Does the “widowhood effect” precede spousal bereavement? Results from a nationally representative sample of older adults. The American Journal of Geriatric Psychiatry, 23(3), 283-292. doi: 10.1016/j.jagp.2014.05.004

13. Xiang, N., Liu, E., Li, H., Qin, X., Liang, H., & Yue, Z. (2021). The association between widowhood and cognitive function among Chinese elderly people: Do gender and widowhood duration make a difference?. Healthcare 9(8), 991. doi: 10.3390/healthcare9080991

14. Kristiansen, C. B., Kjær, J. N., Hjorth, P., Andersen, K., & Prina, A. M. (2019). The association of time since spousal loss and depression in widowhood: A systematic review and meta-analysis. Social psychiatry and psychiatric epidemiology, 54(7), 781-792. doi: 10.1007/s00127-019-01680-3 

15. Talmage, C. A., Coon, D. W., Dugger, B. N., Knopf, R. C., O’Connor, K. A., & Schofield, S. A. (2020). Social leisure activity, physical activity, and valuation of life: Findings from a longevity study. Activities, Adaptation & Aging, 44(1), 61-84. doi:  10.1080/01924788.2019.1581026

Citation

Durrant R. (2022). The Cognitive Health of Widows in the United States. Utah Women’s Health Reviewdoi: 10.26054/0d-e5rs-mmk5

PDF

View / download

Utah Girls, Young Women, and Physical Activity

Originally published in Utah Women and Leadership Project, August 2, 2021, No 30. Printed by request in The Utah Women’s Health Review

Setting the Stage

The benefits of physical activity are well documented and improve all aspects of health and overall wellbeing.1 Globally, on average, 37.1% of women are insufficiently physically active while only 23.4% of men are2; this trend is also found in Utah, where 19.4% of women are insufficiently physically active while only 17.6% of men are.3 While women often live longer than men, they are frequently in worse health.4 Physical inactivity con-tributes to the development and severity of chronic diseases including cardiovas-cular disease, diabetes, and hypertension.5 In addition to affecting physical health, physical inactivity is also associated with poor mental health. Physical activity can contribute to positive self-image and improved confidence, which is critical for meaningful community participation as well as developing interpersonal relationships.

The Utah Women & Leadership Project (UWLP) seeks to better understand the status, experiences, and challenges of Utah women in order to strengthen the impact of women and girls.6 This snapshot summarizes research regarding physical activity levels, access, and barriers for girls (ages 7–11) and young women (ages 12–17) to help decision makers understand that instilling physically active habits early can improve the health and wellbeing of Utah women for the rest of their lives. This research snapshot reviews three key areas: 

   1) Gender physical activity levels and the importance of physical activity;

   2) Gender physical activity factors; and

   3) Recommendations to increase physical activity of Utah girls and young women. 

Guidelines & Comparison

National Recommendations

The majority of Americans do not meet the physical activity guidelines recommended for their age. It is advised that children and adolescents, ages 6 to 17, get 60 minutes or more of moderate-to-vigorous physical activity each day. For adults, at least 150–300 minutes of moderate intensity or 75 minutes of vigorous intensity aerobic physical activity per week, or a combination of both, is recommended.7 In terms of steps, the daily recommended average for adolescents and adults is 10,000, and for girls it is 11,500.8 However, due to a number of barriers (see “Specific Gender Barriers” section), women and girls are not meeting the guidelines at disproportionately high rates compared to men and boys.

Utah Comparison

In Utah, 28% of boys meet the recommended physical activity levels set by the state, compared to only 14% of girls (see Figure 1).9 These numbers have been consistent over the past ten years, meaning half as many girls and young women are regularly getting recommended physical activity as compared to boys and young men. An analysis of the American College Health Association’s National College Health Assessment III data found that female college students were significantly less likely to meet physical activity guidelines compared to male college students.10 Research has found that women of various ages report facing more barriers to physical activity than men.11

Specific Gender Barriers

Lack of Options

A major barrier for girls and young women mentioned in the literature in terms of participating in fitness activities is the lack of options for physical activity that they prefer.13 Most physical education classes consist primarily of competitive sports, which young women identified as their least favored activity. Women, young and old, show preferences for yoga, walking, biking, and dancing. The scarcity of what they see as viable options, in combination with the lack of discussions with girls and young women on their preferred choice for physical activity, leads to lower rates of participation. When girls and young women are offered different options for physical activity, studies show there are increased levels of autonomy, self-determination, and participation.14 Studies also suggest that accounting for preferences when developing physical education curricula and after-school physical activity programs can increase participation among young women.15

Men prefer different types of physical activity than women. Unsurprisingly, men prefer strength training, and women tend to prefer moderate intensity cardiovascular activities.16 One study found that when given a list of common exercises to perform, male teens and young adults chose strength training exercises and females chose low-impact cardiovascular activities.17 Interestingly, the benefits of physical activity differ for men and women depending on what types of exercise they participate in. One research team found that women who participate in regular, low-impact activities report higher levels of self-esteem and quality of life compared to women who participate in regular, high-intensity activities.18 These researchers found that the opposite is true for males, which suggests the need for a gender-tailored approach to engaging young adults in physical activity.

Gender Roles and Perceptions

Societal gender roles are strongly associated with young women’s lack of participation in physical activity. Children, youth, and young adults have differing views on the functionality of their bodies based on their biological sex.19  Notably, young women experience negative social feedback after participating in a school physical education class if they are not able to shower or change clothes because of how they appear to others, especially to boys.20 Teen women prioritize conforming to socially accepted ideals of beauty, which include being small, slight, and soft. This may come from the perceived lack of social capital for women participating in physical activity beyond maintaining feminine attractiveness.21

Positive body image is correlated with increased levels of physical activity,22 yet Utah women have low rates of body acceptance, which may be a factor in correlated low rates of physical activity. A 2017 UWLP report23 revealed the high rates of cosmetic surgery per capita in Salt Lake City in past years, which trumped that of Los Angeles and was second only to Miami. This report documented the problem that follows from society assessing a woman’s success based on her attractiveness, which reduces a woman’s identity and potential to the shape of her body and increases sexual objectification. 

Another study found that the benefits of physical activity, including reduced levels of stress, were lost if the motivating factor to exercise was weight loss or body toning.24 More specifically, it found that motivating reasons to exercise predicted quality of life outcomes for women over actual exercise. This is concerning as research has found that conforming to societal ideas of attractiveness, including thinness, is, again, young women’s main motivator to participate in physical activity. Encouraging girls and women of all ages to participate for reasons beyond maintaining or achieving attractiveness has been shown to increase their motivation to be physically active. 

Lack of Social Support

Social support from friends was noted as a key factor to girls and young women engaging in physical activity, yet many noted that social support from friends, parents, and teachers to participate was lacking. Girls and young women report less enjoyment in physical activity and less confidence in their abilities as they get older, which may stem from consistent lack of societal encouragement to be physically active, as well as societal pressure to not be competitive or strong.25 The lack of social support also appears in the inadequate facilities and gym attire provided for young women.26 Young women report inadequate changing and showering facilities, a lack of time for showering, and inappropriate gym attire (such as short skirts) as reasons they do not participate in physical education.27 Feeling self-conscious about their physical appearance while wearing exercise or fitness clothing is another barrier to participation in physical activity that teen women face.28

Additional Barriers for Women of Color

Several research studies have reported a variety of additional barriers related to physical activity for girls and women of color.29 For example, one Utah study found that, culturally, Pacific Islanders felt it was unacceptable for women to be in the sun and sweat, which could reduce women’s physical activity. In addition, research by the Women’s Sports Foundation found that the drop-out rate for urban girls of color doubles that of suburban white girls, largely due to increased poverty resulting in a lack of resources.30 Several studies identified hair health among young African American women as a barrier to physical activity.31 One team of qualitative researchers found that perspiration on hair and hair style maintenance, image, and social comparisons, along with the lack of solutions to overcome hair-related issues, were all barriers to physical activity for the women of color interviewed.32 Participants of the study also mentioned how the monetary and time burdens of fixing and maintaining hair styles further contributed to the issue.

Moving Forward

Since the passage of Title IX in 1972 mandated that federally funded educational institutions must provide women equal opportunity in sports, the number of women participating in sports went from one in 27 girls to today’s two in five girls participating.33 While large strides have been made in women’s sports, gaps still exist. According to The National Federation of State High School Associations, in 2018–2019, boys across the nation had 1.13 million more sports opportunities than girls.34 In Utah alone, close to 39,000 boys participate in sports compared to just over 28,000 girls. A nearly 1:1 male-to-female population ratio in Utah leaves almost 11,000 more opportunities for boys to participate in sports than girls.35 About 87% of the National Collegiate Athletic Association (NCAA) schools still provide disproportionately more opportunities to men.36

While there are many programs in Utah and the nation that promote physical activity, few have the specific goal of increasing physical activity levels of girls and young women. Although the problem is recognized, solutions have been slow to be adopted. Research has suggested the following recommendations to address and resolve these problems: 

First, parents and guardians should encourage physical activity for girls and young women. Fewer things have greater impact on a girl’s long-term physical activity levels than her parent’s own physical activity and their enthusiastic encouragement. Findings from the LOOK Longitudinal Study revealed that lower participation in physical activity among girls was associated with weaker influences at the school and family levels.37 These findings suggest that a girl’s lack of involvement in physical activity has roots in sociocultural norms and can be changed with education. Another study reviewed 180 nine-year-old girls and their parents to examine parenting strategies that led to long-term increases in their daughter’s physical activity levels.38 It was found that logistic support (e.g., registering their daughters for sports teams and facilitating transportation to sports events) and explicit modeling (such as the parents themselves participating in physical activity) led to increases in physical activity among the girls studied. The study also reported that having just one physically active parent can have a positive impact on a girl’s long-term participation in physical activity and overall health. 

Second, the most basic way to ensure that girls and women have physical activity options that are favorable to them is by asking what they enjoy doing and then tailoring physical activity options accordingly as preferences may vary by age group, particularly in school physical education classes. Studies39 have reported that girls and women are more likely to be physically active when they enjoy what they are doing and have opportunities to participate with friends and peers as well. 

Third, promote gender inclusivity in all types of sports. Researchers40 have found that gendered trends in sports limit teens’ potential by pressuring young men to participate in competitive sports while discouraging girls and young women from doing the same. Encouraging children to explore sports and physical activities that interest them, rather than the ones that girls typically play, can lead to increased interest and engagement.

Finally, improving the visibility of women’s athletics can improve girls’ and young women’s interest in sports, and it can increase societal interest as well. Ensuring that women athletes have access to adequate and equitable facilities, preventative care, media coverage,41 sponsorship, and funding can increase the credibility of women’s sports. In turn, the fanbase and social support will increase, resulting in expanded opportunities. An important byproduct will be the encouragement young women show for each other as they pursue athletics and, in the long term, a physically active life. 

Conclusion

The benefits of physical activity are clear, yet thousands of Utah girls and women are participating at significantly lower levels than boys and men. With only 28% of boys and 14% of girls meeting the recommended physical activity levels set by the state, change is needed for all.42 Exploring the barriers associated with the lower levels of participation, specifically for females, has laid the groundwork for the recommendations for change offered in this snapshot. The way forward requires parental involvement and role-modeling, asking girls and women what they want to do and then providing support for those activities (even if the choices are historically associated with the male gender), and making women’s athletic pursuits and events equally visible for everyone. Finding ways to increase the physical activity of girls and women will improve their overall health and wellbeing, which, in turn, will impact the health and wellbeing of Utah families, communities, and the state as a whole.

Acknowledgements

Special thanks to Angie Kleven for her research support and to our expert reviewers for their feedback: Lori Andersen Spruance (Brigham Young University), Robyn Bretzing (Alpine School District), Tim Brusseau (University of Utah), Ryan Burns (University of Utah), Liz Darger (Brigham Young University), Brett McIff (EPICC), Maya Miyairi (Utah State University), Brenda Ralls (EPICC), and Jason Slack (Utah Valley University). 

References

1. World Health Organization. (2020). Physical activity and women: Global strategy on diet, physical activity and health https://www.who.int/dietphysicalactivity/factsheet_women/en/

2. The Lancet Public Health. (2019, August 1). Time to tackle the physical activity gender gap. The Lancet, 4(8), E360. https://doi.org/ 10.1016/S2468-2667(19)30135-5

3. United Health Foundation. (2021). America’s health rankings annual report. https://www.americashealthrankings.org/explore/annual/measure/Sedentary/state/UT

4. World Health Organization. (2020).

5. United Health Foundation. (2021).

6. Utah Women & Leadership Project. (n.d.). Mission & History. https://www.usu.edu/uwlp/about/mission-history

7. U.S. Department of Health and Human Services. (2018). Physical activity guidelines for Americans, 2nd edition. https://health.gov/sites/default/files/2019-09/Physical_Activity_Guidelines_2nd_edition.pdf

8. CDC. (n.d.). Lifestyle coach facilitation guide: Post-core. https://www.cdc.gov/diabetes/prevention/pdf/postcurriculum_session8.pdf; Adams, M. A., Johnson, W. D., & Tudor-Locke, C. (2013). Steps/day translation of the moderate-to-vigorous physical activity guideline for children and adolescents. International Journal of Behavioral Nutrition and Physical Activity, 10(1), 733–733. https://doi.org/ 10.1186/1479-5868-10-49

9. Utah Department of Health. (2021, January 5). Health indicator report of physical activity among adolescents. Public Health Indicator Based Information System (IBIS). https://ibis.health.utah.gov/ibisph-view/indicator/view/PhysActAdol.html

10. American College Health Association. (2021). American College Health Association: National college health assessment III: Utah State University executive summary spring 2021. American College Health Association.

11. Rees, R., Kavanagh, J., Harden, A., Shepherd, J., Brunton, G., Oliver, S., & Oakley, A. (2006). Young people and physical activity: A systematic review matching their views to effective interventions. Health Education Research, 21(6), 806–825. https://doi.org/ 10.1093/her/cyl120

12. Utah Department of Health. (2021, January 5).

13. Larson, J. N., Hannon, J. C., & Brusseau, T. A. (2015). Physical activity interventions in middle school and high school girls a review. Sport Science Review, 24(1–2), 41–70. https://doi.org/10.1515/ssr-2015-0008

14. Larson, J. N., Hannon, J. C., & Brusseau, T. A. (2015); Rees, R. et al. (2006).

15. Larson, J. N., Hannon, J. C., & Brusseau, T. A. (2015).

16. Reading, J. M., & Gokee LaRose, J. (2020). Exercise preferences among young adults: Do men and women want different things? Journal of American College Health. https://doi.org/10.1080/07448481.2020.1803878

17. Oyibo, K., & Vassileva, J. (2020). Gender preference and difference in behavior modeling in fitness applications: A mixed-method approach. Multimodal Technologies and Interaction, 4(21), 21. https://doi.org/ 10.3390/mti4020021

18. Lustyk, M. K. B., Widman, L., Paschane, A. A. E., & Olson, K. C. (2004). Physical activity and quality of life: Assessing the influence of activity frequency, intensity, volume, and motives. Behavioral Medicine, 30(3), 124–131. https://doi.org/10.3200/BMED.30.3.124-132.

19. Metcalfe, S. N., & Lindsey, I. (2020, May 1). Gendered trends in young people’s participation in active lifestyles: The need for a gender-neutral narrative. European Physical Education Review, 26(2), 535–551. https://doi.org /10.1177/1356336X19874095

20. Yungblut, H. E., Schinke, R. J., & McGannon, K. R. (2012). Views of adolescent female youth on physical activity during adolescence. Journal of Sports Science and Medicine, 11(1), 39–50. https://www.ncbi.nlm.nih.gov/pmc/articles/PMC3737842/

21. Metcalfe, S. N., & Lindsey, I. (2020, May 1).

22. Kantanista, A., Osiński, W., Borowiec, J., Tomczak, M., & Król-Zielińska, M. (2015). Body image, BMI, and physical activity in girls and boys aged 14–16 years. Body Image, 15, 40–43. https://doi.org/10.1016/j.bodyim.2015.05.001

23. Madsen, S. R., Dillon, J., & Scribner, R. T. (2017, April 10). Cosmetic surgery and body image among Utah women. Utah Women & Leadership Project. https://www.usu.edu/uwlp/files/snapshot/20.pdf

24. Craft, B. B., Carroll, H. A., & Lustyk, M. K. B. (2014). Gender differences in exercise habits and quality of life reports: Assessing the moderating effects of reasons for exercise. International Journal of Liberal Arts and Social Sciences, 2(5), 65–76. https://www.ncbi.nlm. nih.gov/pmc/articles/PMC5033515/

25. Cavallo, D. N., Brown, J. D., Tate, D. F., DeVellis, R. F., Zimmer, C., & Ammerman, A. S. (2014). The role of companionship, esteem, and informational support in explaining physical activity among young women in an online social network intervention. Journal of Behavioral Medicine, 37, 955–966. https://doi.org/10.1007/s10865-013-9534-5

26. Larson, J. N., Hannon, J. C., & Brusseau, T. A. (2015).

27. Rees, R., et al. (2006).

28. Lambert, C., Beck, B. R., Watson, S. L., Harding, A. T., & Weeks, B. K. (2020). Enjoyment and acceptability of different exercise modalities to improve bone health in young adult women. Health Promotion Journal of Australia, 31(3), 369–380. https://doi.org/10.1002/hpja.321

29. Simonsen, S. E., Digre, K. B., Ralls, B., Mukundente, V., Davis, F. A., Rickard, S., Tavake-Pasi, F., Napia, E., Aiono, H., Chirpich, M., Stark, L. A., Sunada, G., Keen, K., Johnston, L., Frost, C. J., Varner, M. W., & Alder, S. C. (2015). A gender-based approach to developing a healthy lifestyle and healthy weight intervention for diverse Utah women. Evaluation and Program Planning, 51, 8–16. https://doi.org/10.1016/j.evalprogplan.2014.12.003

30. Staurowsky, E. J., Watanabe, N., Cooper, J., Cooky, C., Lough, N., Paule-Koba, A., Pharr, J., Williams, S., Cummings, S., Issokson-Silver, K., & Snyder, M. (2020). Chasing equity: The triumphs, challenges, and opportunities in sports for girls and women. Women’s Sports Foundation. https://www.womenssportsfoundation.org/wp-content/uploads/2020/01/Chasing-Equity-Executive-Summary.pdf

31. O’Brien-Richardson, P. (2019). The case for hair health in health education: Exploring hair and physical activity among urban African American girls. American Journal of Health Education, 50(2), 135–145. https://doi.org/10.1080/19325037.2019.1571959

32. Joseph, R. P., Coe, K., Ainsworth, B. E., Hooker, S. P., Mathis, L., & Keller, C. (2018). Hair as a barrier to physical activity among African American women: A qualitative exploration. Frontiers in Public Health, 5(367), 1–8. https://doi.org/10.3389/fpubh.2017.00367

33. Women’s Sports Foundation. (2016, September 2). Title IX and the rise of female athletes in America. Women’s Sports Foundation. https://www.womenssportsfoundation.org/education/title-ix-and-the-rise-of-female-athletes-in-america/

34. The National Federation of State High School Associations. (2019). 2018–19 High school athletics participation survey. https://www.nfhs.org/media/1020412/2018-19_participation_survey.pdf

35. The National Federation of State High School Associations. (2019).

36. Staurowsky, E. J. et al. (2020).

37. Telford R. M., Telford, R. D., Olive, L. S., Cochrane, T., Davey, R. (2016, March 9). Why are girls less physically active than boys? Findings from the LOOK longitudinal study. PLOS ONE, 11(3). https://doi.org/10.1371/journal.pone.0150041

38. Krahnstoever Davison, K., Cutting, T. M., & Birch, L. L. (2003). Parents’ activity-related parenting practices predict girls’ physical activity. Medicine and Science in Sports & Exercise, 35(9), 1589–1595. https://doi.org/10.1249/01.MSS.0000084524.19408.0C

39. Larson, J. N., Hannon, J. C., & Brusseau, T. A. (2015, May 9).

40. Metcalfe, S. N., & Lindsey, I. (2020, May 1).

41. Seltzer, R. (2021, March 26). NCAA hires law firm to review inequities amid basketball tournament blowback. Inside Higher Ed. https://www.insidehighered.com/quicktakes/2021/03/26/ncaa-hires-law-firm-review-inequities-amid-basketball-tournament-blowback

42. Utah Department of Health. (2021, January 5).

Citation

Buesser K, Myrer R, & Madsen SR. (2022). Utah Girls, Young Women, and Physical Activity. Utah Women’s Health Review. doi: 10.26054/0d-4vqm-fg3d

PDF

View / download

Association Between Pre-pregnancy and Pregnancy Physical Abuse, Partner-related Stress, and Post-partum Depression: Findings from the Utah Pregnancy Risk Assessment and Monitoring System (UT-PRAMS), 2016-2018

Research Synopsis

Study question: What is the relationship between pre-pregnancy and pregnancy physical abuse, stressful life events, and post-partum depression (PPD)?

What’s already known: Previous research has shown that physical abuse occurring during pre-pregnancy and prenatal is associated with PPD, but limited research has investigated the interplay between physical abuse, life stress, and PPD.

What this study adds: Among a representative Utah population of 142,963 women, 16% reported PPD between 2016 and 2018. Reproductive history and life stress (partner-related, traumatic, financial, and emotional), women with a history of physical abuse had a 1.56 higher adjusted prevalence ratio (95% CI: 1.19, 2.07) of experiencing PPD compared to their counterparts after adjusting for sociodemographic factors. In addition, partner-related stress was also independently associated with PPD, with a 1.32 higher prevalence ratio (95% CI: 1.07, 1.65) of PPD among women reporting partner-related stress compared to those who did not, adjusting for the same factors.

Abstract

Objective: To assess whether a history of physical abuse and stressful life events were associated with postpartum depression (PPD) among at-risk women.

Methods: Included were Utah women who gave birth between 2016 and 2018 who agreed to participate in the Utah Pregnancy Risk Monitoring System (UT-PRAMS). UT-PRAMs follows a stratified systematic sampling scheme, oversampling on lower levels of education and lower infant birth weight. Considering important confounding factors and a stratified sampling scheme, relationships between maternal history of physical abuse, life stressors (partner, traumatic, financial, or emotional stressors), and PPD were assessed via Poisson regression models with robust error variance.

Results: From January 1, 2016, to December 31, 2018, 4,101 participants, representative of an estimated population of 142,963 women, completed the UT-PRAMS survey. After adjusting for maternal age, race/ethnicity, education, income, marital status, prior preterm births, parity, depression before and during pregnancy, tobacco or alcohol use and life stressors, women who experienced pre-pregnancy or prenatal physical abuse had a 1.56 (9% CI, 1.19, 2.07) higher adjusted prevalence ratio compared to women who did not. In the same fully adjusted model, partner-related stress was also independently associated with PPD (aPR 1.32; 95% CI, 1.07, 1.65).

Conclusion: Physical abuse and partner-related stress (including divorce/separation, frequent arguments, partner who is not supportive of the pregnancy) were significant predictors of PPD after accounting for numerous other sociodemographic, lifestyle, and health history indicators.

Introduction

Negative consequences of post-partum depression (PPD) are significant, for both birthing parents and their offspring.1-6 Morbidity and mortality associated with PPD are deserving of increased scrutiny overall and especially in Utah, the nation’s youngest state (median age 30.5 years)7 and fourth-most fertile state, with a fertility rate of 68.4 births per 1,000 women aged 15 through 44 years.8 National prevalence of PPD among postpartum women is 12.5 percent9; in Utah, the PPD prevalence is 15.3 percent among mothers.

Several factors known to contribute to risk for PPD are pronounced in Utah.10 The state ranks last in the nation for pay parity between men and women.11 A growing body of research demonstrates that socioeconomic factors, including lack of pay parity, may collectively have multiplicative synergistic impact on adverse health outcomes, including depression and addiction.12-15 Significantly, an estimated 36.9 percent of Utah women have been victims of domestic violence, compared to the national average of approximately 25 percent, and Utah is rated the 17th-worst state in the nation for domestic violence.7

The 2-fold purpose of this study was to examine (1) the association between physical abuse (pre-pregnancy and prenatal) and PPD and (2) the impact of stressful life events on the risk of PPD.16, 17 A better understanding of the predictors of PPD may be instrumental in designing and implementing interventions that have the potential to decrease the incidence of PPD and its adverse impacts.

Methods

Study Population: This cross-sectional study18 was conducted among women who participated in the Utah Pregnancy Risk Assessment Monitory System (UT-PRAMS) survey between January 1, 2016, and December 31, 2018, recalling pre-pregnancy, prenatal, and early postpartum events and exposures. PRAMS is a surveillance program of the US Centers for Disease Control and Prevention (CDC) that gathers data across the nation (most states and territories as well as tribal and local health departments) and provides geographic-specific data critical in accomplishing its primary goal of reducing infant mortality, which is a common world-wide measure of overall national health.19 Since its inception in 1987, PRAMS has been utilized as a useful data source in ascertaining the changing risks and health outcomes associated with pregnancy for women and children. In addition to measuring pregnancy health, data is collected on socioeconomic status, life experiences, and quality of life, with the additional goals of mitigating risks and adverse health outcomes for women and children.

To address health risks and outcomes that are most pertinent to their unique populations, states and territories maintain a measure of control over stratifying data collection. UT-PRAMS oversamples women of lower education levels and infant birth weight to purposely capture data on a known high-risk population.20 Approximately 200 women are contacted each month and asked to complete the survey. Those contacted are randomly selected within each stratum.

Primary Exposure, Physical Abuse: The primary exposure of interest was physical abuse experienced before and during pregnancy. Participants were asked the following questions: (1) “In the 12 months before you got pregnant with your new baby, did any of the following people push, hit, slap, kick, choke, or physically hurt you in any other way?”, with options being“husband or partner,” “ex-husband or ex-partner,” and “someone else.” Participants were instructed “for each person to check ‘No’ if they did not hurt you during this time or ‘Yes’ if they did.” (2) A similar question was asked for the period of pregnancy, switching the first part of the question to “During your most recent pregnancy.”

Secondary Exposure, Life Stress: The secondary exposure of interest for this study was life stress. The Phase 8 PRAMS questionnaire includes 13 questions regarding specific stressful events in the 12-month period prior to the birth of the child. The stressful events listed are (in order asked):

(1) A close family member was very sick and had to go into the hospital;
(2) I got separated or divorced from my husband or partner;
(3) I moved to a new address;
(4) I was homeless or had to sleep outside, in a car, or in a shelter;
(5) My husband or partner lost his job;
(6) I lost my job even though I wanted to go on working;
(7) My husband, partner, or I had a cut in work hours or pay;
(8) I was apart from my husband or partner due to military deployment or extended work related travel;
(9) I argued with my husband or partner more than usual;
(10) My husband or partner said he didn’t want me to be pregnant;
(11) I had problems paying the rent, mortgage, or other bills;
(12) My husband, partner, or I went to jail;
(13) Someone very close to me had a problem with drinking or drugs;
(14) Someone very close to me died.

A dichotomous variable (yes/no) was used for each event, and the events were categorized into 1 of 4 groups: partner-related stress (questions 2, 7, 8, 9), traumatic stress (questions 4, 11, 12), financial stress (questions 5, 6, 7, 10) and emotional stress (question 1). Question 3 (move to new address) was not included in our analysis given that the outcome could be either a positive or negative experience.21

Primary Outcome: Postpartum Depression: The primary outcome measure of interest for this study was PPD, which was determined by having answered “always” or “often” to either of the following 2 UT-PRAMS questions that captured postpartum depressed mood and anhedonia: (1) “Since your new baby was born, how often have you felt down, depressed, or hopeless?”, and (2) “Since your new baby was born, how often have you had little interest or little pleasure in doing things you usually enjoyed?”

Covariates: Covariates considered as potential confounding factors known to impact risk of abuse, life stress, and PPD included maternal age (continuous), race (White/non-White), ethnicity (Hispanic/non-Hispanic), marital status (married/not married), income level (≤$30,000, $30,000-$55,000, ≥$55,000), parity (continuous), history of preterm birth (yes/no), tobacco or alcohol consumption in past 2 years (yes/no), and depression before or during index pregnancy (yes/no). Lower educational attainment has also been shown to be more common among women who experience PPD,22-24 and the differences between the overall population of Utah women and the study participants are shown in Figure 1. Accounting for some missing data, 58 individuals surveyed in this data sample were under the age of 18 years and too young to have achieved education levels measured here.

Statistical Analysis: Sociodemographic and health history characteristics among women with and without PPD were compared using the chi-square test for categorical and t test for continuous variables, considering the complex sampling design. To test the association between physical abuse, life stressors, and PPD, unadjusted and adjusted robust Poisson distribution models were used to estimate unadjusted and adjusted prevalence ratios (PR) and 95% confidence intervals (CI). Adjusted models considered maternal age, race/ethnicity, education, income, marital status, prior preterm births, parity, depression before and during pregnancy, and tobacco or alcohol use in last 2 years. An additional adjustment for pre-pregnancy and prenatal partner-related, traumatic, financial, and emotional stress was done for the final model looking at physical abuse and PPD. Similarly, an additional adjustment for pre-pregnancy and prenatal physical abuse was done for the final model looking at stressful life events and PPD. Data analysis was generated using SAS software version 9.4 (SAS Institute, Inc., Cary, NC) and Stata Software 14.2 (StataCorp, LLC, College Station, TX).

Results

Sample Characteristics: A total of 4,101 women, representing 142,963 Utah women who delivered during that time frame, completed the UT-PRAMS survey between 2016 and 2018. Among the respondents, 72.7 percent were White, 15.0 percent White-Hispanic, 5.3 percent non-White–Hispanic, and 7.0 percent non-White, non-Hispanic. Over 77 percent of study subjects were married, 20.2 percent never married, and 2.3 percent divorced or widowed. The mean age was 28.4 years (range, 15-44 years), with approximately 22 percent living at very low income levels of $20,000 or less per year, and the highest education level of almost half of the participants (46.8%) was a high school diploma. While the World Population Review reports that nearly 37 percent of Utah women experience abuse in their lifetimes,7 only 5 percent of respondents in this study reported pre-pregnancy and/or prenatal abuse. Women with PPD compared to women without PPD were inclined to be younger, unmarried, and more likely to consume alcohol, smoke, and have a history of depression and life stress (Table 1). They also leaned toward lower education and income levels (Figures 2 and 3).

Physical Abuse and Postpartum Depression: Four percent of women reported abuse, with 3 percent reporting abuse during pregnancy (1% by husband or partner, 1% by ex-husband or ex-partner, and 1% by someone else) and 4 percent reporting abuse before pregnancy (1% by husband or partner, 2% by ex-husband or ex-partner, and 1% by someone else). Twelve percent of women with any abuse prior to or during pregnancy experienced PPD compared to 3% of women who did not report abuse (Table 1). In the unadjusted analyses, women who experienced any physical abuse had a 3.06 higher PR (95% CI, 2.43, 3.85) of having PPD compared to women who did not (Table 2). After adjusting for maternal age, race/ethnicity, education, income, marital status, prior preterm births, parity, depression before and during pregnancy, and smoking or alcohol consumption in the last two years, the aPR was 1.74 (95% CI, 1.32, 2.29). Further adjustment for partner-related, traumatic, financial, and emotional stress did not appreciably alter findings (aPR 1.56; 95% CI, 1.19, 2.07) (Table 2).

Life Stressors and Postpartum Depression: Among the total sample, 25 percent of women reported partner-related stress (42% with PPD and 22% without PPD), 12 percent traumatic stress (24% with PPD and 10% without PPD), 47 percent financial stress (57% with PPD and 45% without PPD), and 28 percent emotional stress (34% with PPD and 27% without PPD) (Table 1). In the unadjusted analyses, women who experienced any partner-related, traumatic, financial, or emotional stress had a 2.12 higher PR (95% CI, 1.77, 2.53), 2.35 higher PR (95% CI, 1.93, 2.84), 1.53 higher PR (95% CI, 1.28, 1.84), and 1.29 higher PR (95% CI: 1.07, 1.56) of having PPD, respectively, than women who did not (Table 2). Adjustment for potential confounders including other stressors and physical abuse attenuated the results. However, women who reported partner-related stress, compared to those who did not, still showed a 32 percent higher prevalence of PPD (95% CI, 7%-65%) (Table 2).

Discussion

Findings from this study revealed that women who were exposed to pre-pregnancy and prenatal abuse were at a 1.6 higher probability for PPD after considering numerous confounding factors such as life stressors in the year before birth. The results also suggested that exposure to life stressors, notably partner-related stress, is associated with a 1.3 higher probability of PPD after similar adjustment. Age, educational attainment, income, and marital status, among other elements, are known demographic factors that may reliably predict PPD risk. Screening of these demographic indicators in conjunction with careful exploration of exposure to partner-related abuse and experienced stress may provide opportunities for PPD prevention and mitigation interventions.

The findings from the UT-PRAMS data are validated by other studies in both low-income and high-income countries.25-29 For example, a study by Desmaraids et al. conducted in Western Canada looking at intimate partner abuse before and during pregnancy showed that 84 percent with postpartum mental health problems reported abuse before pregnancy, and 70 percent experienced abuse during pregnancy.30Similarly, Tsai et al. employed secondary data analysis among women during pregnancy and postpartum in South Africa; the study reported a significant association between intimate partner violence and depression during pregnancy and postpartum.31 Additionally, this study found both independent and adjusted significant associations between physical abuse and PPD. In a study conducted in France, Gaillard and colleagues corroborated these findings with physical abuse and depression during pregnancy having significant associations with PPD.32 Although the present study utilized a cross-sectional study design, other studies using different methods arrived at similar findings and conclusions. Rogathi et al., in a prospective cohort study of postpartum depression among women who experienced intimate partner violence, showed that the odds of having postpartum depression increased by more than 3 times compared to women who did not.33 Similar to the present study, younger women were inclined to develop more PPD than older women.33

The effects of physical abuse, coupled with other social health factors, can be long-lasting. A study of physical, sexual, and social health factors with associated trajectories of maternal depressive symptoms in pregnant women showed that 32.7 percent of women manifested subclinical depressive symptoms with 9 percent showing persistent symptoms of depression up to 4 years postpartum.34

The present study also found that partner-related stress, such as arguments, was a significant predictor of PPD. This is consistent with findings from other studies.35 A Japanese study by Miura et al. revealed that verbal and physical abuse during pregnancy was significantly associated with PPD even after adjusting for potential confounders (OR=7.05, 95% CI, 2.23-10.55).35 The findings from Muira and colleagues are important for this present study because similar questions and responses were used in determining the occurrence of physical abuse. These similar results established the co-existence of physical and verbal abuse from intimate partners. Thus, establishing the history of exposure to physical violence and verbal abuse serves as an important measure in determining association. In a study conducted in Ohio, Das et al. concluded that a documented history of exposure to depression during pregnancy is significant in identifying mothers who are at higher risk of anxiety and stress. Furthermore, stressful life events determined by using the Life Events Questionnaire (LEQ) to measure the degree of life stress have been found to be significantly associated with the prevalence of PPD.27  Thus, these factors should be screened in combination with depression.36

Limitations

Our study has limitations. First, the outcome of interest, PPD, lacks an official medical diagnosis and is dependent on participant responses to survey data. While screening questions mimic validated clinical screening tools,37 they may not always correctly classify the actual condition of PPD. Second, an important demographic factor for which this data set differs from the overall Utah population is race and ethnicity. The dataset contains the following racial breakdown: 72.7 percent White, 6.9 percent non-White, non-Hispanic, and 20.3 percent Hispanic (higher than the national average). Thus, findings from this study will be generalizable for White and, to some extent, Hispanic women but no other minority groups prevalent in Utah.

Conclusion

It may be of value to explore the relative impact of specific factors associated with adverse outcomes, as this data may help inform decisions about use of finite resources in mitigating and preventing harm. Our study found that exposure to abuse before and during pregnancy, in addition to partner-related stress, were significant predictors of PPD. Further examination may be warranted to explore the interplay between partner-related physical abuse, life stressors, and perceived stress on risk of PPD, as women may suffer similar negative life events but appraise the impact or severity differently.

Acknowledgements

Data were provided by the Utah Pregnancy Risk Assessment Monitoring System, a project of the Utah Department of Health (UDOH), the Office of Vital Records and Health Statistics of the UDOH, and the Centers for Disease Control and Prevention (CDC) of the United States Department of Health and Human Services. The authors extend appreciation to the participants who made the study possible. This report does not represent the official views of the UDOH or CDC.

Funding: Dr. Karen Schliep was supported by a NIH National Institute of Aging (NIA) grant, “Hypertensive Disorders of Pregnancy and Subsequent Risk of Vascular Dementia, Alzheimer’s Disease, or Related Dementia: A Retrospective Cohort Study Taking into Account Mid-Life Mediating Factors” (K01AG058781). Dr. Charles R. Rogers was financially supported by 5 For the Fight, the University of Utah Huntsman Cancer Institute, the V Foundation for Cancer Research, and a NIH National Cancer Institute (NCI) grant (K01CA234319). The content is solely the responsibility of the authors and does not necessarily represent the official views of the NIH, 5 For the Fight, V Foundation for Cancer Research, Huntsman Cancer Institute, or the University of Utah.

References

1. Li Y, Long Z, Cao D, Cao F. Maternal history of child maltreatment and maternal depression risk in the perinatal  period: A longitudinal study. Child Abuse Neglect. 2017;63:192-201. doi:10.1016/j.chiabu.2016.12.001

2. Lara-Cinisomo S, Zhu K, Fei K, Bu Y, Weston AP, Ravat U. Traumatic events: exploring associations with maternal depression, infant bonding,  and oxytocin in Latina mothers. BMC Women’s Health. 2018;18:31. doi:10.1186/s12905-018-0520-5

3. Slomian J, Honvo G, Emonts P, Reginster J-Y, Bruyère O. Consequences of maternal postpartum depression: A systematic review of maternal and  infant outcomes. Women’s health (London, England). 2019;15:1745506519844044. doi:10.1177/1745506519844044

4. Swartz HA, Cyranowski JM, Cheng Y, Amole M. Moderators and mediators of a maternal depression treatment study: Impact of  maternal trauma and parenting on child outcomes. Comprehensive Psychiatry. 2018;86:123-130. doi:10.1016/j.comppsych.2018.08.001

5.  Tambelli R, Trentini C, Trovato A, Volpi B. Role of psychosocial risk factors in predicting maternal and paternal depressive  symptomatology during pregnancy. Infant Mental Health. 2019;40:541-556. doi:10.1002/imhj.21791

6.  Yu H, Jiang X, Bao W, Xu G, Yang R, Shen M. Association of intimate partner violence during pregnancy, prenatal depression, and  adverse birth outcomes in Wuhan, China. BMC Pregnancy Childbirth. 2018;18:469. doi:10.1186/s12884-018-2113-6

7. World Population Review. Domestic violence by state.  https://worldpopulationreview.com/state-rankings/domestic-violence-by-state. Published 2020. Accessed July 8, 2020.

8.  Centers for Disease Control and Prevention. Fertility rate by state. National Center for Health Statistics. https://www.cdc.gov/nchs/pressroom/sosmap/fertility_rate/fertility_rates.htm. Published 2020. Accessed July 9, 2020.

9. Foundation UH. America’s health rankings. https://www.americashealthrankings.org/explore/health-of-women-and-children/measure/postpartum_depression/state/UT. Published 2020. Accessed July 25, 2020.

10. Ogbo FA, Eastwood J, Hendry A, et al. Determinants of antenatal depression and postnatal depression in Australia. BMC Psychiatry. 2018;18:49. doi:10.1186/s12888-018-1598-x

11. Davidson L. Utah now has America’s biggest gender wage gap – women earn 70 cents on the dollar compared to men. Salt Lake Tribune. https://www.sltrib.com/news/politics/2018/04/10/utah-now-has-americas-biggest-gender-wage-gap-women-earn-70-cents-on-the-dollar-compared-to-men/. Published 2018. Accessed July 9, 2020.

12. Assari S. Social determinants of depression: The Intersections of race, gender, and  socioeconomic status. Brain Sciences. 2017;7doi:10.3390/brainsci7120156

13. Fornili K. The opioid crisis, suicides, and related conditions: Multiple clustered syndemics,  not singular epidemics. Journal of Addictions Nurs. 2018;29:214-220. doi:10.1097/JAN.0000000000000240

14. Singer M. Introduction to syndemics: A critical systems approach to public and community health. John Wiley & Sons. 2009;

15. Singer M, Bulled N, Ostrach B, Mendenhall E. Syndemics and the biosocial conception of health. Lancet (London, England). 2017;389:941-950. doi:10.1016/S0140-6736(17)30003-X

16. Riggs DS, Caulfield MB, Street AE. Risk for domestic violence: factors associated with perpetration and victimization. Clinical Psychol. 2000;56:1289-1316. doi:10.1002/1097-4679(200010)56:10<1289::AID-JCLP4>3.0.CO;2-Z

17. Silveira MF, Mesenburg MA, Bertoldi AD, et al. The association between disrespect and abuse of women during childbirth and  postpartum depression: Findings from the 2015 Pelotas birth cohort study. Affect Disord. 2019;256:441-447. doi:10.1016/j.jad.2019.06.016

18. Mann CJ. Observational research methods. Research design II: cohort, cross sectional, and  case-control studies. Emerg Med. 2003;20:54-60. doi:10.1136/emj.20.1.54

19. Shulman HB, D’Angelo DV, Harrison L, Smith RA, Warner L. The Pregnancy Risk Assessment Monitoring System (PRAMS): Overview of design and methodology. Am Public Health. 2018;108:1305-1313. doi:10.2105/AJPH.2018.304563

20. Schliep KC, Denhalter D, Gren LH, Panushka KA, Singh TP, Varner MW. Factors in the hospital experience associated with postpartum breastfeeding success. Breastfeed Med. 2019;14:334-341. doi:10.1089/bfm.2018.0039

21. Morgan N, Christensen K, Skedros G, Kim S, Schliep K. Life stressors, hypertensive disorders of pregnancy, and preterm birth. J Psychosom Obstet Gynaecol. 2020:1-9. doi:10.1080/0167482X.2020.1778666

22. Chetty R, Stepner M, Abraham S, et al. Evidence for causal links between education and maternal and child health:  Systematic review. Med Int Health. 2019;24:1750-1766. doi:10.1111/tmi.13218

23. Ghaedrahmati M, Kazemi A, Kheirabadi G, Ebrahimi A, Bahrami M. Postpartum depression risk factors: A narrative review. Educ Health Promot. 2017;6:60. doi:10.4103/jehp.jehp_9_16

24. Smorti M, Ponti L, Pancetti F. A comprehensive analysis of post-partum depression risk factors: The role of  socio-demographic, individual, relational, and delivery characteristics. Front Public Health. 2019;7:295. doi:10.3389/fpubh.2019.00295

25. Alharbi AA, Abdulghani HM. Risk factors associated with postpartum depression in the Saudi population. Neuropsychiatr Dis Treat. 2014;10:311.

26. Norhayati M, Hazlina NN, Asrenee A, Emilin WW. Magnitude and risk factors for postpartum symptoms: A literature review. J Affect Disord. 2015;175:34-52.

27. Nurbaeti I, Deoisres W, Hengudomsub P. Association between psychosocial factors and postpartum depression in South Jakarta, Indonesia.  BMJ Sex Reprod Health. 2019;20:72-76.

28. Roelens K, Verstraelen H, Van Egmond K, Temmerman M. Disclosure and health-seeking behaviour following intimate partner violence before and during pregnancy in Flanders, Belgium: a survey surveillance study. Eur J of Obstet Gynecol Reprod Biol. 2008;137(1):37-42.

29. Sørbø MF, Grimstad H, Bjørngaard JH, Lukasse M, Schei B. Adult physical, sexual, and emotional abuse and postpartum depression, a population based, prospective study of 53,065 women in the Norwegian Mother and Child Cohort Study. BMC Pregnancy Childbirth. 2014;14(1):1-9.

30. Desmarais SL, Pritchard A, Lowder EM, Janssen PA. Intimate partner abuse before and during pregnancy as risk factors for postpartum mental health problems. BMC Pregnancy Childbirth. 2014;14(1):1-12.

31. Tsai AC, Tomlinson M, Comulada WS, Rotheram-Borus MJ. Intimate partner violence and depression symptom severity among South African women during pregnancy and postpartum: Population-based prospective cohort study. PLoS Med. 2016;13(1):e1001943.

32. Adeline Gaillard YLS, Laurent Mandelbrot, Hawa Keita, Caroline Dubertret. Predictors of postpartum depression: Prospective study of 264 women followed during pregnancy and postpartum. Psychiatry Res. 2014;215:341-6.

33. Rogathi JJ, Manongi R, Mushi D, et al. Postpartum depression among women who have experienced intimate partner violence: A prospective cohort study at Moshi, Tanzania. J Affect Disord. 2017;218:238-245.

34. Giallo R, Pilkington P, McDonald E, Gartland D, Woolhouse H, Brown S. Physical, sexual and social health factors associated with the trajectories of maternal depressive symptoms from pregnancy to 4 years postpartum. Soc Psychiatry Psychiatr Epidemiol. 2017;52(7):815-828.

35. Miura A, Fujiwara T. Intimate partner violence during pregnancy and postpartum depression in Japan: A cross-sectional study. Front Public Health. 2017;5:81.

36. Das A, Gordon-Ocejo G, Kumar M, Kumar N, Needlman R. Association of the previous history of maternal depression with post-partum depression, anxiety, and stress in the neonatal intensive care unit. J Matern-Fetal Neonatal Med. 2021;34(11):1741-1746.

37. Gjerdingen DK, Yawn BP. Postpartum depression screening: Importance, methods, barriers, and recommendations for practice. J Am Board Fam Med. 2007;20:280 – 288. doi:10.3122/jabfm.2007.03.060171

Citation

K Kah, J Dailey-Provost, JB Stanford, CR Rogers, & K Schliep. (2022). Association Between Pre-pregnancy and Pregnancy Physical Abuse, Partner-related Stress, and Post-partum Depression: Findings from the Utah Pregnancy Risk Assessment and Monitoring System (UT-PRAMS), 2016-2018. Utah Women’s Health Review. https://doi.org/10.26054/0d-0tbc-7vhj

PDF

View / download

Exploring the Dimensions of Adolescent Pregnancy Intendedness, Wantedness, and Planning

Synopsis

Study question: How do pregnant adolescent women perceive and understand the pregnancy classification terms “planned,” “wanted,” and “unintended” used by the National Survey of Family Growth?
What is already known: The clinical relevance of measuring intended and unintended pregnancy in the National Survey of Family Growth (NSFG) is unclear, particularly to the adolescent population. While modernized measurements are available, more investigation is needed on how pregnant adolescent women conceptualize and relate to their pregnancies. 
What this study adds: Pregnant adolescent women relate to the concepts of planning and wanting pregnancy as distinct and different concepts, while they do not relate to the terms intended or unintended pregnancy. The classifications used by NSFG may therefore not accurately capture the lived experience for adolescent women. This may cause pregnant adolescent women to inadvertently misclassify their pregnancies, thereby obscuring appropriate targets for intervention.

Abstract

Objective: To clarify how pregnant adolescent women relate to terms and concepts used by the National Survey of Family Growth (NSFG) regarding unintended pregnancies, specifically the classification terms of “planned,” “wanted,” and “intended” pregnancies. NSFG is a tool designed to measure pregnancy intendedness in order to inform health and social service programs.

Methods: We conducted in-depth interviews with 28 pregnant adolescent women. Interviews explored how each woman understood the classification terms used in the NSFG (intendedness, wantedness, and planned) and conceptualized her pregnancy. 

Results: Most pregnant adolescent women designated their pregnancy as unintended and unplanned. While most women had a clear ideal for a planned and wanted pregnancy and did not currently experience these ideals, many still considered their pregnancy to be wanted. Partner and family support were associated with the wantedness of a pregnancy by the woman. Women experienced confusion about the term “intended” and offered varying interpretations thereof. 

Conclusions: The NSFG classifications do not accurately capture the lived experience for pregnant adolescent women, who may consequently misclassify their pregnancy. 

Implications: Findings support the continued development of tools that more accurately define and reflect the complexity of adolescents’ pregnancy experiences and provide more relevant classifications, such as pregnancy acceptability, for public health and clinical practice.

Introduction

Unintended pregnancies are more likely than intended pregnancies to result in low birth weight, pre-term birth, elective abortion, maternal depression, and child abuse and neglect.1, 2 Due to these poor outcomes, researchers and government agencies have attempted to measure unintended pregnancies in the United States for decades. The National Survey of Family Growth (NSFG), a cross-sectional survey, is a major avenue for collecting these data.3 In this survey, which is completed by women aged 15-49, pregnancies are classified as “intended” if the woman reports she got pregnant at a time of her choice or later, “mistimed” if the woman reports she wanted a pregnancy in the future but not at that particular time, or “unwanted” if the woman reports she never wanted any more children.4 Both unwanted and mistimed pregnancies are classified as “unintended.” 

The validity of the data gathered from the NSFG has been called into question.1,5,6 Researchers argue that the cross-sectional, dichotomized nature of classifying pregnancies into two distinct categories—intended or unintended—misrepresents the complexity of the situation for many women.5,7–13 As a result, many pregnancies may be misclassified by the measurement, which may then obscure the appropriate targets for intervention to reduce associated negative outcomes.7,9,10,14–16 

We conducted the current study to explore how pregnant adolescents perceive and understand the pregnancy classification terms from the NSFG. In this phenomenological, cross-sectional qualitative study, we explored pregnant adolescent women’s perceptions to generate hypotheses about the dimensions and determinants of adolescent pregnancy intendedness. Ultimately, we wish this study to contribute to more meaningful measurement and improved prevention and outcome interventions.

Methods

Sampling and Recruitment

Women were eligible for the study if they were (a) pregnant, (b) younger than 18 years, and (c) able to speak English. We used purposive sampling to ensure we enrolled women of varying ethnicities (Hispanic and non-Hispanic) and who made various decisions about their pregnancies (completing the pregnancy and either keeping the baby or adopting the baby out, having an abortion). We recruited women from several clinics in Salt Lake City, Utah: a university-affiliated teenage-mother program, a woman’s clinic, and a local adoption agency. Women were approached in the clinics and invited to participate in the study. An initial questionnaire screened for eligibility. Eligible women were asked to sign an informed consent document. For women who consented, interviews took place that same day, in a private room in the clinic of recruitment. All research activities were approved by the University of Utah’s Institutional Review Board. 

Data Collection

We conducted 28 one-on-one interviews with pregnant women younger than 18 years. The interviews began with the standard questions used by the NSFG for pregnancy intendedness and then proceeded into open-ended questions (Table 1). Women were not told into which category they were classified by the NSFG questions. Interviews were conducted in Salt Lake City and surrounding suburbs from February 1996 to July 2003. Each interview was completed by a single interviewer (R.F. or D.H.). Both interviewers received training and feedback from senior study investigators, who included two psychologists and a family physician. All interviews utilized the same interview guide based on our previous research.10 This guide followed a semi-structured outline of points to cover and possible follow-up questions to address each point (see Appendix). The opening question for the semi-structured component of all interviews was “How do you feel about this pregnancy?”, with a follow-up question of “Why?” Each participant was asked if her pregnancy was planned, wanted, and intended, with follow-up questions of “Why?” The interviewer probed further to fully explore why the women answered the way they did and how they defined each NSFG term: intended, unintended, wanted, unwanted, planned, unplanned (Table 2). Participants were additionally asked what circumstances would make the pregnancy the opposite of what they answered (e.g., if their pregnancy was wanted, what would make it unwanted?). After each interview, basic demographic information was obtained. Interviews lasted between 30-45 minutes each and were transcribed verbatim. These transcripts were compared to the audio tape by the interviewer and corrected as needed. No compensation was provided to the participants. 

Analysis

Our analysis followed a phenomenological analytic approach, as outlined by Moustakas17 and Creswell and Poth.18 The primary coder (D.E.) read the transcripts several times; memos with initial impressions and possible broader meanings were recorded. From each transcript, significant phrases that reflected how each woman conceptualized her pregnancy were identified. These significant statements were then organized into larger themes or clusters. A codebook was created to represent the common lived experience for women in this study. This codebook included both deductive codes based on the NSFG terms and inductive codes based solely on the themes that emerged from the transcripts. 

Validation of this initial work was achieved through a second round of coding by more experienced researchers (J.S., L.G., and C.F.). Each read two complete transcripts, totaling 21% of the data. Multiple team meetings were conducted to discuss any discrepancies in the codebook and reach consensus. 

Results

Sample Description

Twenty-eight women participated in the interviews; 65% identified as White Non-Hispanic (n=18) and 35% identified as White and Hispanic (n=10), with no other minorities represented. The average age was 15.9 years, with ages ranging from 14 to 17 years. All participants had less than a high school education. Participants were not asked about gender identity or expression. All stages of pregnancy gestational age were represented, ranging from 6 to 34.5 weeks. Five participants were choosing to abort the pregnancy (18%), 2 were choosing adoption after birth (7%), and 21 were planning to keep the baby after birth (75%).

Themes

Intendedness

Overwhelmingly, participants classified their pregnancy as unintended. (We include their statements below, with participants’ ages in parentheses.) When asked why, most women cited being too young, for instance: “Cause I’m too young, I think, to be having a child at this age” (17y). Participants also classified pregnancies as unintended when they perceived it as a mistake or accident, e.g.: “It was unintended. I didn’t mean to get pregnant. I mean, it was a mistake in the first place, but now I’ve made the mistake, I’m gonna undo it” (16y). A lack of planning or trying for a pregnancy was another reason for classifying pregnancy as unintended. A representative response: “I wasn’t planning on getting pregnant even though you could say we were asking for it because we weren’t using birth control or anything, so we weren’t planning it” (17y). 

Participants offered varying meanings of the word intended. First, several participants expressed the idea that just having sex makes a pregnancy intended because the woman knows the consequences. One participant stated: “Well, because I knew what I was doing and so I knew that if I had sex, I would have a possible chance to get pregnant” (15y). A second interpretation of intended was that planned pregnancies were intended and accidental pregnancies were unintended. Intended was “wanting to have it and we planned it” and unintended was “that you didn’t want to have it, probably it was just an accident” (17y). 

A third definition came from a 16-year-old participant. She believed that pregnancy was divinely intended or unintended, and stated: 

I think if God intended you to have a child, then you’re intended to have it, then you should, and then you should be the one to take care of it. I think if you’re intended to have kids then you’re gonna have ‘em or there’s something that’s gonna stop that. 

When asked what would make their pregnancy intended, many participants were unsure of what this term meant, with one bluntly stating: “I don’t know what that means” (16y). Several asked clarifying questions, such as: “What does intended mean—planned or unplanned?” (16y) or “What does that mean? Intended, like did we want it to happen?” (15y)

Planning 

Most participants identified their pregnancy as unplanned. Many participants identified problems using birth control as the reason for the unplanned pregnancy—including birth control failure, not using birth control correctly, or not using birth control at all. Several women blamed condom failure, including a 15-year-old woman who became pregnant after her first sexual intercourse: “obviously it broke because that happened.” Inconsistent birth control usage was also named as a reason for an unplanned pregnancy. Several women stated that they just did not use birth control, resulting in an unplanned pregnancy: “But again, I knew the consequences and I knew about condoms. I knew about pills and everything, and I didn’t do it” (15y).

Participants also referred to a lack of preconception planning and preparedness with their partner or family as a reason for their unplanned pregnancy. One woman specified, “When you plan for it, you actually sit down and, well, this much money will go to the baby and try to like figure finances and stuff like that, but we didn’t do that. So, it was unplanned” (16y). 

Almost universally, these adolescent women characterized their pregnancy as mistimed and expressed a desire to be older before pregnancy. One woman articulated: “I am going to be a senior in high school, and I don’t have any money. I have goals where I am going to be a big thing when I grow up and you know. You can’t have a baby and do all the stuff at the same time” (17y). 

Nearly all participants expressed an unambiguous view of what an ideal planned pregnancy involves: being older, being financially secure, and planning with their partner beforehand. For most women, their actual situation was the opposite of their ideal. Many participants were facing very difficult financial situations: living with their parents and struggling to become financially independent with little education and little opportunity. When asked what she would do to plan a pregnancy, one woman expressed: “I’d make sure I was ready. Like financially and everything like that. I want to get an apartment before I have another kid” (15y). 

Wantedness

The terms of wanted/unwanted pregnancy seemed to invoke a deeper emotional reaction and more nuanced feelings than the terms intended/unintended and planned/unplanned did. Responses around wantedness often moved away from the choices and circumstance surrounding conception and toward the ongoing pregnancy and birth. While nearly all participants described their pregnancy as unplanned, mistimed, and unintended, many still declared their pregnancy wanted. For instance, one participant replied: “I’ve just always wanted kids; so, to me, even if it came at bad timing and I wasn’t married or anything, it would still be wanted” (16y). 

Wantedness could change throughout a pregnancy. Many adolescent women expressed initial unwantedness but, over the course of the pregnancy, came to want the pregnancy: “It’s not unwanted. Well, it was at first, but now, no” (16y). 

Family and partner support were very influential for nearly all women. Participants expressed how much they needed and desired family support throughout their pregnancy, whether they were planning an abortion, adopting out, or keeping the baby: “I couldn’t ask for a better mother… she came home and we talked about it… and we both know it’s not right to abort a baby, but under the circumstances, there was really nothing we could do. I kind of relaxed when she told me it was alright to do” (15y).

Family support significantly affected wantedness. A family supportive of the woman and her pregnancy was associated with a wanted pregnancy, and a family unsupportive of the pregnancy was associated with an unwanted pregnancy: “I never planned it and I guess it’s more wanted now than unwanted because of all the support that his family is giving me and my sister and him, but I’ll still need more support from my family longer” (17y). Conversely, when asked what would make her pregnancy unwanted, one participant stated, “not having any support of people around me” (16y). 

Partner support also affected whether a pregnancy was wanted. One participant expressed initial unwantedness, “but when I talked to him [the partner] about it, and he’s like, you know, don’t worry about it, I’m going to help you take care of it” (17y), she expressed deep wantedness and planned to keep the baby after birth. Conversely, when asked what would make their pregnancy wanted, one participant stated, “if my partner wasn’t such an asshole” (17y).

Our interviewers probed deeply into what exemplifies their ideal wanted pregnancy. The answers were similar across all clinics and pregnancy choices: having a supportive partner and family, being financially stable, graduating from school, and being older. 

Initial Feelings About Pregnancy

All but two participants expressed negative, surprised, or shocked feelings when finding out about the pregnancy. One woman expressed her initial reaction as “shocked. Very shocked. I didn’t expect it” (17y). 

Nearly all women expressed fear about their families’ reactions to the pregnancy, with one woman stating:

I was scared that maybe my mom, she didn’t want me to keep the baby, and she wanted me to get an abortion and I wouldn’t. I said no and she threatened me with lots of things and that was scary. I thought I would lose my mom through the whole thing because she was so upset. (16y) 

Participants were also fearful of how their families’ perception of them would change and of losing their support. For example, one participant expressed:  “Your parents think that you are a good kid. And all of a sudden, she is bad now, because look at what she did” (17y).

Discussion

We found that most adolescent pregnancies are unintended and unplanned but not necessarily unwanted. When discussing intendedness and planning, women focused on preconception circumstances; when discussing wantedness, women centered on support from others and their own feelings after conception. This finding is consistent with the conclusion of Gomez and colleagues that unplanned and unexpected pregnancies can sometimes still be welcomed.8 It is also consistent with our prior work that found a similar distinction between planning and wanting among adult women.10

The NSFG includes the following question: “Right before you became pregnant, did you yourself want to have a(nother) baby at any time in the future?”4 For most pregnant adolescent women, the answer is yes, but not currently. This response means the pregnancy will be classified as mistimed, and therefore also unintended. This classification fails to account for any differences in wantedness, which for most women in our sample was decided after conception. Important factors that help determine pregnancy outcomes—i.e., maternal acceptance of pregnancy, ceasing risky behaviors, and seeking prenatal care—are obscured in the overall classification of mistimed. Our findings are consistent with growing evidence that pregnancy acceptability might be an improved construct to better capture true lived experiences.11,12,19,20 Measuring pregnancy acceptability may classify adolescent pregnancies into more clinically relevant groups, distinct in varying levels of wantedness and resulting pregnancy actions, and provide a clearer picture of adolescent pregnancy and targets for intervention, both before and after conception. 

Our study suggests that pregnant adolescent women use widely varying interpretations of the word intended regarding pregnancy. Several women thought simply having sex—with its resulting consequences—created an intended pregnancy. Others thought intended pregnancies were planned before conception. Yet others believed pregnancy was divinely intended. Additionally, many women were very confused about the meaning of this term and could not provide a definite response to questions regarding intendedness. Although the word pair intendent/unintended is used in the NSFG classifications, intended is not a term that seems clear to pregnant adolescent women. 

Our findings highlight a chasm between the reality of pregnant adolescent women and their idealized views of a planned pregnancy. Most of our participants had goals around additional education, career development, stable relationships, and adequate finances; however, none of them experienced these ideals at the time of pregnancy and were facing situations of inadequate support and little opportunity. Other researchers suggest that preventing teenage pregnancy is a multifaceted, complex issue that involves more than just sexual education.21,22 Instead, it requires a collaborative conversation, a social determinants of health approach, and an examination of the root causes of teenage pregnancy.22 Rather than focusing purely on individual behavior change, a broader view is needed to improve the social, economic, and built environment pregnant adolescents inhabit. Our findings support these approaches.

Limitations

Our study faced several limitations. First, our sample was less diverse than the US population. However, our sample included both Hispanic and Non-Hispanic pregnant women younger than 18 years who represented the full spectrum of plans for pregnancy (keep, abort, or adopt). Second, our data were collected in the years 1996-2003. While some circumstances surrounding adolescent pregnancy have changed (i.e., more readily available contraceptives and a declining unintended pregnancy rate), current research suggests that very little has changed for the fundamental dynamics of planning or wanting a pregnancy.23 Our work adds to the limited availability of data in this field. Additionally, the core NSFG questions remain the same, and our results are consistent with research published recently, suggesting our data are relevant and reflect an ongoing need for this line of research.6 Third, as with the NSFG, our data are from a cross-sectional assessment of our participants’ views, and we do not have longitudinal assessments over time. However, several of our participants described significant shifts in their attitudes that had occurred prior to the interview.

Health Implications

Our results confirm that adolescent pregnancy is frequently fraught with social difficulties: initial apprehension, fear of others’ reactions, and difficult economic, living, and educational circumstances. Considering these difficulties, adolescent pregnancy prevention efforts should continue to be a major goal of health and social programs across the country. However, coupled with comprehensive sexual education and access to family planning, a more engaged conversation is needed: one that helps adolescent women envision a path toward their own ideals for future pregnancies, give them opportunity to succeed on this path, and help them see how current behavior affects their future. 

In addressing the issues of adolescent pregnancy, the NSFG classification of mistimed (a subcategory of unintended) does not capture the range of lived experiences for many pregnant adolescent women or identify potential target factors for achieving better outcomes. Aiken and colleagues hypothesize that women who judge their pregnancies to be acceptable—independent of planning and intention—will have more positive outcomes.19 We recommend employing instruments that incorporate questions about pregnancy desire, post-conception wantedness, and/or acceptability. More relevant measures will enable researchers and practitioners to reach the ultimate goal behind pregnancy measurement: (1) improved pregnancy outcomes for mothers and children and (2) enhanced reproductive agency and empowerment for women.

Implications for Practice

Our study adds to the existing evidence supporting the development of more robust and relevant concepts of pregnancy for adolescents, such as pregnancy acceptability. However, further inquiry is needed into designing and validating instruments for pregnancy acceptability and related concepts. Moving forward, we believe qualitative data is needed to understand the determinants of pregnancy acceptability.

In addressing adolescent pregnancy clinically or in public health, we confirm that different adolescent women may have very different attitudes and behaviors during pregnancy, ultimately affecting outcomes for both the mother and the baby. Assessing the gap between the adolescents’ ideal and actual circumstances may provide insight for the individual adolescent pregnancy. Finally, partner and family support are extremely influential for pregnancy outcomes for adolescent women. Understanding and assessing partner support and pregnancy wantedness may provide effective avenues for intervention.

Acknowledgements

Drs. M. Jann Dewitt and Penny Jameson helped develop and implement the interview process. Rachel Fischer conducted some of the interviews for this study.

Sources of Funding

The research was funded in part by the Division for Reproductive Health, US Centers for Disease Control, under an agreement through the Association for Prevention Teaching and Research, TS-0785.

Disclosure of Potential Conflicts of Interest

None reported.

References

1. Flink-Bochacki R, Meyn LA, Chen BA, Achilles SL, Chang JC, Borrero S. Examining intendedness among pregnancies ending in spontaneous abortion. Contraception. 2017;96(2):111-117. doi:10.1016/j.contraception.2017.05.010

2. Shah PS, Balkhair T, Ohlsson A, Beyene J, Scott F, Frick C. Intention to become pregnant and low birth weight and preterm birth: A systematic review. Matern Child Health J. 2011;15(2):205-216. doi:10.1007/s10995-009-0546-2

3. Centers for Disease Control and Prevention. National Survey of Family Growth. Accessed April 1, 2020. https://www.cdc.gov/nchs/nsfg/index.htm.

4. Centers for Disease Control and Prevention. 2015-2017 NSFG: Public-use data files, codebooks, and documentation. Accessed February 13, 2020. https://www.cdc.gov/nchs/nsfg/nsfg_2015_2017_puf.htm/.

5. Jones RK. Change and consistency in U.S. women’s pregnancy attitudes and association with contraceptive use. Conraception 2018;95(5):485-490. doi:10.1016/j.contraception.2017.01.009.

6. Shreffler KM, Greil AL, Mitchell KS, McQuillan J. Variation in pregnancy intendedness across U.S. women’s pregnancies. Matern Child Health J. 2015;19(5):932-938. doi:10.1007/s10995-014-1615-8

7. Arteaga S, Caton L, Gomez AM. Planned, unplanned and in-between: the meaning and context of pregnancy planning for young people. Contraception. 2019;99(1):16-21. doi:10.1016/j.contraception.2018.08.012

8. Gómez AM, Arteaga S, Villaseñor E, Arcara J, Freihart B. The misclassification of ambivalence in pregnancy intentions: A mixed‐methods analysis. Perspect Sex Reprod Health. 2019;51(1):7-15. doi:10.1363/psrh.12088

9. Mumford SL, Sapra KJ, King RB, Louis JF, Louis GMB. Pregnancy intentions–a complex construct and call for new measures. Fertil Steril. 2016;106(6):1453-1462. doi:10.1016/j.fertnstert.2016.07.1067

10. Stanford JB, Hobbs R, Jameson P, DeWitt MJ, Fischer RC. Defining dimensions of pregnancy intendedness. Matern Child Health J. 2000;4(3):183-189. doi:10.1023/a:1009575514205 

11. Rocca CH, Ralph LJ, Wilson M, Gould H, Foster DG. Psychometric evaluation of an instrument to measure prospective pregnancy preferences. Med Care. 2019;57(2):152-158. doi:10.1097/MLR.0000000000001048

12. Barrett G, Smith SC, Wellings K. Conceptualisation, development, and evaluation of a measure of unplanned pregnancy. J Epidemiol Community Health. 2004;58(5):426-433. doi:10.1136/jech.2003.014787

13. Guzzo, KB; Hayford S. Revisiting retrospective reporting of first-birth intendedness. Matern Child Heal Journal. 18(9):2141-2147. doi:10.1007/s10995-014-14627

14. Clear ER, Williams CM, Crosby RA. Female perceptions of male versus female intendedness at the time of teenage pregnancy. Matern Child Health J. 2012;16(9):1862-1869. doi:10.1007/s10995-011-0934-2

15. Fedorowicz AR, Hellerstedt WL, Schreiner PJ, Bolland JM. Associations of adolescent hopelessness and self-worth with pregnancy attempts and pregnancy desire. Am J Public Health. 2014;104(8):133-140. doi:10.2105/AJPH.2014.301914

16. Zabin LS, Astone NM, Emerson MR. Do adolescents want babies? The relationship between attitudes and behavior. J Res Adolesc. 2006;3(1):67-86. doi:10.1207/s15327795jra0301_4

17. Moustakas C. Phenomenological Research Methods. Thousand Oaks, CA: Sage; 1994.

18. Creswell, JW, Poth CN. Qualitative Inquiry and Research Design. Thousand Oaks, CA: Sage; 2018.

19. Aiken ARA, Borrero S, Callegari LS, Dehlendorf C. Rethinking the pregnancy planning paradigm: unintended conceptions or unrepresentative concepts? Perspect Sex Reprod Health. 2017;48(3):147-151. doi:10.1363/48e10316

20. Borrero S, Nikolajski C, Steinberg JR, et al. It just happens: A qualitative study exploring low-income women’s perspectives on pregnancy intention and planning. Contraception. 2015;91(2):150-156. doi:10.1016/j.contraception.2014.09.014

21. Brückner H, Martin A, Bearman PS. Ambivalence and pregnancy: adolescents’ attitudes, contraceptive use and pregnancy. Perspect Sex Reprod Health. 2005;36(06):248-257. doi:10.1363/3624804

22. Fuller TR, White CP, Chu J, et al. Social determinants and teen pregnancy prevention: exploring the role of nontraditional partnerships. 2019;19(1):23-30. doi:10.1177/1524839916680797.23.   Guzzo KB, Hayford SR, Lang VW. Adolescent fertility attitudes and childbearing in early adulthood. 2019;38(1):125-152. doi: 10.1007/s11113-018-9499-8

Appendix

Interview Guide

CURRENT PREGNANCY

  • How do you feel about this pregnancy?
  • Did you expect this pregnancy?
  • What was your reaction when you first found out you were pregnant?
  • Did you and your partner discuss the possibility of you getting pregnant before it happened? 
    • [When you first started having sex? What did you do?  What did you talk about?]
    • [At the time you had sex that led to this pregnancy, were you thinking that you might get pregnant?]
  • What is your partner’s attitude about this pregnancy?
  • What kind of support are you getting from others about the pregnancy? 
    • [Explore: financial, material, emotional, social, moral]
  • In what ways is your life changing with this pregnancy?
  • In your opinion, is this a (planned/unplanned) pregnancy? Why?
    • [What would have to be different in your life to make this an (unplanned/planned) pregnancy?  What does unplanned/planned mean to you?]
  • In your opinion, is this a (wanted/unwanted) pregnancy? Why?
    • [What would have to be different in your life to make this an (unwanted/wanted) pregnancy?  What does wanted/unwanted mean to you?]

GENERAL ATTITUDES

  • In your opinion, what are some reasons women get pregnant when they aren’t planning to?
  • In your opinion, what are some reasons that men get women pregnant when the men aren’t planning to?
  • If a woman has an unexpected pregnancy, do you think she should continue the pregnancy or not? 
  • What role do you think men play in preventing pregnancy? 
  • What role do you think men play in planning pregnancy? 
  • Are there any other comments you would like to make on these issues?

Citation

D Elzinga, LH Gren, CJ Frost, D Hobbins, LM Ord, & JB Stanford. (2022). Exploring the Dimensions of Adolescent Pregnancy Intendedness, Wantedness, and Planning. Utah Women’s Health Reviewdoi: 10.26054/0d-3w3x-1c80.

PDF

View / download

Fertility Treatment in Utah: A Pooled Analysis of 2009–2015 Utah Pregnancy Risk Assessment Monitoring System (PRAMS) Data

Background

Infertility is a common chronic condition affecting 8% to 12% of couples in the United States and worldwide.1-3 Infertility is unique because it is usually experienced by a couple and not an individual. Since the underlying causes of infertility are most commonly (in approximately 50% of cases) due to a combination of male and female factors, it is often necessary to treat both people.1,4

Infertility is defined as the inability of a couple to conceive after having regular sexual relations without using contraception for 12 months or more in a woman younger than 35 years and for at least 6 months in a woman aged 35 or older.5 Primary infertility is defined as the “inability to achieve a spontaneous clinical pregnancy,” whereas secondary infertility is defined as “the inability to achieve a spontaneous clinical pregnancy following a previous spontaneous pregnancy.”6 Infertility rates may be rising due to trends in delaying pregnancy, since advanced reproductive age increases the risk for infertility.7 Women typically experience peak fecundability in their mid-20s, with a gradual but significant decline in fecundability beginning at age 32, followed by a more rapid decrease beginning at age 37.8 Men begin to experience an increased probability of sterility beginning in their late 30s, with rates accelerating after age 40.7  

Infertility treatment in Utah is of particular interest, because the state has a strong pronatalist culture and one of the highest birth rates in the US.9-12 The main objectives of this data snapshot are (1) to provide updated estimates of the prevalence of fertility treatments among women in Utah experiencing a live birth and (2) to assess how treatments for infertility are associated with women’s age and prior live births.12

Methods

To investigate fertility treatment in Utah, we used 2009-2015 data for women aged 20 to 40+ years from the Utah Pregnancy Risk Assessment Monitoring System (PRAMS) via the IBIS-PH interactive query system. PRAMS is an ongoing population-based surveillance system funded and conducted by the Centers for Disease Control and Prevention (CDC) in collaboration with state health departments, which samples mothers who have given birth to a live infant.13 In Utah, PRAMS is maintained by the Utah Department of Health’s Reproductive Health Program. Approximately 200 Utah mothers randomly selected from birth certificate data are sampled every month to participate in UT-PRAMS. UT-PRAMS uses a stratified sampling system based on maternal education and infant weight to capture smaller but higher at-risk populations.14 Weighted response rates for 2009-2015 were between 67% and 81%, above CDC-required minimum response rates.

The outcome of interest was birth to couples that had received fertility treatment, defined as the index birth. Couples without a prior pregnancy who received fertility treatments were classified as experiencing primary infertility; women with 1-4 previous live births who received fertitily treatments were classified as experiencing secondary infertility.6 This was assessed via the question, “Did you take any fertility drugs or receive any medical procedures from a doctor, nurse, or other health care worker to help you get pregnant with your new baby?” The response to this question was binary (yes/no). Age was categorized into 5 groups: 20-24, 25-29, 30-34, 35-39, and 40+ years. Parity was dichotomized into those without a prior live birth (indicator of primary infertility) and those with 1-4 prior live births (indicator of secondary infertility). Mothers with 5 or more live births were excluded from the current study due to very small numbers and relatively larger standard errors. Weighted prevalence and 95% confidence intervals (CI) are reported. IBIS-PH interactive query system for UT-PRAMS data takes into account the weighted stratified sampling per CDC protocol.13

Results

A total of 10,396 women, with a yearly range from 1,367 to 1,666, participated in UT-PRAMS from 2009 to 2015. Most women (83.0%) were younger than 35 years, with 14.0% aged 35-39 and only 3.0% aged 40 and older. The overall proportion of infertility treatment among study participants was 10.6% (95% CI: 9.3, 11.1).

The prevalence of infertility treatment among women with live births is higher among older women (Figure 1). It ranges from less than 5.0% at 20-24 years to over 25.0% at age 40 years or older.

Table 1 illustrates the prevalence of infertility treatment among women in different age groups based on whether they had experienced a previous live birth or not, which may serve as an indicator for secondary or primary infertility, respectively. Rates of infertility treatment increase with age, especially among women who have never experienced a live birth previously and therefore may suffer from primary infertility. For women aged 20-24 years, there is minimal difference between women with a previous live birth compared to women without a previous live birth: 3.7% (95% CI 2.3, 6.1) and 5.2% (95% CI 3.7, 7.2), respectively.

In the 25-29 and the 30-34 year age groups, the percentage of participants without any previous live birth who received infertility treatments was 2.5 times higher than participants with previous live births. In women aged 35-39 years, the percentage of women without a prior live birth who received infertility treatment was about the same as for women aged 30-34 years, but there was a higher percentage of women with probable secondary infertility who received infertility treatment. Finally, for women aged 40 years and older, the prevalence of fertility treatment is 18.9% (95% CI 9.0, 35.3) for women with prior live birth, and 65.6% (95% CI 33.7, 87.7) for women without prior live birth, albeit with wide confidence intervals.

Discussion

This data snapshot of Utah during 2009-2015 revealed that about 10% of women who ultimately had a live birth sought treatment for infertility. Given that the PRAMS database samples only women who successfully experience a live birth, the actual percentage of women who sought treatment for infertility is likely much higher. Although not directly comparable, data from the National Survey for Family Growth (NSFG), conducted during 2002-2015, shows that the percentage of all married women aged 15-44 years who received infertility services was consistently around 12.0%. Additionally, in the NSFG studies, the percentage of women aged 15-44 years with primary infertility who have ever received any infertility service ranged from 6.5% to 7.1%, which was approximately the same proportion of women with secondary infertility.14 In contrast, among Utah women aged 25 years or older, those who had not previously had a live birth were more than twice as likely to receive infertility treatments as compared to those with presumably secondary infertility: 16.4% to 65.6% versus 5.9% to18.9%, respectively.

Although we do not know the proportion of infertility treatment that did not result in live birth, it is well established that with other factors being equal, infertility treatment is more likely to be successful among couples with secondary infertility.15 Further, in the prior UT-PRAMS study mentioned above, seeking early infertility treatment was more common among women with at least one prior live birth.9 Therefore, if there is a bias in our ascertainment of fertility treatment, it would tend to inflate the prevalence of fertility treatment among those with secondary infertility. This strengthens our finding that women with primary infertility were much more likely to seek infertility treatment than women with secondary infertility (9%-15% absolute difference between ages 25–39, and over 45% in women aged 40-44 years). This may reflect the predominant religious culture in Utah that stresses the importance of having children.9 The cultural emphasis might be a relatively stronger motivation for having the first versus subsequent children. This may be similar to some societies where children are highly valued for social, cultural, and economic reasons.16 In such social settings, women experiencing infertility may experience emotional distress.17,18

At the intersection of the 7 domains of health, infertility has a considerable bearing on almost all of them, and especially in the areas of physical, social, and emotional health. There is evidence that the psychological effects of infertility are similar to that of cancer and heart diseases.18 Infertility or subfertility indicate the presence of other underlying physical illnesses in either women (e.g.,ovulatory dysfunction, hormonal abnormalities) or men (e.g., oligospermia, infection).19 Furthermore, infertility itself may be a risk factor for early mortality in both women and men.20-21

Since infertility is a relatively common chronic condition that can significantly impact a person’s health and well-being, efforts for prevention and early identification are important. It may be beneficial for individuals to develop a greater awareness of their reproductive capacity, including how to determine whether they may be fertile or not. Women can learn to chart external signs or biomarkers that reflect internal hormonal changes that result in ovulation, which is essential for female fertility.22 By using fertility awareness-based methods (FABMs), women can also monitor their health and work with physicians trained in restorative reproductive medical (RRM) approaches to identify and treat potential underlying causes of infertility.23-25 Men may also benefit by learning about the factors that affect their fertility and the steps they can take to improve their reproductive health. Finally, clinicians should counsel patients about their reproductive life plans by discussing patients’ goals. The reproductive life plan encourages women and men to reflect on their reproductive intentions in the context of their personal values and life goals.26

Limitations of our study of infertility treatment in Utah come from the use of the PRAMS database. First, the dataset only includes women who experienced a live birth. Because women without a live birth are not included in the PRAMS database, the actual percentage of Utah women seeking infertility treatment is higher, as fertility treatment does not guarantee live birth. Second, receiving fertility treatment does not necessarily always indicate that infertility was present. Studies with earlier UT-PRAMS datasets (2004-2008) found that 5.0% of women received infertility treatment even though they did not meet the formal definition for infertility, i.e., had been trying to conceive for less than 6-12 months.10 For these 2 reasons, our findings of the prevalence of fertility treatment by age and parity cannot be directly translated into an estimate of the prevalence of primary or secondary infertility. Nevertheless, they do provide important insight into the patterns of the use of infertility treatment in Utah.

Acknowledgements

Pregnancy Risk Assessment Monitoring System (PRAMS) retrieved on March 11, 2021, from Utah Department of Health, Center for Health Data and Informatics, Indicator-Based System for Public Health. Website: http://ibis.health.utah.gov/

References

  1. Vander Borght, M., & Wyns, C. (2018). Fertility and infertility: Definition and epidemiology. Clinical biochemistry62, 2–10. https://doi.org/10.1016/j.clinbiochem.2018.03.012
  2. https://www.cdc.gov/nchs/fastats/infertility.htm
  3. Chandra, A., Copen, C. E., & Stephen, E. H. (2013). Infertility and impaired fecundity in the United States, 1982-2010: data from the National Survey of Family Growth. National health statistics reports, (67), 1–19.
  4. Chu, K. Y., Patel, P., & Ramasamy, R. (2019). Consideration of gender differences in infertility evaluation. Current opinion in urology29(3), 267–271. https://doi.org/10.1097/MOU.0000000000000590
  5. Practice Committee of the American Society for Reproductive Medicine. Electronic address: asrm@asrm.org (2020). Definitions of infertility and recurrent pregnancy loss: a committee opinion. Fertility and sterility113(3), 533–535. https://doi.org/10.1016/j.fertnstert.2019.11.025
  6. Ghaffari, F., & Arabipoor, A. (2018). The role of conception type in the definition of primary and secondary infertility. International journal of reproductive biomedicine16(5), 355–356.
  7. Kessler LM, Craig BM, Plosker SM, Reed DR, Quinn GP. Infertility evaluation and treatment among women in the United States. Fertil Steril. 2013;100(4):1025-1032. doi:10.1016/j.fertnstert.2013.05.040 https://www.ncbi.nlm.nih.gov/pmc/articles/PMC3814221/pdf/nihms506522.pdf
  8. Wilcox A. Fertility and Pregnancy: An Epidemiologic Perspective. Oxford University Press, USA, 2010.
  9. Stanford JB, Smith KR. Marital fertility and income: moderating effects of the Church of Jesus Christ of Latter-day Saints religion in Utah. J Biosoc Sci 2013;45:239-48.
  10. Sanders J, Simonsen S, Porucznik CA, Baksh L, Stanford JB. Use of fertility treatments in relation to the duration of pregnancy attempt among women who were trying to become pregnant and experienced a live birth. Matern Child Health J. 2014;18(1):258-267. doi:10.1007/s10995-013-1262-5
  11. Stanford JB, Sanders JN, Simonsen SE, Hammoud A, Gibson M, Smith KR. Methods for a Retrospective Population-based and Clinic-based Subfertility Cohort Study: the Fertility Experiences Study. Paediatr Perinat Epidemiol 2016;30:397-407.
  12. Stanford J, Simonsen S. Infertility in Utah, 2004-5. Utah’s Health An Annual Review 2007;12 Suppl.:153-7.
  13. Shulman HB, D’Angelo DV, Harrison L, Smith RA, Warner L. The Pregnancy Risk Assessment Monitoring System (PRAMS): Overview of Design and Methodology. Am J Public Health. 2018 Oct;108(10):1305-1313. doi: 10.2105/AJPH.2018.304563. Epub 2018 Aug 23. PMID: 30138070; PMCID: PMC6137777.
  14. Schliep KC, Denhalter D, Gren LH, Panushka KA, Singh TP, Varner MW. Factors in the Hospital Experience Associated with Postpartum Breastfeeding Success. Breastfeed Med. 2019 Jun;14(5):334-341. doi: 10.1089/bfm.2018.0039. Epub 2019 Apr 3. PMID: 30942606; PMCID: PMC7648434.
  15. Centers for Disease Control and Prevention, (2019): National Survey of Family Growth-Key Statistics. https://www.cdc.gov/nchs/nsfg/key_statistics/i.htm#impaired Assessed March 21, 2021.
  16. Evers JL. Female subfertility. Lancet 2002;360:151-9.
  17. Choy, J. T., & Eisenberg, M. L. (2018). Male infertility as a window to health. Fertility and sterility110(5), 810–814. https://doi.org/10.1016/j.fertnstert.2018.08.015
  18. Hasanpoor-Azghdy SB, Simbar M, Vedadhir A. The Social Consequences of Infertility among Iranian Women: A Qualitative Study. Int J Fertil Steril. 2015 Jan-Mar;8(4):409-20. doi: 10.22074/ijfs.2015.4181. Epub 2015 Feb 7. PMID: 25780523; PMCID: PMC4355928
  19. Fidler, A.T, and Bernstein, J. (1999): Infertility: From a Personal Public Health
  20. Centers for Disease Control and Prevention, (2019): National Survey of Family Growth-Key Statistics. https://www.cdc.gov/nchs/nsfg/key_statistics/i_2015-2017.htm#infertility Assessed March 15, 2021.
  21. Lindsay, T. J., & Vitrikas, K. R. (2015). Evaluation and treatment of infertility. American family physician91(5), 308–314.
  22. Senapati S. (2018). Infertility: a marker of future health risk in women?. Fertility and sterility110(5), 783–789. https://doi.org/10.1016/j.fertnstert.2018.08.058
  23. Manhart MD, Duane M, Lind A, Sinai I, Golden-Tevald J. Fertility awareness-based methods of family planning: a review of effectiveness for avoiding pregnancy using SORT. Osteopathic Fam Physician. 2013;5(1):2-8.
  24. Stanford JB, Parnell TA, Boyle PC. Outcomes from treatment of infertility with natural procreative technology in an Irish general practice. J Am Board Fam Med 21(5):375-84, 2008;
  25. Tham E, Schliep K, Stanford J. Natural procreative technology for infertility and recurrent miscarriage: outcomes in a Canadian family practice. Can Fam Physician 58:e267-74, 2012.
  26. Boyle PC, de Groot T, Andralojc KM, Parnell TA. Healthy Singleton Pregnancies From Restorative Reproductive Medicine (RRM) After Failed IVF. Front Med (Lausanne). 2018;5:210. Published 2018 Jul 31. doi:10.3389/fmed.2018.00210
  27. Files JA, Frey KA, David PS, Hunt KS, Noble BN, Mayer AP. Developing a reproductive life plan. J Midwifery Womens Health. 2011;56(5):468-474. doi:10.1111/j.1542-2011.2011.00048.x

Citation

M Duane, DO Agyemang, S Najmabadi, and JB Stanford. (2022). Fertility treatment in Utah: a pooled analysis of 2009–2015 Utah Pregnancy Risk Assessment Monitoring System (PRAMS) data. Utah Women’s Health Review. doi: 10.26054/0d-krxq-yh6z.

PDF

View / download

The Impact of COVID-19 on Utah Women and Work: Health Impacts

Originally published in Utah Women and Leadership Project, September 1, 2021, No 37. Printed by request in the Utah Women’s Health Review.

The COVID-19 pandemic of 2020–21 has affected workers across the globe, and women in the workforce have been disproportionately impacted, including those who live in Utah. The pandemic affected every aspect of life, especially physical and mental health. While the fatality rate has been higher for men, the pandemic impacted women’s mental health at a higher rate with more women being laid off or furloughed in certain industries (e.g., retail, food services, hospitality), experiencing increased workloads in other sectors (e.g., healthcare, education), absorbing greater unpaid caregiving responsibilities from homeschooling and childcare disruptions, and reporting elevated instances of domestic violence.1 These impacts have led to increased post-traumatic stress disorder, anxiety, and depression among women.2

To better understand these experiences, Utah Women & Leadership Project (UWLP) researchers conducted an extensive, in-depth survey to understand the impact of COVID-19 on Utah women and work. The survey opened for data collection in January 2021 to all Utah women aged 20 and older who were either currently employed or who were unemployed due to the pandemic. The objective was to understand more clearly the experiences of Utah women as they navigated paid work during the pandemic. This comprehensive study collected data on a wide variety of topic areas and included both quantitative and open-ended questions to capture respondents’ perceptions and experiences. This brief is the final in a six-part series on the impact of COVID-19 on Utah women and work.3 In this brief, we focus on qualitative findings regarding the most oft-mentioned impact of the pandemic: mental and physical health.

Study Background & Overview

An online survey instrument was administered to a non-probability sample of Utah women representing different settings, backgrounds, and situations (i.e., age, education, race/ethnicity, marital status, socioeconomic status, county/region, job type, sector/industry, hours worked per week, employment status, and workplace situation). A call for respondents was announced through the UWLP monthly newsletter, social media platforms, and website. In addition, the research team members worked closely with nonprofit organizations, chambers of commerce, government agencies, municipalities and counties, women’s networks and associations, multicultural groups, businesses, universities, churches, and volunteers who assisted in disseminating the survey to their employees and contacts. Additionally, targeted recruitment efforts were made to include women of all demographics throughout the state, including providing the survey in both English and Spanish (see design information in previous briefs).

Overall, 3,542 Utah women completed the survey, with 2,744 responding to at least one of the four open-ended questions. The demographics and limitations for survey respondents who responded to qualitative items are summarized in Table 1 in a previous brief titled “No. 32: The Impact of COVID-19 on Utah Women and Work: Career Advancement Challenges.” Of all qualitative respondents, 30% mentioned a mental health toll and/or felt additional stress during the pandemic. This was by far the most oft-cited sentiment mentioned in open-ended comments; it was repeated in every one of the four open-ended questions. Of the 2,530 respondents who responded to the open-ended question, “What benefits, if any, have you experienced (or anticipate experiencing) in your job/career because of the COVID-19 pandemic?” 9% mention mental and physical health benefits of the pandemic, mostly due to the time saved working from home that could be spent on more valued activities. On the flip side, of the 2,713 respondents who responded to the open-ended question, “How has the pandemic affected your work experience?” 4% specifically mentioned a toll on their physical health. All responses were coded and analyzed for major themes and subthemes. Select comments are included in the narratives below that exemplify responses within the following four categories: Cause of Mental Health Toll, Effects of Mental Health Toll, Physical Health Toll, and Mental and Physical Health Benefits.

Causes of Mental Health Toll

Surprisingly, no clear trends emerged in the analysis of qualitative responses that mentioned a mental health toll by demographics such as age, education level, race or ethnicity, marital status, industry, or career stage. While the lack of obvious trends can also be attributed to sample limitations, the qualitative data indicate declined mental health despite demographic and workforce differences.

Additionally, worsening mental health did not discriminate by situations or experiences. The mental health toll of the pandemic emerged in a wide variety of circumstances and situations. For example, those working from home felt a mental health toll, as did those going into the office. Also, the factor of children in the home made a difference: respondents caring for children felt burned out and overwhelmed, while those without children felt isolated and lonely. This section documents respondents’ perspectives of their worsening mental health. Specifically, five primary causes emerged regarding the impacts of the pandemic on mental health: experiencing work pressure, contracting and spreading COVID-19, having children at home, coping with financial instability, and working essential jobs.

1. Work Pressure:  Of those who described a mental health decline (N=855), 29.9% cited work-related pressure as the cause. In some cases, respondents working from home felt they had to work more hours and press themselves to prove they were still as productive as they had been when they worked in the office. According to one respondent, “I feel kind of forgotten by my work, especially since I’m actually working much more now, and I don’t feel it’s appreciated. I have been very stressed that I’ll get in trouble for being less productive, and I can’t afford to get fired or anything because my spouse is in a hospitality industry that is struggling to stay afloat. I’ve just been really stressed.” Another respondent felt the same: “I think the major difficulty for me, as someone with no kids and is employed, has been the pressure to turn things around at unrealistic rates to show that you are in fact working from home and the mental health/burnout that is causing.”

Furloughs of colleagues or additional COVID-19 requirements meant more work responsibility was put on respondents, often without extra pay. For example, one woman stated, “I worked at a busy restaurant as a bartender. The day after the shutdown I was the only ‘To Go’ employee. None of us had been trained on it so there was a lot of stress. Ultimately it was also a significant loss of income as people tend to tip less compared to dining experiences. I was making approximately 1/3 of my previous income but working more hours.” Another respondent said, “I am more concerned about my job performance. My mental health is at an all-time low. I worry about everything (family, finances, household responsibilities, ability to eat, etc.) except work, but not being worried about work has me in a continuous cycle of anxiety and worry.” Lastly, a teacher explained, “Due to pressure placed on me from my job, I have seen a significant decline in my mental and physical health. With the added expectations, I am getting burned out, working longer hours, and feeling anxiety and depression creep into my everyday life. As a teacher, I am working every day in person to meet students’ needs but am also being expected to have an online course for students as well. This only adds stress and anxiety to my already overwhelming feelings.”

2. Contracting and Spreading COVID-19: Almost a quarter (22%) of respondents were worried about contracting and spreading COVID-19, especially those who were not able to work from home and had coworkers who were not as cautious. One respondent stated, “Work is more mentally and emotionally draining. I feel like I have to constantly defend my choice to always wear a mask, be cautious, and keep safe social distance between coworkers when that’s what we have been told to do.” A second Utah women explained, “Because I have two high-risk family members at home and I am expected to work in close contact with people at work, I am quite worried about contracting the virus and passing it on to my loved ones. I would hate to be the one who ‘killed’ my spouse and daughter. This has caused a lot of stress and anxiety for me.” Another respondent said, “My husband’s work has affected my mental health greatly. I had to go on more antidepressants and couldn’t cope with the kids and stress because we couldn’t go anywhere or see anyone. The worst part is feeling alone in taking it seriously in Utah, which reduced the places we could go even more because we couldn’t trust others to wear masks or distance or anything.” And a final respondent explained, “Depression increased due to lack of human interaction, but anxiety increased when going into the office as people didn’t always take social distancing and masks seriously.”

3. Children at Home: Some respondents who had children at home (12.6%) often felt the work pressures mentioned above in addition to added home responsibilities as they navigated homeschooling and COVID-19 precautions. This mother explained, “It’s been so much harder. I’ve had to watch my three-year-old kid from home while I work, and I have a job that I’m in meetings most of the day. I work in a male-dominated industry, so I feel they don’t understand when they hear the craziness in the background. My work-life balance has disintegrated since working from home, and I’m on call now for projects 24-7. My emotional wellbeing has taken a huge hit as we dealt with my husband’s furlough, postponement of school for my daughter, and my burnout. It’s been rough.” Another mother stated, “The childcare and household responsibilities fell disproportionately on me, while my partner basically went ‘back to business as usual’ and I was left in the dust trying to balance full-time work and full-time childcare. My mental and physical health took a steep decline. Fortunately, my work has been flexible enough to allow this, but the burnout is very real, and I feel like I am paying a higher price than my partner in this pandemic.” And this working mother shared her experience: “I have a child with profound special needs and trying to homeschool her was extremely difficult. She almost ended up losing her ability to walk, regressed on all her goals like communication and toileting, got super depressed, and more. My husband was never sent home from his workplace during COVID, so he went to work every day, and the responsibility of the house and homeschooling fell on me as I was trying to work from home. It felt like I could never get a full day of work in unless I worked late at night. Even now it’s midnight and I am taking this survey because I didn’t have uninterrupted time today to do it.”

4. Financial Instability: Some respondents (11.6%) felt increased financial strain and pressure to secure financial stability as they were not able to secure the same hours as before the pandemic, experienced a furlough, lost business, or saw their spouse lose their employment. This business owner explained, “I’m saddened and extremely worried about the next month, and the next. I’m getting very little sleep because of worry and working long hours trying to do so much of it myself. We’re exhausted and scared we will be shut down again. Our small business won’t survive another shutdown.” Another respondent described her particular situation, “As a single woman, I have not experienced some of the stresses many women have in balancing home schooling or a partner working from home at the same time. That being said, I am the primary support system for my elderly parents and have had to shoulder some of the financial burden because my mother was furloughed from her job. This additional support I must give them has put me in a constantly stressful situation regarding finances.”

5. Essential Workers: A mental health toll was also reported by those on the front lines of the pandemic (essential workers), such as healthcare workers, educators, and grocery store workers, to name a few (6.4%). One healthcare worker stated, “I’ve got quite a few patients with risk factors. It’s stressful thinking that if I unknowingly passed COVID along to them, someone could potentially die from it. So, my personal life has changed dramatically. I basically only interact in person with my husband and daughter. Sometimes, I feel quite isolated. Throughout the course of my workday, although I’m taking precautions, I feel vulnerable to becoming infected. It’s stressful. Every patient comes in with an increased level of stress and anxiety due to the pandemic, so I’m interacting with stressed, anxious people all day.”

A teacher also explained, “My administration seems to think the precautions are ‘over the top’ when they are actually barely meeting the minimum. We’re scared, overwhelmed, and feeling totally burned out. We have to keep track of virtual, in-person, and quarantined students. It feels like we’re doing multiple jobs at once. This is my 8th year of teaching and the first year that I hate my job. We are constantly bullied by the public to ‘do our job or shut up.’ Our fears are laughed at. I feel totally invalidated and undervalued.” Another teacher agreed, “The social out lash against teachers and the disregard for our family’s wellbeing makes me depressed. I wish our state was handling this better, and I wish that we were being compensated for all the additional responsibilities. I have never felt more expendable, disrespected, and have never considered leaving my job more.”

And this respondent said, “I’m in frontline retail grocery sales, and this year has been so stressful and exhausting. I’m grateful to have job security, but my mental and emotional health has suffered greatly during the last year. I’m a single parent trying to juggle enormous pressure at work to maintain sales numbers and take care of my family and home responsibilities. I’m working 60, sometimes more hours a week, worrying about getting sick, and they just keep pushing us for more.”

Effects of Mental Health Toll

The effects of mental health decline were often described by study participants as actual diagnoses, including stress, general mental health decline, anxiety, guilt and failure, burnout, fatigue, depression, and loneliness. Respondents also described indirect effects such as their work suffering, the inability to focus or be productive, feeling overwhelmed, and feeling like a failure in all areas of their lives. Five effects of the mental health impacts of the pandemic emerged as primary themes: stress, unspecified mental health toll, anxiety, burnout or fatigue, and isolation or loneliness.

1. Stress: Of respondents who felt a mental health toll from the pandemic (N=855), 51.1% specifically mentioned increased stress. One respondent remarked, “I’m a childcare provider, and I feel like I’m putting my life and other peoples’ lives at risk daily. We are constantly bleaching things and trying to avoid being coughed on just in case. Children have been brought into our facility while infected with COVID-19. Things are very tough and stressful every day.” Another explained, “I am more tired now than I have ever been because of the mental and physical stress of wondering if this could be the day I catch COVID-19 and die.” Another study participant stated, “I feel stress about the safety of the work environment, the change in workload and requirements, and an increase in amount of work that needs to be done at home.” And a final woman said, “I am stressed every time I go to work because nobody is wearing masks, sanitizing, and washing, and nobody within the company enforces it.”

2. Unspecified Mental Health Toll: Another 20.8% mentioned a general negative impact to their mental health without a specific classification. One respondent stated, “I feel like I’ve been exposed to a trauma repeatedly over the last 10 months, and my typical coping mechanisms are drastically reduced. I’m the type of person who really needs something out on the horizon to look forward to in order to keep my mental health in a good place. With those things ripped away and no timeline for knowing when they will come back, keeping a positive outlook or good mental health has been a huge struggle.” And one mother remarked, “I have worked harder than ever before. I am the primary breadwinner for the family and, while my job was never at risk, I felt driven to perform to ensure it remained stable. The tone while my children were at home was really awful. I was unable to balance the demands of an executive role with the demand of schooling my children (8 and 15 years old). That experience alone will require counseling for all of us.”

3. Anxiety: For 17.5% of respondents, the pandemic caused increased anxiety. One respondent said, “I have a very stressful job and now I’m stressed out about the pandemic and the world in general. I’m not sleeping well. I have constant anxiety. It’s nearly impossible to focus at times. I’m certainly not as productive as before, and that causes additional stress. I’ve started looking for a different job; something with fewer deadlines and less stress.” Another respondent explained, “I have had difficulties concentrating because of generalized anxiety due to the changing nature of my work and the fact that I know people that are ill and could be dying.” Another respondent noted, “The impact of the pandemic on working parents cannot be understated. We have faced responsibility for teaching and caring for our children 24/7, all while trying to work full-time in a new and unfamiliar environment of 100% telework. Those of us in the ‘sandwich generation’ also had to take on responsibility for our parents during this time, including things like grocery shopping and mental health support. Many of us also had the misfortune of having children and/or parents test positive for COVID or have to spend time in quarantine due to exposure. The level of worry and anxiety impacted every aspect of life.”

4. Burnout and Fatigue: Burnout and fatigue were felt by 14.9% of respondents who reported a mental health toll. As covered in this and previous briefs, additional responsibility at work and at home took its toll on Utah women. One respondent explained, “Every female faculty member on this campus whom I’ve spoken to in the last 10 months is burned out. We are literally on fire with burnout. Most of the advice we get is to ‘just do what the male faculty members are doing because look how much they are getting accomplished during COVID!’ There is no relief to the pressure. I can’t do more, be more, earn more . . . there isn’t anything left! The free mental health services are not available until June 2021.” One healthcare worker stated, “I’m working long hours, being on call, planning and preparing for surges, and dealing with demands of projects, timelines, and a reduction in force. This year has been extremely challenging for me. My mental health was the worst it’s been in years. I required medication to help me deal with things. I felt like I was juggling 20 balls in the air and at any time they would all fall. I did not see an end in sight.” Lastly, one woman stated, “I’m tired. I’m sad.”

5. Isolation and Loneliness: Social distancing and remote work had a negative effect on 12.3% of respondents who reported loneliness and feelings of isolation. This respondent explained, “I have to work very long hours all by myself, which is very lonely and depressing. Therefore, my mental health has declined greatly. It is hard to be alone all day and then not be able to gather with friends at home on top of that. Loneliness has been the biggest side effect of COVID-19 for me.” Another participant stated, “In this rural area, there is not a lot to do, and our complete social interaction comes from school and work. I grew up in a bigger city, and it was extremely hard to move to this rural area and then to be sent home in isolation to teach. It was hard mentally.” One woman explained, “I have a really hard time feeling like I’m doing well or progressing. I’m essentially alone for the entire workday and, with the pandemic, I’ve been alone most of the time anyway. If I’m having a really bad mental day, then those conditions make it brutal. I can’t just talk to someone in passing if I’m feeling down; I must make a bigger effort. So, by the time I talk to someone, it’s usually because I’m at a boiling point and can’t handle whatever I’m feeling.” Lastly, one respondent explained, “Having zero onsite and face-to-face time has been difficult for me. I did not realize how much socializing I gained from work, nor how important it was to my happiness, energy, and mental health.”

Physical Health Toll

Only 114 respondents (4% of the sample) mentioned a physical health toll from the COVID-19 pandemic. These physical health declines included both direct effects such as contracting the virus and indirect effects like less movement and exercise and physical problems that manifested from the stress of their experience. Three themes emerged regarding the physical health impact of the pandemic: unspecified toll, COVID-19 sufferers, and indirect impacts.

1. Unspecified Toll: Of the 114 women who reported a physical health toll, 33.3% did not offer specifics but mentioned a general toll (often alongside a mental toll). For example, one respondent shared, “I feel my mental health, physical health, and motivation has greatly decreased.” Another respondent said, “The impact of a spouse losing their job is catastrophic. The loss has a major impact on me financially, physically, emotionally, socially.”

2. COVID-19 Sufferers: Direct physical health impacts were felt by 23.7% of those who reported a physical health toll. These largely included those who contracted the virus and any ongoing effects stemming from the illness. A respondent in healthcare explained, “I got very ill with extreme fatigue and heart problems, which nobody seems to have any help for.” A teacher weighed in with her experience, “One of the most frustrating things about this was I did get COVID. My quarantine time was difficult because I still had to keep my classes going with online work even though I felt horrible. I remember answering real-time questions for students while taking vomit breaks.” One childcare provider stated, “As of today, I shut down my family childcare program due to testing positive for COVID-19 yesterday. I am extremely worried that parents, who put trust in me, will enroll their children somewhere else. I am also very worried about the health of the children that were under my care and got exposed to COVID-19 through me.” A final respondent commented, “I was unable to work for 6 weeks due to having COVID and being a long-hauler. The headaches, brain fog, and complete exhaustion prevented me from doing anything.  I’m 10 weeks out and still have exhaustion. I can’t run or walk for extended periods of time.”

3. Indirect Impacts: Another 19.3% reported indirect physical health impacts stemming from their pandemic experience, such as those caused from stress or working from home. For instance, one respondent stated, “The expectation to just step up and do more work for less pay, even though others were furloughed or laid off, has been demoralizing and has led to stomach ulcers, bad sleep, burnout, and likely a job change.” Another woman explained, “The amount of stress outside of work (politics, increased stress and difficulty in safe grocery shopping, scarcity, etc.) has also impacted my stress tolerance levels, which contributed to the burnout brought on by work. I have developed major stress-related digestive problems as well as muscular injuries since the start of the pandemic.” One respondent said, “At work, I had a nice desk, keyboard tray, and a chair that prevented me from developing issues with my right arm, shoulder, and my right leg. Since working from home, these have come back and have been significant.” Finally, one respondent stated, “Health-wise it has been a struggle because I have migraines. Moving into the virtual world means more time staring at a computer screen and more migraines.”

Some 13% of these respondents described less movement and activity due to working from home. For example, one respondent explained, “I have put on some weight and believe it is mostly due to not needing to move as much.  Everything is electronic and right at my fingertips, so I don’t walk to the print room or file room or to meetings. Our 30 min/3 day a week exercise time at work was taken away because of the pandemic. For some strange reason, we have no exercise program available with telework, and I probably need it more now than ever before.”

Mental and Physical Health Benefits

Of the 2,530 respondents who responded to the open-ended question, “What benefits, if any, have you experienced (or anticipate experiencing) in your job/career because of the COVID-19 pandemic?” 43.5% mentioned the ability to work from home and/or more flexibility in their schedules. A large proportion of those respondents said the increased flexibility and remote work improved their physical and/or mental health. Of the 9% (N=218) of respondents who mentioned mental and physical benefits of the pandemic, 56.9% attributed the benefits to working from home and flexibility.

Respondents felt they were better able to focus and could be more productive working from home. They appreciated the time saved from having no commute, which helped them better fit in time for valued activities, relationships, and exercise. For example, one respondent stated, “I work 100% from home now. I love it! My mental and physical health is better. Less stress, better eating habits, calmer. I’m saving money by not driving and buying clothes for work. My overall quality of life has improved dramatically. I have more quality time with loved ones. I can’t say enough about the positive impact on my life personally.” Summarizing the feelings of many respondents, one woman said, “The freedom of working from home has been huge. I didn’t realize how much stress was involved in physically being at the office. I feel I’ve been better able to care for myself and my household by physically being in my home more often.” Two related themes emerged from the participants’ responses: mental health benefits and physical health benefits.  

1. Mental Health Benefits: Respondents felt that the ability to work from home, and the flexibility it afforded, helped improve their overall mental health. Reduced stress levels and anxiety, more quality time spent with family and pets, and improved work-life balance were specifically mentioned by respondents as benefits. One respondent explained, “I feel less stress and anxiety induced by in-office work, workplace drama, and commuting.” Another stated, “It’s helped me work more efficiently and produce better work. Since I’m working from home, I’m fighting less anxiety, which allows me to be a better worker.”

One mother in our study said, “This has been a great opportunity to open the line of communication with our kids about mental health, taking care of both our mental and physical health, and taking care of family relationships.” Another mother stated, “The increased flexibility has been amazing! I feel much more able to take care of my children’s needs and much less stressed about their daily schedules.”

Notably, 10.1% of respondents who felt a mental or physical health benefit described their employers’ increased focus and prioritization of employees’ physical and mental health. One participant explained that there was “more understanding of mental health needs” from her employer, and a deeper “understanding of balancing work/family life.” Another respondent shared, “My workplace has emphasized personal care and taking time for the things that help me recover, process, and feel happy as priorities.” Finally, one woman explained that employers had “really stepped up emotional and mental support,” while others made sure that their employees had access to the needed resources to improve their mental health.

2. Physical Health Benefits: In addition to the flexibility of working from home, many Utah women listed “no commute to and from work” as another major benefit. They explained that they were able to spend more time sleeping and exercising, preparing healthier meals, and practicing

  1. better overall self-care. For example, one respondent felt that the simplified lifestyle “increased time for exercise and self-improvement.” While working from home, one woman shared, “I can read and respond to emails on my home treadmill and not worry that I won’t be changed and presentable again precisely within a one-hour allotted lunch break. The pandemic has improved my work life.” Another shared, “I’ve been eating healthier since moving home because I’m able to cook things on my lunch break instead of having to go get something from a fast-food place.” A final participant explained, “It has allowed me to work from home, which, in turn, allowed me to get more sleep. It was a whole domino effect from there. I was able to get more sleep, which helped me eat better, which gave me more energy, which led to exercising more, which led to an overall healthier me.”

Some respondents referenced cleaner work environments as a benefit of changes due to the pandemic. One respondent shared that she hoped that her employer would “continue to clean/sanitize” and have employees stay home if they were feeling sick. Another listed “increased sanitization and cleanliness in my workspace and jobsite overall,” as a benefit. For respondents who worked in industries that received early access to the vaccine, several mentioned receiving the vaccine as a major physical health benefit.

Conclusions and Recommendations

This research brief sheds light on the health effects of COVID-19 on working women. Because of the health risks of COVID-19 and the safety precautions implemented to decrease risk, women either lost their job, were sent home to work, or risked their health by interacting with coworkers and/or the public. For those who experienced remote work, some enjoyed the extra time for family, activities, and exercise. More often, however, women felt mental declines from either the additional responsibility of both working at home and taking care of their family or feeling isolated and lonely. Utah women working with the public felt anxiety about

contracting and spreading the virus and, in some cases, felt a lack of support from the community regarding health risks. While some experienced decreased physical health from contracting the virus, others faced physical problems that manifested from the stress of their experience.

There are important actions that can support the mental and physical health of Utah women in the workforce. First, all women, especially women of color and those with low household income levels, need better access to mental health care to heal and thrive. Employers can ensure adequate mental health coverage in insurance options and foster an atmosphere that acknowledges and supports mentally healthy activities and lives. Legislators can support mental health coverage amendments, mental health days for students and employees, and overdose and suicide prevention programs.

Second, flexible and remote work options benefit many women and families, evidenced by those who said it led to a healthier work/life balance, increased productivity, and provided more time for relationships, preferred activities, and exercise. Employers can continue to offer a work-from-home option for applicable positions or, if the position requires an office presence, allow for flexibility in work hours. Research has shown that empathetic and supportive policies attract and retain employees, along with increasing employees’ psychological safety, organizational commitment, and productivity.4 Utah state and local governments can implement policies that support Utah women in terms of childcare, flexible work arrangements, and family leave policies.

The pandemic has impacted nearly every aspect of Utah women’s lives, which, for most, includes their physical and mental health. Ensuring that women can thrive mentally and physically is important moving forward. As Utah leaders and residents better understand the challenges that Utah women have faced related to COVID-19, a more equitable recovery can be crafted. This will, in turn, strengthen our businesses, families, communities, and the state as a whole.

Acknowledgements: This brief was made possible through the generous support of the Beesley Family Foundation, Rich and LeAnn Crandall, and Utah State University Extension. We would also like to thank those who were involved in the extensive coding analysis for this project: D. Candice Pierucci, Erin Jemison, Nkoyo Iyamba, Allie Barnes, Kaitlyn Pieper, and Shannyn Walters.

References

1. Laughlin, L., & Wisniewski, M. (2021, March 23). Women represent majority of workers in several essential occupations. U.S. Census Bureau. https://www.census.gov/library/stories/2021/03/unequally-essential-women-and-gender-pay-gap-during-covid-19.html; see also other briefs in this six-part series.

2. Van Ness, M. (2021, April 1). COVID-19 and women’s mental health: The impact on wellbeing, disparities, and future implications. Baylor University. https://www.baylor.edu/communityconnection/news.php?action=story&story=222809

3. The other five briefs in this series included: 1) The Impact of COVID-19 on Utah Women and Work: Changes, Burnout, & Hope, 2) The Impact of COVID-19 on Utah Women and Work: Career Advancement Challenges, 3) The Impact of COVID-19 on Utah Women and Work: Childcare and Homeschooling, 4) The Impact of COVID-19 on Utah Women and Work: Caregiver Experiences, and 5) The Impact of COVID-19 on Utah Women and Work: Resilient Mindset & Wellbeing.

4. Morgan, L. (2010). The impact of work-life balance and family-friendly human resource policies on employees’ job satisfaction. Social Science Premium Collection. https://nsuworks.nova.edu/hsbe_etd/78/; Scribner, R. T., Vargas, M., & Madsen, S. R. (2020, December 2). Flexible and family-friendly policies at Utah’s “Best Places to Work.” Utah Women & Leadership Project. https://www.usu.edu/uwlp/files/briefs/27-flexible-family-friendly-policies-utah-best-places-to-work.pdf

Citation

Christensen M, Madsen SR, Dyckman J, and McAdams-Jones D. (2022). The Impact of COVID-19 on Utah Women and Work: Health Impacts. Utah Women’s Health Review. doi: 10.26054/0d-pcbx-px3w.

PDF

View / download

Sexual and Reproductive Health Education for Adolescents with Cystic Fibrosis

Abstract

Objective: To assess the SRH needs of adolescents with CF and create a SRH education guideline for CF providers.

Methods: Adolescents and young adults (AYA) were asked to complete a questionnaire about SRH educational needs. If the AYA was under the age of 18 years, their parent was also asked to participate. Survey data were analyzed using descriptive statistics, the Mann Whitney U test, and content analysis of the qualitative data. An evidence-based SRH education guideline was developed and presented to key stakeholders. CF clinic staff were asked to complete a pre- and a post-intervention survey to assess their perspectives of the guideline and report perceived barriers to SRH education. Surveys were created using recommendations from previous SRH education research and CF content experts.

Results: 29 AYA and 17 parents completed the survey. 13 CF staff completed the pre-intervention survey and 8 completed the post-intervention survey. Of the AYA surveyed, 18 (62.1%) were female and 11 (37.9%) were male. 31% (9/29) of AYA reported they had talked with a CF provider about SRH. 47.2% (8/17) of parents reported their child had talked about SRH with a CF provider. Almost all participants reported they want CF-related reproduction included in SRH education. Although not statistically significant, CF clinic staff who reported that they currently include or would include SRH education in their practice increased from 50% to 87.5%.

Conclusions: The findings confirm the significant need for improved SRH education for adolescents with CF and the need for standardization in care. Adolescents in this CF center want SRH education from their CF care team. The lack of statistically significant differences in the results of CF staff could be related to sample size or resistance to practice change.

Implications: Future action is needed to address barriers to SRH education and implement an SRH education guideline.

Introduction

Problem Description

Adolescents and young adults (AYA) with cystic fibrosis (CF) encounter similar sexual and reproductive challenges as their healthy counterparts. They also have disease-specific sexual and reproductive health (SRH) concerns.1 42% of adolescent girls with CF report being sexually active.1 Survival rates and overall health are improving for CF, with more individuals living into adulthood.1-4 This creates a greater need for SRH information for AYA with CF.

Available Knowledge

There are no guidelines for SRH education for AYA with CF.5 The Cystic Fibrosis Foundation has information regarding SRH for individuals with CF, but there are no guidelines for providers.6 Studies have looked at patient preferences for SRH education.5, 7, 8

Rationale

The ACE Star Model of Knowledge Transformation was used to conceptualize the implementation. This is a model for knowledge transfer and application in healthcare quality improvement.9 It includes discovery research, evidence summary, translation to guideline, practice integration, and evaluation (Figure 1).10

Figure 1: The ACE Star Model of Knowledge Transformation

Specific Aims

The purpose of this project was to assess the SRH educational needs of AYA with CF by surveying these individuals, their parents, and the CF care team, and to create an evidence-based SRH education guideline, present it to key stakeholders, and evaluate the CF care team’s assessment of the guideline.

Methods

Context

This project was completed at a Cystic Fibrosis Foundation-accredited CF center associated with an academic medical center in the Intermountain West serving five states. The center has an adult and a pediatric clinic; both clinics were involved with this project. The pediatric and adult teams consist of physicians, nurse practitioners, physician assistants, pharmacists, social workers, dietitians, respiratory therapists, registered nurses, and other health team members. Most patients seen in the CF center are White. For this project, only patients aged 14 to 24 years were included. For patients under the age of 18 years, their parents were also asked to participate. 

Intervention

Surveys were created to assess AYA and parent needs related to SRH education. A survey for CF clinic staff was also created to assess SRH education needs, barriers, and attitudes. For four months, AYA and parents seen in the CF center were asked to participate by completing a paper questionnaire. Additionally, the parent survey was made available online via a link posted on a regional CF social media page. The CF staff survey was emailed to clinic staff to complete.

Based on the results from the needs assessment, a SRH education guideline for CF providers was developed using evidence-based recommendations related to SRH in pediatric chronic disease. The purpose of the guideline was to help clinicians in educating adolescents with CF. While developing the guideline, stakeholders were asked for their input and recommendations.

A report of the results from the needs assessment and the SRH education guideline were prepared and presented to key stakeholders in the CF center. A survey was created to assess the CF care team’s perspective on the satisfaction, feasibility, and usability of the SRH education guideline as well as their confidence, attitudes, and perceived barriers to using it. Following the presentation, this survey was sent to the CF clinic staff via email.

Study of the Intervention

13 CF clinic staff participated in the pre-intervention survey (pre-survey), and 8 CF staff in the post-intervention survey (post-survey). CF staff were surveyed before and after they were presented with the clinic needs assessment findings and SRH education guideline to compare findings and evaluate the guideline. Pre- and post-surveys were sent via email. This project did not have a comparison group. There were no other quality improvement projects related to SRH education being implemented at the same time in the CF center at this institution.

Measures

The surveys used to measure processes and outcomes were created using recommendations from previous research done in SRH education. The surveys were reviewed and piloted by content experts and CF providers for content appropriateness, face validity, and ease of completion. Surveys included closed, open-ended, and Likert scale questions. The AYA and parent survey included a Likert scale of very satisfied to very dissatisfied to measure participant satisfaction with SRH education they had received and current SRH knowledge. CF staff’s perceived importance of SRH education and topics were measured in the pre-survey using a Likert scale of 1 to 5, with 5 representing very important. Additionally, the CF staff survey included measurements of confidence, comfort, resources, and skills needed to provide SRH education using a Likert scale of strongly agree to strongly disagree. The CF staff post-survey included the same measures and were compared to pre-survey results using the Mann Whitney U test. Pilot data demonstrated that each survey took less than 10 minutes to complete.

The data from paper surveys for AYA and parents were entered electronically into a secure data base for statistical analysis. After entry, the paper survey data was compared carefully to the electronic data to ensure no errors were made. Additionally, the surveys from CF clinic staff that were completed electronically were reviewed for completeness and accuracy.

Analysis

Quantitative survey results were analyzed using descriptive statistics, including frequency distributions and summary statistics for central tendency and variability. The Mann Whitney U test was used to evaluate pre- and post-survey data, as data was non-parametric and unpaired. A content analysis was completed for qualitative survey results by carefully reading and coding responses. The coded data were then categorized, organized, and summarized to identify common themes.

Ethical Considerations

This study was approved by the University of Utah Institutional Review Board. Participation in the study was completely voluntary, and participants could withdraw at any time. Parental permission, consent, and assent were explained on the survey cover letter, and completion of the survey implied consent. No signatures were obtained. Participants were assured that their survey responses were confidential; furthermore, surveys remained anonymous to protect confidentiality. There were no conflicts of interest to disclose.

Results

29 AYA 14 to 24 years of age participated in the survey (Table 1). Most participants reported they had received SRH education regarding CF (89.7%), however, only 19.2% reported receiving this education from a healthcare provider. It was reported as being most frequently received at school, from a parent, or the internet. School and a parent were most frequently reported as the most important source of information on SRH. The majority (57.7%) of AYA reported they were satisfied with the SRH education they had received, but only 31% reported they had talked with a CF provider about SRH. Of those who said they had talked with a CF provider regarding SRH, the majority (66.6%) was either very satisfied or satisfied with the education. Puberty and fertility/pregnancy were the most common topics to have been discussed with a CF provider (Figure 2). 55.2% of participants reported that age 13 to 15 would be their preferred age to start discussing SRH. When asked about preferences regarding from whom they would want to receive SRH education, 38% had no preference, 24% preferred a CF provider, 24% preferred a parent; 48.3% had no gender preference. The majority (65%) of AYA reported that their ideal educational resource would be an online resource. Almost all respondents (96%) reported they would want CF-related reproduction included in SRH education (Figure 3).

Table 1: Demographic Characteristics, Adolescent and Young Adult Survey
Figure 2: SRH Topics Discussed, Adolescent/Young Adult
Figure 3: Preferred SRH Topics, Adolescent/Young Adult

In reviewing open-ended survey questions, the AYA who participated repeatedly stated that they want more information regarding SRH or would have wanted more information as an adolescent (N=16). These responses included statements such as “make it more of a topic during the teenage years,” “talk about it more,” “giving more information,” and “have the discussion early.” Another common theme identified was patient comfort during SRH discussions (N=5). Responses included “make it not sound gross” and “ask them if they feel comfortable talking about it.” Two respondents spoke about privacy, such as “no parents in the room” and “speak about it without parents present.” Family (N=10), health (N=8), and SRH (N=5) were common themes in responses when participants were asked what they value for their future life. Responses included “a healthy one,” “being sexually healthy,” “being healthy enough to have kids,” “family,” and “I want to have safe sex practices, effective contraception and a family eventually.”

17 parents of CF adolescents participated in the parent survey (Table 2). The majority (58.8%) of parents reported that their child had received SRH education regarding CF. Of those who had received SRH education regarding CF, 90% of parents reported it was from a CF provider, and 70% reported it was from a parent. 41.2% of parents reported their child had not talked about SRH with a CF provider, while 47.1% reported their child had. If their child had talked to a CF provider about SRH, 50% of parents were either very satisfied or satisfied with the education. The most discussed topic was puberty, followed by fertility/pregnancy (Figure 4). 41.2% of parents reported they would prefer their child receive SRH education from both the parent and a CF care team member, and 35.3% had no preference. Over 40% of parents felt that before age 13 was the most appropriate age for SRH education, and 35% felt age 13 to 15 was the most appropriate. Most parents reported the ideal educational resource would be a written resource (52.9%). The top three topics that parents want to be included in their child’s SRH education were CF-related reproduction, healthy relationships, and puberty.

Table 2: Demographic Characteristics, Parent Survey
Figure 4: SRH Topics Discussed, Parent

According to open-ended responses in the parent survey, parents consistently reported the desire for the CF care team to understand the needs of the parent and patient (N=8) such as “don’t be nervous about discussing sex and make it a natural discussion when the patient is ready,” “listening and allowing time for them to open up, ask questions…” and “find out how much the parents want this discussed with their child.” One parent felt that standardization would be helpful. They said, “just making it a routine part of the exam and discussing [it] openly from childhood to adulthood.” Other common themes for how to support adolescents with SRH education included resources (N=3) and CF-specific information (N=2). Family (N=6) and knowledge (N=3) were common themes of what parents value for their children’s future. Responses included “that she be comfortable and knowledgeable in her own body…have all information and education to be able to make choices that are right for her” and “that she understands what she needs to happen in order to get pregnant and have a safe and healthy pregnancy.”

The CF staff pre-survey was sent via email to 24 participants and left open for a 7-week time frame. A reminder email was sent after 5 weeks. The response rate was 54% (N=13). The largest number of respondents were pediatric CF providers (38.5%). No adult CF providers responded. Half of the respondents reported that they currently include SRH education in their practice. 84.6% of participants felt that the CF provider or team has a role in the discussion or provision of SRH care for adolescents with CF. The large majority (83.3%) felt that the CF provider should be the one to initiate SRH discussions. Of note, 23% reported that multiple team members should be involved in the discussion of SRH issues. The pre-survey results showed that the CF staff’s perceived importance of SRH care averaged 4.3 (± 0.75) on a scale of 1 to 5, with 5 representing very important. Additionally, results showed that CF staff’s perceived importance of including urinary incontinence, contraception, and fertility in SRH education averaged 4 or greater using the same scale (4 ± 0.8, 4.2 ± 0.9, 4.3 ± 0.8 respectively). There was a wide range of the perceived importance of including puberty, menstruation, and vulvovaginal candidiasis in SRH education with averages of 3.8 (± 1.5), 3.8 (± 1.4), and 4 (± 1.4), respectively, using the same scale. Table 3 shows the results for all SRH topics.

Table 3: CF Staff SRH Topic Importance

According to the open-ended responses from CF staff, standardization of SRH education (N=8) and more information (N=11) were consistently reported as ways to improve confidence and comfort with SRH care. Responses included statements such as “a culture that it is an expected part of adolescent care,” “having aligned goals or standards that all providers and team members in clinic discuss,” “protocols and ownership from all of the CF providers,” and “information, talking points, a standardized way to dismiss family from room.” Identified barriers to providing SRH education included the following common themes: culture (N=4), family concerns (N=7), time (N=2), and provider comfort/confidence (N=7).

The CF staff post-survey was sent via email to 10 participants and left open for 3 weeks. A reminder email was sent after 2 weeks. The response rate was 80% (N=8). The largest number of respondents were pediatric CF providers and pediatric CF nurses. The large majority of respondents reported they plan to include SRH education in their practice (87.5%).

CF staff’s perceived confidence and comfort in providing SRH education averaged 3.75 (± 0.6) and 4 (± 0.6) in the pre-survey and 3.6 (±0.9) and 3.5 (± 1.0) in the post-survey, respectively, on a scale of strongly agree to strongly disagree. The CF care team’s perception of having the resources and skills to provide SRH education averaged 3.25 (± 0.8) and 4 (± 0.6) in the pre-survey and 2.9 (±0.8) and 3.75 (±0.7) in the post-survey, respectively, using the same scale. There was no statistically significant difference in the CF care team’s self-assessment of their confidence and comfort in providing SRH education and their perception of having the needed resources and skills. Additionally, there was no statistical difference found in the perceived importance of SRH education (Table 4). Although not statistically significant, there was an increase in participants who reported they would include SRH education in their practice to 87.5%, compared to the 50% who reported they currently include SRH education in their practice in the pre-survey.

Table 4: CF Staff Pre-Post Frequency Table

Half of the participants in the CF staff post-survey either strongly agreed or agreed with the statements “the proposed SRH guideline is sustainable” and “the proposed SRH guideline is easy to use.” Most participants, 75%, reported they neither agreed nor disagreed with the statement, “I will use the proposed SRH guideline.” Only 37.5% agreed that “the proposed CF SRH guideline can be implemented in the CF clinic.”

In the open-ended responses from CF staff in the post-survey, time (N=5) and resistance from parents (N=3) were consistently reported as barriers and concerns to providing SRH education and using the proposed SRH guideline. Additionally, the importance of SRH education was described by participants (N=4).

The missing data included one incomplete CF staff pre-survey. The survey was completed online, and 1 participant failed to answer all the questions. Since the survey was anonymous, it was not possible to recover the missing data.

Discussion

Summary

The results demonstrate that adolescents with CF and their parents want information about SRH from their CF care team. Adolescents reported that more information about SRH from their CF care team would help them feel better supported in their SRH decisions and concerns. Although members of the CF care team reported the importance of SRH education, only 50% reported that they currently include it in their practice. Prior to this project, the CF center identified a gap in care with no standard SRH education guidelines for CF providers to follow and no data specific to their patients’ SRH needs. Following the presentation of the SRH education guideline, there was no statistically significant difference found in the CF clinic staff’s self-assessment of confidence and comfort in providing SRH education and their access to needed resources and skills. Although not statistically significant, there was an improvement in the percentage of staff that stated they would include SRH education in their practice.

The study was strengthened by the overall number of surveys completed and the fact that multiple groups were surveyed, including AYA, parents, and CF staff. Additionally, there was a wide range of ages surveyed among AYA with CF, from 14 to 24 years.

Interpretation

The results support current literature on SRH education for adolescents with CF. In addition, our study found that more than half of AYAs surveyed reported they had not discussed SRH with a CF provider. Frayman and Sawyer reported that young adults receive the majority of their SRH knowledge from their parents2; we found that 70% of AYAs surveyed received SRH education from their parents. Our study found that the CF care team feels SRH education is important and that they play a role in discussions around SRH, but only 50% of care team members are currently including it as part of the care they provide. Qualitative results from this study found that CF clinic staff lack confidence and comfort to provide SRH education; Kazmerski et al reported comparable findings.11

The impact of the project on people and systems was evident when presenting the proposed SRH education guideline to the CF care team. The guideline was met with resistance: there was general resistance to practice change as well as concerns regarding the difficulties of implementing new activities in a busy specialty clinic, such as lack of time, need for training, and individual comfort level. The proposed SRH education guideline is inexpensive but may be time-intensive to execute. However, based on the results of this study that indicate that adolescents with CF want SRH education, the effort would be worthwhile. 

The lack of statistically significant differences in the CF staff results could be related to several factors. Although there was a robust overall survey response, there was a small CF staff sample size with 13 pre-survey and 8 post-survey participants. Additionally, barriers within the clinic, including resistance to practice change, could have contributed to the lack of statistically significant findings.  

Limitations

There are several limitations to the generalizability of the study. Only 1 parent survey was completed online via social media. Efforts were made to adjust for this limitation by allowing more time to complete the survey and a reminder post. The sample was homogenous, with almost all respondents identifying as White and English speaking, but this is consistent with the ethnic demographics of CF.

The risk of selection bias on results is another identified limitation. More females completed the AYA survey than males (62.1% and 37.9%, respectively). Additionally, there were more parents of daughters with CF than sons with CF (82.4% and 41.2%, respectively). It is possible that females and parents of females were more willing and comfortable to complete the survey and return it. Although CF is not a sex-linked genetic disease, it is also possible that more females were seen in the clinic during the timeframe of the project.

Health Implications

The findings in this project confirm the significant need for improved SRH education for adolescents with cystic fibrosis and the need for standardization in care. This project provided valuable data to the CF center regarding their own patients’ needs and a proposed SRH education guideline based on those needs as well as evidence-based recommendations. The proposed guideline has the potential to improve SRH education for adolescents with CF. The next steps for this project include addressing identified barriers and implementation of the proposed SRH education guideline in this CF center. Given the significant response from adolescent girls and their parents, this may be the first group to target.

Acknowledgements

Thank you to Fadi Asfour, MD, for his input and feedback regarding project development and implementation. Thank you to Sue Meihls, RN, and Jennifer Kinsfather, RN, for their support and assistance in the project implementation.

Funding

No outside funding was utilized in the design or implementation of this project.

References

  1. Kazmerski TM, Sawicki GS, Miller E, et al. Sexual and reproductive health behaviors and experiences reported by young women with cystic fibrosis. J Cyst Fibros. Jan 2018;17(1):57-63. doi:10.1016/j.jcf.2017.07.017

2.  Frayman KB, Sawyer SM. Sexual and reproductive health in cystic fibrosis: a life-course perspective. Lancet Respir Med. Jan 2015;3(1):70-86. doi:10.1016/s2213-2600(14)70231-0

3. Scotet V, L’Hostis C, Férec C. The Changing Epidemiology of Cystic Fibrosis: Incidence, Survival and Impact of the CFTR Gene Discovery. Genes (Basel). May 26 2020;11(6)doi:10.3390/genes11060589

4. Kazmerski TM, Borrero S, Sawicki GS, et al. Provider Attitudes and Practices toward Sexual and Reproductive Health Care for Young Women with Cystic Fibrosis. J Pediatr Adolesc Gynecol. Oct 2017;30(5):546-552. doi:10.1016/j.jpag.2017.01.009

5.  Kazmerski TM, Hill K, Prushinskaya O, et al. Perspectives of adolescent girls with cystic fibrosis and parents on disease-specific sexual and reproductive health education. Pediatr Pulmonol. Aug 2018;53(8):1027-1034. doi:10.1002/ppul.24015

6. Reproductive Health and Fertility. Cystic Fibrosis Foundation. Accessed September 3, 2021. https://www.cff.org/Life-With-CF/Transitions/Reproductive-Health-and-Fertility/

7. Jacobs ZC, Williams RL, Howenstine MS, Aalsma MC, Korn KL. 132. Improving Disease-Specific Sexual and Reproductive Health Knowledge Among Adolescents With Cystic Fibrosis. Journal of Adolescent Health. 2015;56(2):S69. doi:10.1016/j.jadohealth.2014.10.138

8. Kazmerski TM, Miller E, Sawicki GS, et al. Developing Sexual and Reproductive Health Educational Resources for Young Women with Cystic Fibrosis: A Structured Approach to Stakeholder Engagement. Patient. Apr 2019;12(2):267-276. doi:10.1007/s40271-018-0342-4

9. Schaffer MA, Sandau KE, Diedrick L. Evidence-based practice models for organizational change: overview and practical applications. J Adv Nurs. May 2013;69(5):1197-209. doi:10.1111/j.1365-2648.2012.06122.x

10.  Stevens K. Stevens Star Model of Knowledge Transformation. Academic Center for Evidence-Based Practice: The University of Texas Health Science Center at San Antonio. Accessed September 3, 2021. https://nursing.uthscsa.edu/onrs/starmodel/star-model.asp

11. Kazmerski TM, Prushinskaya OV, Hill K, et al. Sexual and Reproductive Health of Young Women With Cystic Fibrosis: A Concept Mapping Study. Acad Pediatr. Apr 2019;19(3):307-314. doi:10.1016/j.acap.2018.08.011

Citation

Taylor CS and Hamilton JL. (2021). Sexual and Reproductive Health Education for Adolescents with Cystic Fibrosis. Utah Women’s Health Review. doi: 10.26054/0d-2vdj-c5d8.

PDF

View / download