Letter from the Editor, Karen Schliep, PhD MSPH, 2021
Women’s Health Review has continued to grow in marvelous ways. We are excited to introduce the 2021 issue, which includes thirteen original manuscripts—seven research articles, three commentaries, and three data snapshots. Additionally, we provide a link to the recorded proceedings from the 2021 “Sex, Gender, and Women’s Health Across the Lifespan Virtual Symposium” and three reprints from the UU Gender-based Violence Consortium and USU Utah Women and Leadership Project. Original contributions to this issue, outlined below, thoughtfully consider at least one of the 7 Domains of Health —physical, reproductive, social, emotional, occupational, financial, environmental, intellectual, and spiritual health—in addition to shedding light on race and gender health disparities.
Research Articles:
Taylor and Hamilton confirm the significant need for improved sexual and reproductive health education for adolescents with cystic fibrosis and the need for standardization in care.
Elzinga et al. report on how pregnant adolescent women relate to the concepts of planning, wanting, and intending pregnancy differently than pregnant adults, highlighting the need for continued development of tools that more accurately define and reflect the complexity of adolescents’ pregnancy experiences.
Kah et al. share their findings of increased postpartum depression among women experiencing prepregnancy/prenatal physical abuse and partner-related stress among a representative Utah population of 142,963 postpartum women. Their research findings are of significant public health importance as we witnessed rising rates of intimate partner violence during the COVID-19 pandemic. (UWHR NIH PubMed Cited Article: PMID: 35706583)
Powell et al. report on the increased risk of gender-based violence among sexual and minority women at the University of Utah, bringing attention to the need for enhanced efforts to address existing services and resource gaps.
Seage et al. report that overall, Utah women having prepregnancy and prenatal depression and anxiety have a 67% higher probability of preterm labor. Interesting, being of Hispanic/Latina ethnicity was found to protect against preterm labor for those with prepregnancy and prenatal depression, possible via increased social support, but more research is needed (UWHR NIH PubMed Cited Article: PMID: 35669386)
Pentecost et al. identify the proportion of perinatal women screening positive for depression only, anxiety only, and co-occurring anxiety/depression. One of their key findings was that approximately 1 in 20 would have been missed among those with a positive anxiety screen based on their total Edinburgh Postnatal Depression Scale (EPDS) score alone. Their findings highlight the importance of considering both the EPDS score and the anxiety sub-scale among perinatal to provide more comprehensive and improved mental health care.
Kelly et al. sought to describe which populations throughout the contiguous US would experience the most dramatic impacts if state-level abortion bans were enacted. Through a sophisticated ecological and spatial analysis, they found that if states enact abortion bans as expected, 46.7% of the country’s women will experience an increased distance to abortion care. (Highlighted in the Utah Chronicle, https://attheu.utah.edu/facultystaff/post-roe-millions-will-travel-farther-for-abortion-care/)
Data Snapshots:
Leveraging the Utah Pregnancy Risk Assessment Monitoring System, Utah Department of Health; https://mihp.utah.gov/pregnancy-and-risk-assessment: Population-based analyses representative of all postpartum Utah women, including high-risk women, due to sophisticated stratified sampling scheme.
Duane et al. used UT-PRAMS data from 2009 to 2015 to (1) provide updated estimates of the prevalence of fertility treatments among women in Utah experiencing a live birth and (2) assess how infertility treatments are associated with women’s age and prior live births. They report that approximately 10% of women who ultimately had a live birth sought treatment for infertility during this time frame, with around 5% for women 20–24 years to over 25% for women 40 years or older.
Shaaban et al. used UT-PRAMS data from 2012 to 2020 to shed light on the social determinants of health, including age, race, insurance type, education, and income, that play a significant role in whether a mother will attend her postpartum checkup. The authors educate us on the importance of postpartum care to prevent pregnancy-related morbidity and mortality. They note that federal legislation and community interventions can help improve postpartum checkup attendance.
Alsafi et al. used UT-PRAMS data from 2009 to 2019 to report the U-shaped relationship between maternal age and infant mortality and strategies to reduce infant mortality through federal and state education programs. Additionally, the authors educate us on other critical predictive factors for infant mortality, including maternal education, showing a near doubling of infant mortality among women with an 8th-grade education or less compared to women with at least an associate degree or higher.
Commentaries:
Ryanna Durrant provided an enlightening commentary on the cognitive health of widows in the US, highlighting how social leisure activities provide a protective role for widows and may serve as a coping strategy to preserve cognitive functioning.
Lueken et al. gave a powerful message on the multi-generational effect of illiteracy in the lives of Black American women. The authors underscore the need for “efforts to create intellectually stimulating and creative enrichment among young Black students that must include integrating Black, Brown, and Indigenous people’s stories and culture into educational spaces….”
Bradford et al. wrote an essential commentary on the impacts of menopause on cognitive function, with a call to action for continued research on the effects of decreased estrogen levels on cognitive decline and a more individualized approach to examine the effects of hormone replacement therapy among postmenopausal women.
Our 2022 issue is well underway with an increasing number of submissions and publications. The journal publishes original research or review articles, data snapshots, and commentaries focusing on women’s health or sex and gender differences that affect the 7 Domains of Health—physical, social, emotional, intellectual, environmental, financial, and spiritual. The Editorial Board reflects our ONE U for U (1U4U) approach to sex and gender health. By creating and hosting this peer-reviewed journal within Eccles Library Digital Publishing, UWHR can facilitate publication opportunities for established sex and gender health researchers, graduate students, residents, and up-and-coming professionals all over Utah. UWHR’s rolling submissions and publication dates allow for a fast turnaround time and a satisfying experience for submitting authors. Using the WordPress platform, we invite ongoing submissions. There are no publication charges. All published articles are covered by a Creative Commons License (CC BY-NC-ND 4.0) and assigned a DOI. UWHR could not succeed without our invaluable peer reviewers and associated editors. Please contact us if you are interested in serving in either of these capacities.
We look forward to receiving and reviewing your submissions this year and beyond!
Sincerely,
Karen Schliep, PhD, MSPH Utah Women’s Health Review Editor-in-Chief
An Overview Analysis of Infant Mortality in Utah: A Comprehensive Analysis of 2009–2019 Utah Pregnancy Risk Assessment Monitoring System (PRAMS) Data
Background
Although the infant mortality rate in the US appeared stagnant in the early 2000s, there has been a steady decrease in the overall rate since the 1990s.1 Compared to the national trend, infant mortality in Utah has not shown a striking decrease within the same time frame but has maintained a relatively steady slope downward.2-3 It has been determined that the leading causes of infant mortality in Utah are preterm birth, birth defects, sudden unexpected infant death (SUID), and medical conditions an infant may have that predisposes them to a shortened lifespan.2
Infant mortality is defined as the number of deaths in children under one year of age per 1000 live births in the same year, which has been regarded as a highly sensitive measure of population health.4 Preterm birth is the delivery of a baby before 37 weeks of gestation has been completed and has various sub categorizations, such as very preterm (28–32 weeks) and extremely preterm (<28 weeks).5 Due to uncertainty in precisely estimating gestation time, some countries categorize a preterm infant by birth weight of less than 2500g.5 One of the leading causes of infant mortality is birth defects. It is a term used for conditions of malformations, disruptions, or deformations that may be due to physical or biochemical abnormalities.6
The seven domains of health are all interconnected with infant mortality rates, but environmental, intellectual, and financial health are of particular relevance when analyzing the causes and stressors of infant mortality. Factors related to environmental health, such as the mother’s working environment and the presence of industrial pollution, can have a direct negative effect on the health of a fetus that can contribute to infant mortality.7 While intellectual health includes more than formal education, studies have found an association between low maternal education levels and an increased risk of infant mortality.8 Socio-economic status, or financial health, can have a significant effect on the overall health and well-being of the parent and infant. A study conducted in Nepal found that regions mainly composed of poor and middle-class individuals experienced higher infant mortality rates than the wealthier areas of the country.9 These three domains of health can all contribute to a lack of access to resources and support that may impact the likelihood of infant mortality.
Infant mortality rate can be an important indicator of population health when comparing the health status of countries or regions with the passage of time or at a single point in time. This information can also assist in guiding the allocation of health services and resources. For instance, Utah Pregnancy Risk Assessment Monitoring System (PRAMS) data indicate that parity, age, and education have notable effects on rates of infant mortality.2 Analyzing this information will allow for reflection on the current systems that are in place that may put certain populations at a disadvantage and make adjustments to better support them. While old and young age and lower education are well known risk factors for infant mortality,8 whether parity directly contributes to increased risk of infant mortality in Utah or is simply confounded by older age has yet to be explored. The main objectives of this data snapshot are to analyze the recent infant mortality trends in Utah and how they compare to national data. Additionally, we set out to evaluate the independent relationship between maternal parity and infant mortality in Utah, taking into account maternal age.
Methods
The data utilized for this analysis of infant mortality in Utah was collected from the years 2009 to 2019 for infants who died before their first birthday from Utah PRAMS via the Indicator-Based Information System for Public Health (IBIS-PH). PRAMS collects data directly from birth parents of live infants to provide estimates of various maternal and infant health indicators.10 Forty-six states, including additional US territories and local municipalities, participate in the surveys through funding and collaboration between the Centers for Disease Control and Prevention (CDC) and local health departments.11 The Utah Department of Health (UDOH) Reproductive Health Program manages the Utah division of PRAMS. Utah PRAMS conducts an annual survey to gain insights into maternal experiences before, during, and after pregnancy. The survey is administered based on a sampling system that randomly selects approximately 200 new mothers from Utah birth certificates two to four months after delivery.12 The data is stratified by birth weight and maternal education to highlight underrepresented groups.13
The outcome of interest was infants who died before their first birthday (under 365 days).
Data collected by Utah PRAMS was a pooled analysis spanning 10 years and included surveying maternal parity, age, and education levels. Response options to education level question included 8th grade or less; 9th–12th grade no diploma; high school graduate or GED completed; some college credit, but no degree; associate degree (e.g. AA, AS); bachelor’s degree (e.g. BA, AB, BS); master’s degree (MA, MS, MEng, Med, MSW, MBA); doctorate (e.g. PhD, EdD) or professional degree (e.g. MD, DDS, DVM, LLB, JD); none; or unknown. Deaths per 1,000 live births and 95% confidence intervals (CI) were reported for each education level. In our analyses assessing the relationship between parity and infant mortality, we accounted for confounding by maternal age via stratification.
Data and Results
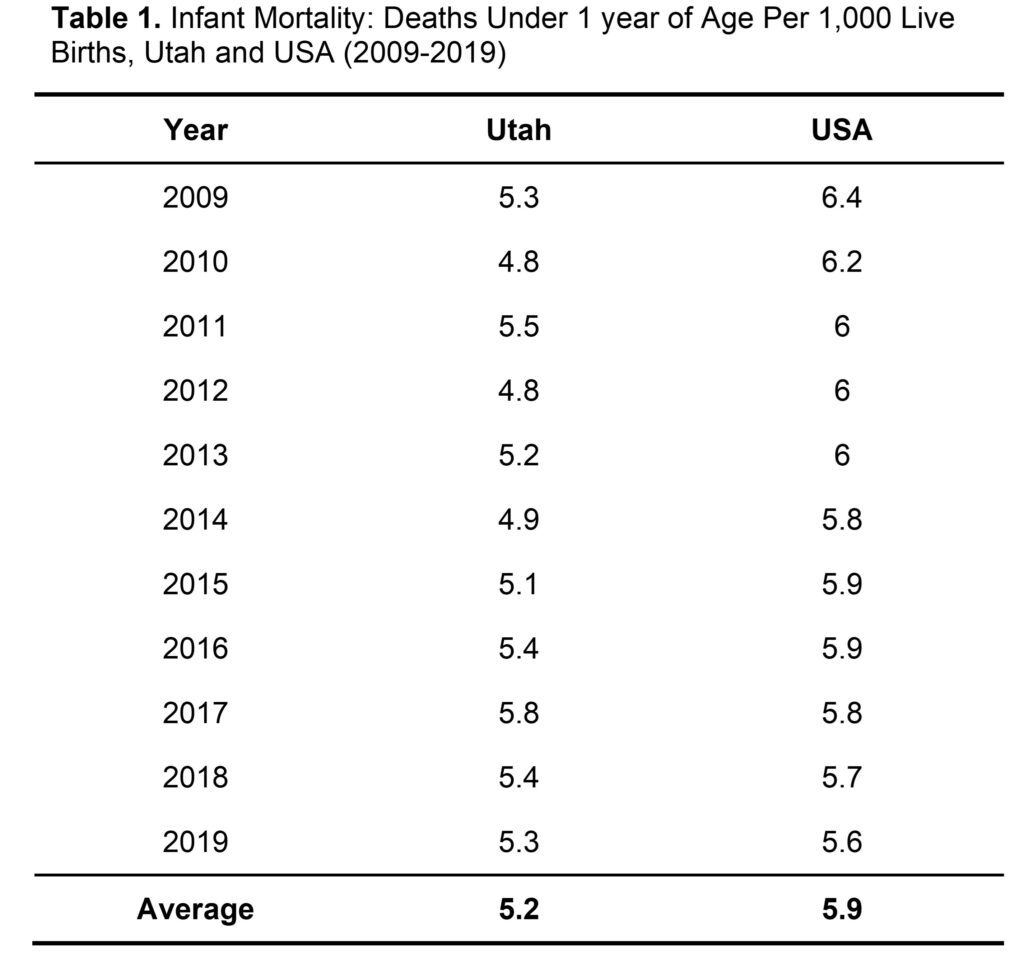
Between 2009 to 2019, Utah PRAMS collected information on 554,557 live births to Utah resident mothers regardless of where they occurred within Utah.14 Since the information related to live births in the Utah PRAMS database is collected from the birth and death certificates of the infants, it is difficult to gauge the number of women represented by the number of live births. Therefore, one woman might account for more than one live birth from 2009 to 2019. Of those live births, 2,834 resulted in infant deaths at 364 days or less.14 The study consisted of approximately 31.9% of women between the ages of 35 to 44, 33.4% of women between the ages of 20–34, and 34.8% of women between the ages of 15–19.14 The overall infant mortality rate in Utah from 2009 to 2019 was 5.2 infant deaths per 1,000 live births which was 0.66 fewer infant deaths per 1,000 live births than the US average (Table 1).
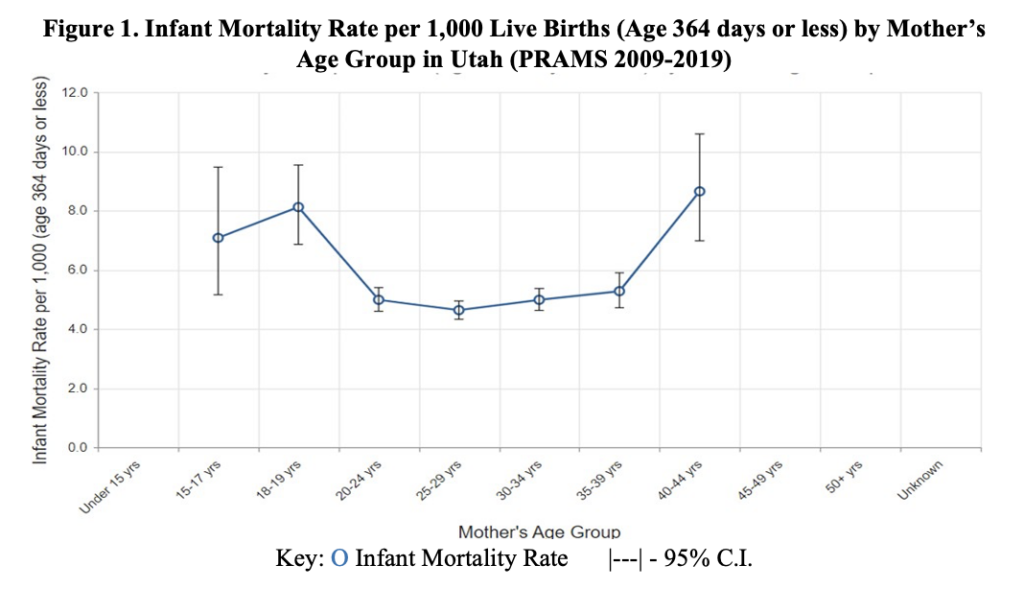
Despite a lower average infant mortality rate in Utah compared to the USA, higher infant mortality rates were prevalent among women aged 15–17, 18–19, and 40–44 years old in Utah (Figure 1). Mothers between the ages of 20–39 years old had an infant mortality rate of around 5 deaths per 1,000 live births. The infant mortality rate tends to be higher around critical moments of reproductive development in a woman’s life, such as puberty around the ages of 15–19 and the beginning stages of menopause which is around 40–44 years of age.15 These two phases demarcate the beginning and the end of the female reproductive life cycle.15
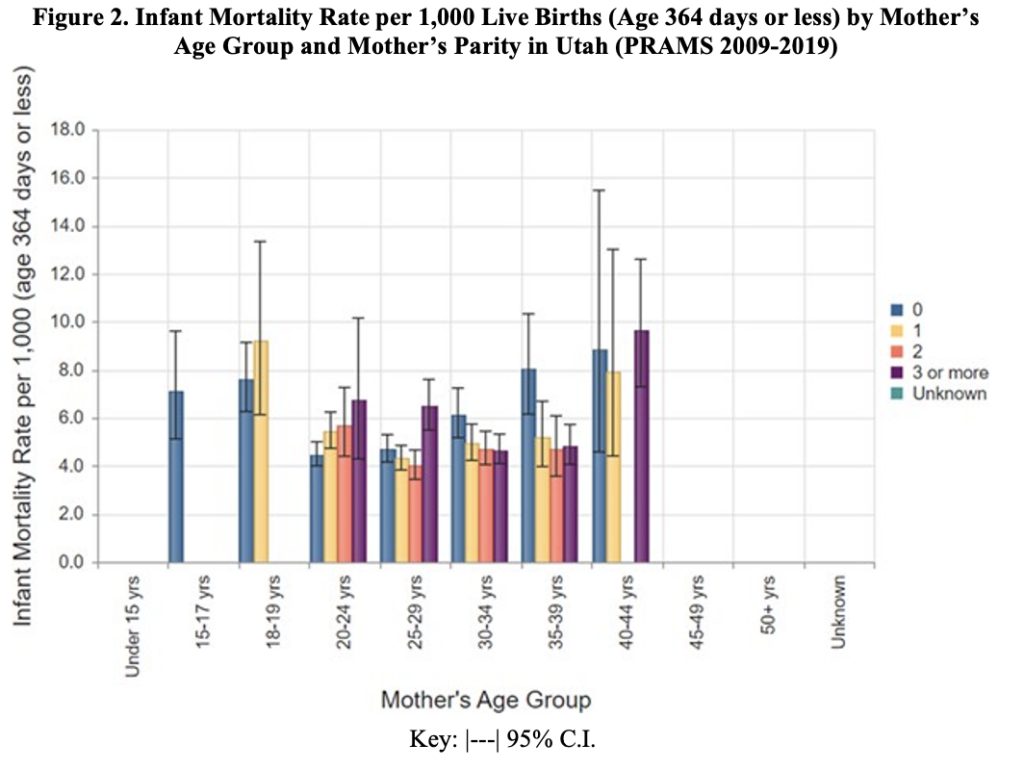
In the maternal age stratified analyses assessing relationship between parity and infant mortality (Figure 2), maternal age appears to be driving the relationship with a similar U-shaped relationship as seen in Figure 1. While 3+ parity showed the highest probability for infant mortality among women ages 25–29 and 40–44 years, nulliparous women had the highest probability of infant mortality among women ages 30–34 and 35–39 years. However, overlapping 95% CIs throughout the many comparisons indicate any direct association between parity and infant mortality is null.
In addition to age, there appeared to be a correlation between maternal education level and infant mortality rate. Women who reported only completing the 8th grade were twice as likely to experience an infant loss compared to those who held doctorates or professional degrees (Table 2). However, there was a steady decline in the probability of experiencing infant loss as each degree level increased. Mothers in the unknown category were the most susceptible group to experience infant loss, surpassing those who reported an education of 8th grade or less by an additional 4 deaths per 1,000 children (Table 2).
Discussion
The data analyzed in this snapshot of infant mortality between the years 2009–2019 in Utah has illustrated that women in the age groups 15–17, 18–19, and 40–44 years old experienced 3 more infant deaths per 1000 live births than 20–24, 25–19, 30–34, and 35–39-year-olds, on average. It should be noted that parity and infant mortality are confounded by age. Women aged 40–44 were identified as the most at-risk group for infant mortality. It is also essential to identify other high-risk groups, such as women who did not receive an education past the 8th grade and those in the 17–19 age group. Since Utah IBIS and PRAMS collected data on all live births in the state, the data analyzed gives the most accurate rates for Utah at the time.
Extreme maternal ages were notably associated with an increased risk of infant mortality. Biological maturation, sociodemographic factors like education, and economic factors play a role in adverse outcomes of adolescent and advanced maternal age pregnancies.16-18 These effects include an increased likelihood of infant mortality and adverse pregnancy and infant health outcomes.16-18 The negative impacts of advanced maternal age are also partly due to the link between increasing maternal age and a higher prevalence of pre-existing health conditions that may cause pregnancy complications, such as hypertension, obesity, placenta previa, gestational diabetes, etc.19 When considering interventions for these age groups, various biological and societal factors of each patient must be addressed to meet their needs.
As mentioned previously, a strength of PRAMS is its capacity to collect data that allows for a population-based analysis of all live births in Utah. However, the limitations of this analysis of infant mortality in Utah are linked to the limitations of the PRAMS database. Data from individuals who did not experience a live birth are not included in the PRAMS database. While infant mortality does not include stillbirths, comparing data on stillbirths and their possible causes to causes of infant mortality could have the potential to reduce the risk of both outcomes. Parity measures birth after at least 20 weeks of gestation in the US.20 If spontaneous or elective abortions occurred, data on that information was not collected by PRAMS to be factored into data on parity. The data regarding education was self-reported, so there could have been misreporting or a lack of reporting (Table 2).
Since there is a range of causes for infant mortality, a variety of prevention efforts would be necessary to decrease infant mortality rates. There is a strong association between infant mortality and maternal education.21 Therefore, education would be a powerful tool for both patients and healthcare providers to improve maternal and neonatal outcomes. The Utah Women and Newborn Quality Collaborative (UWNQC) aims to meet that goal by using “evidence-based practice guidelines and quality improvement processes.”22 The target populations for decreasing infant mortality based on the data analyzed from Utah PRAMS would be at the two ends of the U-shaped relationship between maternal age and infant mortality. This includes women between the ages of 15–17, 18–19, and 40–44. Utah offers a federally funded Personal Responsibility Education Program (PREP) that provides adolescents information on various pregnancy prevention interventions. Older women can seek advice at family planning clinics and programs to prevent pregnancies. The UDOH Maternal and Infant Health Program (UDOH-MIHP) also provides family planning services through the Mother to Baby Utah program. Prenatal counseling can be a useful tool to reduce infant mortality among pregnancies that are at risk for adverse health effects due to advanced maternal age. Genetic counseling could be further recommended to identify biomarkers that may increase the risk of infant mortality. The UDOH-MIHP is reviewing data compiled from public health programs to identify risks throughout the stages of pregnancy and develop corresponding programs to address those issues.2 Continued efforts on all fronts are crucial to reducing infant mortality in Utah as well as other populations.
References
MacDorman MF. Race and ethnic disparities in fetal mortality, preterm birth, and infant mortality in the United States: an overview. Semin Perinatol. 2011;35(4):200-208. doi:10.1053/j.semperi.2011.02.017
Utah Department of Health, Center for Health Data and Informatics, Indicator-Based Information System for Public Health. Health Indicator Report of Infant Mortality. ibis.health.utah.gov. Published January 14, 2022. Accessed March 15, 2022. https://ibis.health.utah.gov/ibisph-view/indicator/view/InfMort.Ut_USYear.html
Ely DM, Driscoll AK. Infant Mortality in the United States, 2018: Data From the Period Linked Birth/Infant Death File. Natl Vital Stat Rep. 2020;69(7):1-18. https://www.cdc.gov/nchs/data/nvsr/nvsr69/NVSR-69-7-508.pdf
Reidpath DD, Allotey P. Infant mortality rate as an indicator of population health. J Epidemiol Community Health. 2003;57(5):344-346. doi:10.1136/jech.57.5.344
Tucker J, McGuire W. Epidemiology of preterm birth. BMJ. 2004;329(7467):675-678. doi:10.1136/bmj.329.7467.675
Kirby RS. The prevalence of selected major birth defects in the United States. Semin Perinatol. 2017;41(6):338-344. doi:10.1053/j.semperi.2017.07.004
Genowska A, Jamiołkowski J, Szafraniec K, Stepaniak U, Szpak A, Pająk A. Environmental and socio-economic determinants of infant mortality in Poland: an ecological study. Environ Health. 2015;14:61. Published 2015 Jul 21. doi:10.1186/s12940-015-0048-1
Anele CR, Hirakata VN, Goldani MZ, da Silva CH. The influence of the municipal human development index and maternal education on infant mortality: an investigation in a retrospective cohort study in the extreme south of Brazil. BMC Public Health. 2021;21(1):194. Published 2021 Jan 22. doi:10.1186/s12889-021-10226-9
Khadka KB, Lieberman LS, Giedraitis V, Bhatta L, Pandey G. The socio-economic determinants of infant mortality in Nepal: analysis of Nepal Demographic Health Survey, 2011. BMC Pediatr. 2015;15:152. Published 2015 Oct 12. doi:10.1186/s12887-015-0468-7
Shulman HB, D’Angelo DV, Harrison L, Smith RA, Warner L. The Pregnancy Risk Assessment Monitoring System (PRAMS): Overview of Design and Methodology. Am J Public Health. 2018;108(10):1305-1313. doi:10.2105/AJPH.2018.304563
Centers for Disease Control and Prevention. (2022, January 21). Participating PRAMS Sites. Centers for Disease Control and Prevention. https://www.cdc.gov/prams/states.htm
Hoyt LT, Falconi AM. Puberty and perimenopause: reproductive transitions and their implications for women’s health. Soc Sci Med. 2015;132:103-112. doi:10.1016/j.socscimed.2015.03.031
Londero AP, Rossetti E, Pittini C, Cagnacci A, Driul L. Maternal age and the risk of adverse pregnancy outcomes: a retrospective cohort study. BMC Pregnancy Childbirth. 2019;19(1):261. Published 2019 Jul 23. doi:10.1186/s12884-019-2400-x
Driscoll AK, Ely DM. Effects of changes in maternal age distribution and maternal age-specific infant mortality rates on infant mortality trends : United States, 2000–2017. Centers for Disease Control and Prevention. https://stacks.cdc.gov/view/cdc/89876. Published June 25, 2020. Accessed July 18, 2022.
Ratnasiri AWG, Lakshminrusimha S, Dieckmann RA, et al. Maternal and infant predictors of infant mortality in California, 2007-2015. PLoS One. 2020;15(8):e0236877. Published 2020 Aug 6. doi:10.1371/journal.pone.0236877
Laopaiboon M, Lumbiganon P, Intarut N, et al. Advanced maternal age and pregnancy outcomes: a multicountry assessment. BJOG. 2014;121 Suppl 1:49-56. doi:10.1111/1471-0528.12659
Opara EI, Zaidi J. The interpretation and clinical application of the word ‘parity’: a survey. BJOG. 2007;114(10):1295-1297. doi:10.1111/j.1471-0528.2007.01435.x
Cramer JC. Social factors and infant mortality: identifying high-risk groups and proximate causes. Demography. 1987;24(3):299-322. doi:10.2307/2061300
Utah Department of Health Maternal & Infant Health Program. UWNQC Utah Women and Newborns Quality Collaborative. mihp.utah.gov. Published date unknown. Accessed March 14, 2022. https://mihp.utah.gov/uwnqc
Citation
Alsafi Z, Bartley S,& Kim S. (2022). An Overview Analysis of Infant Mortality in Utah: A Comprehensive Analysis of 2009–2019 Utah Pregnancy Risk Assessment Monitoring System (PRAMS) Data. Utah Women’s Health Review. doi: 10.26054/0d-2ya2-cnvg
Postpartum Checkups in Utah: An Analysis of 2012-2020 Utah Pregnancy Risk Assessment Monitoring System (PRAMS) Data
Background
Approximately 700 women die each year from pregnancy-related complications in the United States. About one in three maternal deaths happen between one week and one year postpartum. Most of these deaths are preventable, and closing the gaps in access to quality care can help.1Postpartum healthcare occurs during the first six weeks after childbirth and examines various aspects of maternal health, including physical, mental, and emotional.2Many women experience various physical discomforts, including increased rates of fatigue,3 increased backaches and headaches,4 sleep disorders, and bowel disorders.3 Becoming a mother can sometimes provoke mental and emotional distress, often becoming too severe and resulting in postpartum depression.5 The lack of postpartum follow-up can sometimes leave many diseases undiagnosed, often leading to postpartum death. Postpartum death can also occur due to severe bleeding, high blood pressure, infection, and cardiomyopathy.
Postpartum visits allow healthcare providers to screen for maternal emotional health, facilitate breastfeeding, monitor the newborn’s growth and overall health, counsel women about family planning, and refer mother and baby to additional services.6 These visits become critical in maintaining maternal and neonatal health. This review aims to assess the prevalence of postpartum care and identify the demographics of the women who miss their postpartum checkups in Utah.
Methods
We used 2012-2020 data for women for the Utah Pregnancy Risk Assessment Monitoring System (PRAMS) via the IBIS-PH interactive query system to investigate postpartum care in Utah. PRAMS is an ongoing, population-based surveillance project coordinated by the Centers for Disease Control and Prevention (CDC). Utah is one of 47 states that collect PRAMS data annually with the intent to monitor maternal and child health indicators. Each month, approximately 200 new mothers are randomly selected for participation using Utah birth certificates. Data is collected by following a protocol developed by the CDC that utilizes mail and telephone questionnaires, and approximately 60% of randomly-selected new mothers respond to the surveys. The responses are weighted to represent all women who have live births in Utah.7
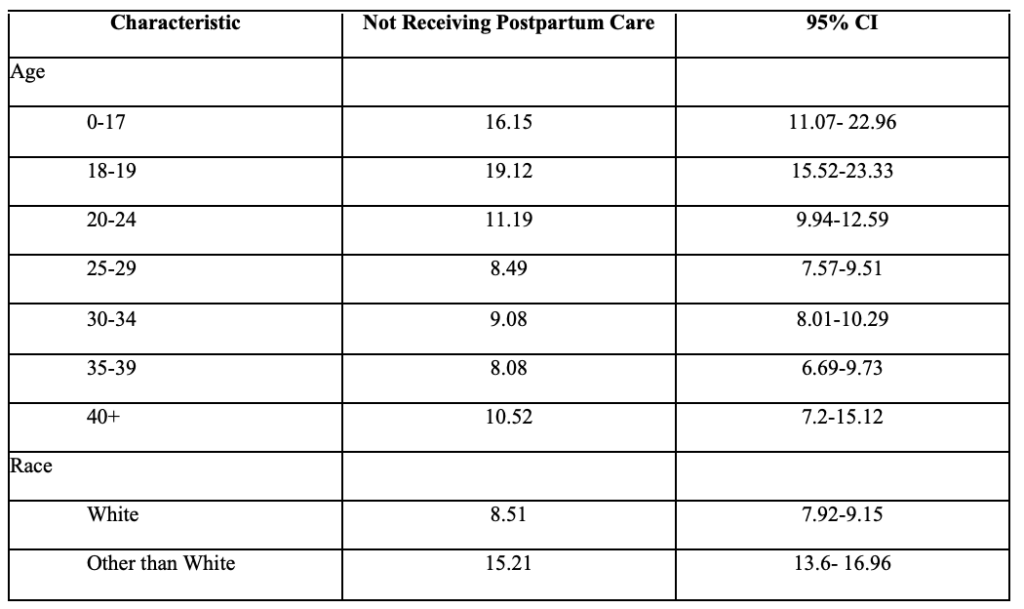
Missed postpartum appointments served as the outcome of interest. This outcome was assessed via the question, “Since your new baby was born, have you had a postpartum checkup for yourself?” The response to this question was binary (yes/no). The demographics available to us through the PRAMS data were age, race, education, income, previous live births, marital status, ethnicity, and insurance status. Age was separated into 7 different categories: 0-17, 18-19, 20-24, 25-29, 30-34, 35-39, 40+). Parity was divided into three categories: no prior live births, 1-4 prior live births, and 5+ live births. Race was dichotomized into White and non-White participants, and education was divided into less than high school, high school, some college, or college graduate. Prevalence of missed checkups and 95% confidence intervals were reported. The data reported through IBIS-PH considered weighted stratified sampling used by PRAMS.
Results
12,814 women, with a yearly range of 1,232 to 1,698, participated in UT-PRAMS from 2012 to 2020. Out of these women, in 2020, 11.14% (CI 9.4 -13.16%) of women did not attend their postpartum checkups. The rate of women without a postpartum check had declined steadily from 10.22% in 2014 to 7.97% in 2019. The 2020 rate of 11.14% is the highest recorded (Table 1).
Table 1: Rate of Insufficient Postpartum Care (From 2012) by Year
Figure 1 shows the prevalence of not receiving postpartum care among non-White women in Utah is much higher than White women. It ranges from 9.65% in 2016 (CI 5.1% – 15.4%) to 21.19% in 2014 (16.11% – 27.35) of women identifying as non-White not receiving postpartum care. In 2020, 9.78% of White mothers (CI 8.0 – 11.9%) did not have a postpartum checkup compared to 19.04% of non-White mothers (CI 13.52 – 26.14%).
Figure 1: Rate of Insufficient Postpartum Care (From 2012) by Race and Year
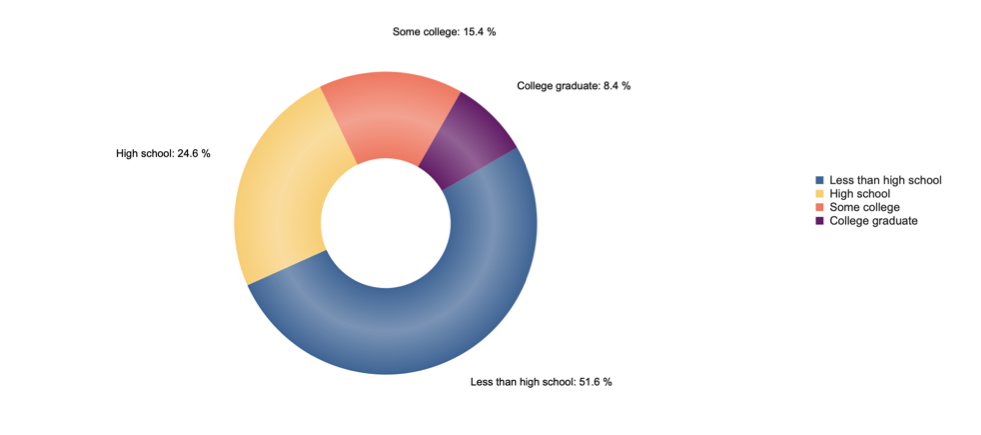
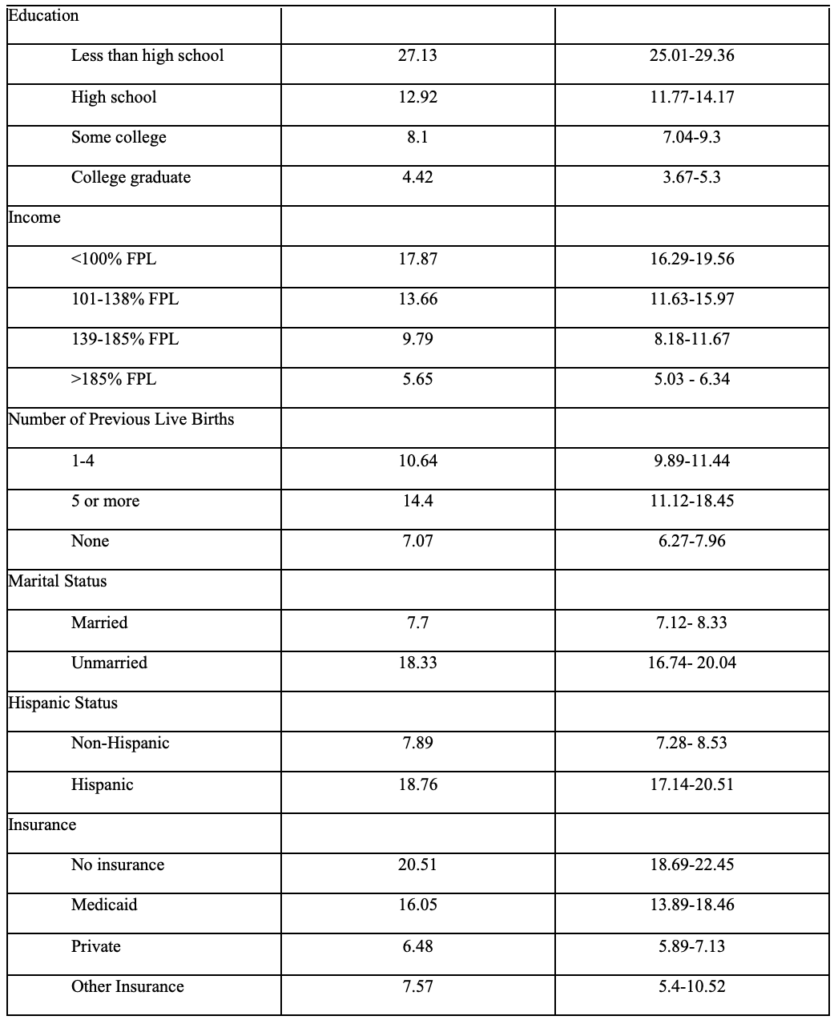
Women who did not receive postpartum care tended to have lower education levels (Figure 3). Between 2012 and 2020, women with less than a high school education contributed to 51.6% of those who did not receive postpartum care. In 2020, 34.03% of mothers with less than high school education, 13.8% with high school education, 10.92% with some college, and 5.55% with college degrees did not have a postpartum visit. Table 2 shows the prevalence of missed postpartum checkups based on the demographics provided by IBIS-PH.
Figure 2: Education Distribution Amongst Women Not Receiving Postpartum Care (From 2012)Table 2. Demographics of Postpartum Care Users in Utah (PRAMS 2012 and later)
Conclusion
The data snapshot of Utah PRAMS from 2012-2020 reveals increases in postpartum care for multiple demographic categories between 2012 and 2019 until a decrease in 2020. In general, women who did not receive postpartum care were younger, less educated, unmarried, underinsured, lower-income, and have more children than women who receive postpartum care. This review examined the demographics of women who were more likely to miss a postpartum checkup. Determining these demographics can help target future interventions to increase postpartum care. The social determinants of health, such as age, race, insurance type, education, and income, play a significant role in whether a woman will attend her postpartum checkup, as previous studies have shown.8, 9 Postpartum care touches on all seven health domains while emphasizing physical, social, and emotional health.
Women under 20 years old were less likely to attend postpartum checkups, as shown in our data snapshot and other studies.10 Wilcox et al. suggests that rates of postpartum depression are higher among adolescents.8 Still, because these women are more likely to miss their checkups, providers are less likely to identify and treat the symptoms. Others mention that postpartum depression does not occur immediately after discharge, so rapid screening becomes ineffective and long-term postpartum care is necessary.11 Sober et al. examined adolescent pregnancies and found that two-thirds of the teens felt they became pregnant ‘too soon.’12 Creating programs emphasizing family planning and contraceptive usage can help delay unwanted childbearing in adolescents.
Barriers to postpartum-care access play a role in postpartum checkup appearances. Women with Medicaid or without insurance, and those who live below the federal poverty level, are less likely to attend postpartum checkups. Currently, Utah Medicaid participants only have up to 60 days of postpartum coverage, which would not be sufficient to be able to diagnose and treat particular mental, physical, or emotional distresses.13 Our findings correspond with national data on other states that have not approved Medicaid expansion. These individuals are less likely to gain access to a provider, or paying for a checkup may be a low priority.14 Mothers may prioritize purchasing essentials for their infants instead of postpartum healthcare. States with Medicaid expansion had increased usage of postpartum services, such as preventive, contraceptive, and mental health services.15, 16 Policy changes that include more women covered by governmental healthcare assistance can help increase postpartum checkup attendance.
Policy Implementations and Interventions
Federal legislation serves as the primary catalyst for improved maternal health outcomes, including postpartum checkup attendance.17 One legislative change would be to include state Medicaid coverage of birth center deliveries, as only 30 state Medicaid programs cover these costs.18, 19 Strengthening these birth centers can improve access to maternal care for low-income women and ease the burden on hospital systems. Changing economic incentives, such as lowering the reimbursement for unnecessary cesarean sections and increasing midwives’ compensation, can also improve maternal health outcomes. Financial adjustments can also include increasing coverage for home births and lactation consultants.20, 21
Community interventions play an equally important function in improving postpartum checkup attendance. Establishing bilingual partners and doula programs have improved postpartum care rates and the quality of care.22, 23 These programs target minority, low-income groups to receive quality care. Other interventions include providing postpartum care information packets and lists of community resources to pregnant women; studies conducted by the Centers for Medicare and Medicaid Services found that 100 percent of women who received these packets attended their postpartum care appointments.23 Some women do not attend postpartum appointments due to further barriers, such as lack of transportation. To combat these barriers, healthcare teams could make home visits to screen for postpartum depression, educate the mothers, and conduct a postpartum assessment.23, 24
Limitations
The standardized approach of PRAMS’ data comparison across multiple states and years increases the breadth and depth of the data collected. Information is collected on demographics, preconception, pregnancy, and postpartum on health-related behaviors, attitudes, and outcomes. However, limitations of our study also arise from the data collected through PRAMS. PRAMS data are self-reported and may be subject to social desirability and recall biases. Additionally, some of the variables are limited in the data they report. For example, parity is only defined as no live births, 1-4 live births, or 5+ live births. PRAMS also lacks information about pregnancy complications and delivery type, which may play a significant role in care. There are other factors that PRAMS does not address, like available transportation to the doctor and distance to a healthcare facility.
Conclusion
In this data snapshot, sociodemographic factors were highly associated with missing a postpartum checkup. Because these checkups help examine women’s mental and physical health, interventions focused on improving attendance of postpartum checkups can substantially increase the health of new mothers and neonates. Finding new ways to create accessible and affordable healthcare can also increase the attendance of these appointments. Interventions that educate the public, especially underserved populations, about the necessities of postpartum care could also improve attendance.
2. Polk S, Edwardson J, Lawson S, et al. Bridging the Postpartum Gap: A Randomized Controlled Trial to Improve Postpartum Visit Attendance Among Low-Income Women with Limited English Proficiency. Womens Health Rep (New Rochelle). 2021;2(1):381-388. doi:10.1089/whr.2020.0123
3. Ansara D, Cohen MM, Gallop R, Kung R, Schei B. Predictors of women’s physical health problems after childbirth. J Psychosom Obstet Gynaecol. Jun 2005;26(2):115-25. doi:10.1080/01443610400023064
4. Saurel-Cubizolles MJ, Romito P, Lelong N, Ancel PY. Women’s health after childbirth: a longitudinal study in France and Italy. Bjog. Oct 2000;107(10):1202-9. doi:10.1111/j.1471-0528.2000.tb11608.x
5. Cheng CY, Fowles ER, Walker LO. Continuing education module: postpartum maternal health care in the United States: a critical review. J Perinat Educ. Summer 2006;15(3):34-42. doi:10.1624/105812406×119002
8. Wilcox A, Levi EE, Garrett JM. Predictors of Non-Attendance to the Postpartum Follow-up Visit. Matern Child Health J. Nov 2016;20(Suppl 1):22-27. doi:10.1007/s10995-016-2184-9
9. Henderson V, Stumbras K, Caskey R, Haider S, Rankin K, Handler A. Understanding Factors Associated with Postpartum Visit Attendance and Contraception Choices: Listening to Low-Income Postpartum Women and Health Care Providers. Maternal and Child Health Journal. 2016/11/01 2016;20(1):132-143. doi:10.1007/s10995-016-2044-7
10. Nunes AP, Phipps MG. Postpartum Depression in Adolescent and Adult Mothers: Comparing Prenatal Risk Factors and Predictive Models. Maternal and Child Health Journal. 2013/08/01 2013;17(6):1071-1079. doi:10.1007/s10995-012-1089-5
11. Sit DK, Wisner KL. Identification of postpartum depression. Clin Obstet Gynecol. Sep 2009;52(3):456-68. doi:10.1097/GRF.0b013e3181b5a57c
13. Eckert E. Preserving the Momentum to Extend Postpartum Medicaid Coverage. Womens Health Issues. Nov-Dec 2020;30(6):401-404. doi:10.1016/j.whi.2020.07.006
14. Johnston EM, McMorrow S, Caraveo CA, Dubay L. Post-ACA, More Than One-Third Of Women With Prenatal Medicaid Remained Uninsured Before Or After Pregnancy. Health Affairs. 2021;40(4):571-578. doi:10.1377/hlthaff.2020.01678
15. Wang X, Pengetnze YM, Eckert E, Keever G, Chowdhry V. Extending Postpartum Medicaid Beyond 60 Days Improves Care Access and Uncovers Unmet Needs in a Texas Medicaid Health Maintenance Organization. Brief Research Report. Frontiers in Public Health. 2022-May-03 2022;10doi:10.3389/fpubh.2022.841832
16. Kumar N, Quinlan M. Making the Case for Expanding Medicaid Coverage to 12 Months Postpartum [23M]. Obstetrics & Gynecology. 2020;135:140S-141S. doi:10.1097/01.AOG.0000664800.77848.f9
18. Ranji U, Salganicoff A, Stewart AM, Cox MA, Doamekpor L. State Medicaid coverage of perinatal services: Summary of state survey findings. 2009;
19. Howell E, Palmer A, Benatar S, Garrett B. Potential Medicaid cost savings from maternity care based at a freestanding birth center. Medicare Medicaid Res Rev. 2014;4(3)doi:10.5600/mmrr.004.03.a06
20. Courtot B, Hill I, Cross-Barnet C, Markell J. Midwifery and Birth Centers Under State Medicaid Programs: Current Limits to Beneficiary Access to a High-Value Model of Care. Milbank Q. Dec 2020;98(4):1091-1113. doi:10.1111/1468-0009.12473
21. Hill I, Benatar S, Courtot B, et al. Strong Start for Mothers and Newborns Evaluation. 2016
22. Marsiglia FF, Bermudez-Parsai M, Coonrod D. Familias Sanas: an intervention designed to increase rates of postpartum visits among Latinas. J Health Care Poor Underserved. Aug 2010;21(3 Suppl):119-31. doi:10.1353/hpu.0.0355
23. Centers for Medicare & Medicaid Services. Resources on Strategies to Improve Postpartum Care Among Medicaid and CHIP Populations. 2015.
24. Tabb KM, Bentley B, Pineros Leano M, et al. Home Visiting as an Equitable Intervention for Perinatal Depression: A Scoping Review. Review. Frontiers in Psychiatry. 2022-March-18 2022;13doi:10.3389/fpsyt.2022.826673
Citation
Shaaban M, Turner E,& Myrer R. (2022). Postpartum Checkups in Utah: An Analysis of 2012-2020 Utah Pregnancy Risk Assessment Monitoring System (PRAMS) Data. Utah Women’s Health Review. doi: 10.26054/0d-38dn-fjaf
The Hand that Rocks the Cradle Cannot Read this Title: The Multi-Generational Effect of Illiteracy in the Lives of Black American Women
Problem Statement
In this commentary we will discuss the multi-generational effects of illiteracy for Black women and their children in the US, including financial and health literacy, intellectual challenges, social costs across generations, and the elements of discrimination that negatively impact their ability to access help and find success. In the US in 2020, the female literacy rate was 53.7 percent, which was 21.6 percent lower than the male literacy rate of 75.3 percent. When women with limited education, which is tied to illiteracy, become mothers, their children tend to experience lower levels of cognitive and socio-emotional functioning and academic achievement. They experience less success, both in school and later as adults in the workforce.1
The National Assessment of Educational Progress (NAEP) reported 85 percent of Black students in eighth grade lack proficiency in mathematics and reading skills.2 The ability to read and write affects every single aspect of our lives, from the way we work to the food we eat:
Illiteracy has a far-reaching impact on women who are not proficient in the areas of prose literacy (the ability to read instruction materials, brochures, news stories), document literacy (the ability to read and comprehend job applications, maps, payroll forms, schedules), and quantitative literacy (the ability to balance a checkbook, figure out a tip, determine interest rate). (4)3
We will show the aspects of discrimination that hinder women from achieving literacy, and how reading and writing are used to create a foundation for living a creative, independent, and critically aware life.4
Status of the Literature
Created in 1972, Title IX states that “no person in the United States shall, on the basis of sex, be excluded from participation in, be denied the benefits of, or be subjected to discrimination under any education program or activity receiving Federal financial assistance.”5 Title IX was meant to enact systemic change in the intellectual and creative aspects of young women’s education but sadly it has not achieved what it was created to do. This failure continues to impact generations, particularly among Black women.
The tie between illiteracy and lack of financial independence for Black women reveals complex social problems in the profiles of incarcerated Black women. These are likely to be young, low-literate, poorly skilled, and undereducated single mothers, who are unprepared for employment that pays a living wage. Often, they are survivors of physical and sexual abuse, have substance abuse problems, possess multiple physical and mental health problems, and are convicted primarily of drug-related charges.3
The literature highlights that Black women who do not achieve the foundational literacy skills through our public educational system in their youth have less opportunity for intellectual advancement, creating a vulnerable multi-generational situation for women when they become mothers and cannot help their own children to learn to read and write.6 Children of adults with low literacy will likely (72%) have even lower literacy skills.7 Education journalist Natalie Wexler emphasized that “Literacy needs its own focus because reading is the gatekeeper to functioning and succeeding academically, professionally, and civically. It underlies access to virtually all knowledge.”2
Call to Action
The US educational systems must effectively educate its citizens and respond to the aftermath of systemic racist and sexist policy in educational institutions, which have resulted in a dis-investment in Black women’s education. Illiteracy can cost the US nearly $225 billion in workforce productivity loss and results in expenses for federal and state welfare programs.8 Transformative measures must be implemented in policy to cascade changes.
Dual-generation strategies draw from findings that the wellbeing of parents is vital to their child’s socio-emotional and cognitive intelligence.9 “The three key components are 1) high-quality early childhood education, 2) job training for mothers that leads to a credential for high-wage/high-demand jobs and 3) family/peer support services” (4).1
Many existing programs such as Head Start, a federal program that promotes school readiness of children from low-income families, the Workforce Investment Act, and the Higher Education Act “could be blended with state and local funding to create new dual-generational programs” (16).1 An example of this includes Community Action Project (CAP) Tulsa’s Career Advance program, where parents of children in Head Start are recruited for post-secondary education and workforce training.9 In urban communities, places such as public libraries, resource centers, healthcare clinics, churches, and employment centers could all promote or create resources for low-education women and their developing children. For example, the national Jeremiah Program operates out of 7 urban locations and provides early childhood education for children and life-skills training to single mothers.9
Positive educational experiences act as protective factors for young women and girls of color growing up in adverse or oppressive environments. Efforts to create intellectually stimulating and creative enrichment among young Black students must include integrating Black, Brown, and Indigenous people’s stories, and culture into educational spaces, as well as exploring alternate forms of expression and thought processing through poetry, spoken word, art, story, theater, dance, film, etc.4
References
1. Hernandez DJ, Napierala JS. Mother’s education and children’s outcomes: How dual-generation programs offer increased opportunities for America’s families. 2014. Accessed Jun 2, 2022. https://files.eric.ed.gov/fulltext/ED558149.pdf
3. Alfred MV, Chlup DT. Neoliberalism, illiteracy, and poverty: Framing the rise in Black women’s incarceration. The Western Journal of Black Studies 2009 33(4): 240-249.
4. Frost CJ, Digre KB. 7 Domains of Women’s Health: MultidisciplinaryConsiderations of Women’s Health in the 21st Century. Kendall Hunt; 2016.
5. Title IX and sex discrimination. U.S. Department of Education, Office of Civil Rights. Aug 20, 2021. Accessed Jun 2, 2022. https://www2.ed.gov/about/offices/list/ocr/docs/tix_dis.html
8. Adult literacy facts. ProLiteracy. Accessed Jun 2, 2022. https://www.proliteracy.org/Adult-Literacy-Facts
9. McCann M. Two-generation strategies toolkit. National Conference of State Legislatures. 2018. Accessed May 30, 2022. https://www.ncsl.org/research/human-services/two-generation-strategies-toolkit.aspx#Toolkit
Citation
Lueken A, Mangan M, & Smaellie S. (2022). The Hand that Rocks the Cradle Cannot Read this Title: The Multi-Generational Effect of Illiteracy in the Lives of Black American Women. Utah Women’s Health Review. doi: 10.26054/0d-86nh-yyqh
Anxiety Symptoms and Severity among Perinatal Women Screened for Depression with the Edinburgh Postnatal Depression Scale
Abstract
Objectives: Describe the prevalence of anxiety among perinatal women screened with the Edinburgh Postnatal Depression Scale (EPDS) and identify the proportion of women screening positive for depression only, anxiety only, and co-occurring anxiety/depression
Methods: Routine screening for depression was offered to all clients at 5 rural Utah public health department clinics. The online EPDS screening was completed electronically at the clinic or on a smartphone or computer. The 3-question subscale within the EPDS provided a preliminary screen for anxiety.
Results: A total of 2008 completed the EPDS. The EPDS anxiety sub-scale had good reliability (α = 0.841). A total of 761 women screened positive on the EPDS scale (37.6%) and 516 screened positive on the anxiety sub-scale (25.7%). Among those with a positive EPDS score, 494 had co-occurring anxiety symptoms (64.9%), and 267 had depression symptoms alone (35.1%). Among those with a positive screen on the anxiety subscale, 22 had a negative overall EPDS score (4.3%). The difference in the proportion of Latinx women screening positive for anxiety n = 72 (21.0%) compared with non-Latinx women n= 411 (26.7%) was statistically significant.
Conclusions: Most women who screen positive on the EPDS also screen positive on the anxiety sub-scale. Among those with a positive anxiety screen, approximately 1 in 20 would have been missed based on their total EPDS score.
Implications: To provide more comprehensive perinatal mental health screening and subsequent care, it is helpful to consider the total EPDS score as well as the anxiety sub-scale.
Introduction
Perinatal anxiety (PA) is a common feature of perinatal mood disorders and often co-occurs with perinatal depression, with 1 in 5 of women experiencing anxiety during pregnancy or postpartum.1 Perinatal depression (PD) is one of the most common complications of pregnancy, occurring in approximately 1 in 7 pregnant women and in approximately 1 in 5 postpartum women. PD and anxiety are highly comorbid.2 High rates of anxiety disorders among women with depression during the perinatal period have been documented.2-5
Screening perinatal women for depression is increasingly common, while a concurrent focus on identifying anxiety is less common. This is likely due to a lack of screening tools specific to perinatal anxiety (PA), despite the importance.1 The Edinburgh Postnatal Depression Scale (EPDS) is a well-validated and widely-used screening tool for depression during the perinatal period.6 The EPDS contains a 3-question anxiety subscale called EPDS-3A. Despite its availability and use, providers rarely evaluate the EPDS anxiety sub-scale scores independently due to limited studies, as well as mixed results of the validity of EPDS-3A in detecting perinatal anxiety.7 However, identifying women with perinatal anxiety alone or co-occurring with perinatal depression is important in order to provide optimal care, as evidence-based approaches to treating women with anxiety and those with co-occurring depression/anxiety can differ from the approaches for addressing depression alone, including pharmacological treatment.8,9 Anxiety and depression are not identical emotional states, with anxiety being more associated with a future orientation and depression being more associated with past orientation.10 Thus, a more precise understanding of perinatal women’s mental health status will facilitate optimal care. The purpose of this study is to describe the prevalence of anxiety among perinatal Utah women screened with the EPDS and to identify the proportion of women screening positive for depression only, anxiety only, and co-occurring anxiety and depression.
Methods
Routine screening for perinatal depression was offered to all pregnant and postpartum individuals receiving services (e.g., immunizations, WIC- Women, Infants, and Children food supplement program certification) at public health clinics in five rural public health districts in Utah, including Central, Southeast, Southwest, San Juan, and Tooele. This study was approved by the Institutional Review Board at the University of Utah (IRB_00071041) and funded by the Utah Department of Health. The EPDS screenings were primarily completed during WIC certification clinic visits via an electronic tablet and the REDCap data management system survey tool. The EPDS survey was also available via a survey link, to be completed later at a time more convenient for clients. Women took the English-language survey at the public health clinic or used the survey link provided by the clinic to complete the survey later on their own device.
In addition to the EPDS screening tool, the REDCap survey included demographic questions, e.g., the individual’s age, gestational age or postpartum weeks, ethnicity, language preference, insurance type, location of clinic, and race. Each item of the EPDS was rated on a 0 (No, never; No, not at all) to 3 (Yes, most of the time; very often; quite a lot) rating scale. A cutoff value of 11 on the EPDS has a sensitivity of 0.81 (0.75, 0.87 95% CI) and specificity of 0.88 (0.85, 0.91) to detect perinatal depression.11 However, for this study, a cutoff value of 9 on the EPDS was selected to capture the greatest number of women with perinatal depression and anxiety, inclusive of mild symptomatology.11
The anxiety subscale (EPDS-3A) analyzes a latent construct found in responses to 3 questions in the EPDS instrument. The EPDS-3A sum of responses ranges from 0 to 9 with a cut off score of 6 suggesting symptoms of anxiety, and is unique from overall EPDS scores among childbearing women.12 Factor analysis of the EPDS suggests potential value as a multi-dimensional tool, with three items forming a subscale measure for symptoms of anxiety: including I have blamed myself unnecessarily when things went wrong, I have been anxious or worried for no good reason, I have felt scared or panicky for no good reason.13 The EPDS takes less than 5 minutes to complete.
Results
A total of 2,008 women completed the EPDS screening between 2018-2020 and had complete data on the anxiety sub-scale (9 women had missing data on the subscale and were excluded from analysis). The population demographics are shown in Table 1. The EPDS total scale had excellent reliability (α = 0.915) while the anxiety sub-scale had good reliability (α = 0.836). Of the 2,008 women screened, 37.9% of women (N=761) screened positive for perinatal depression and 25.7% (N=516) screened positive on the EPDS anxiety sub-scale. Among the women who scored positive on the overall EPDS scale, 64.9% also scored positive on the EPDS anxiety sub-scale (see Figure 1). A total of 267 scored positive on EPDS overall but negative on the EPDS anxiety sub-scale (35.1%). Also, a total of 22 individuals scored positive on the EPDS anxiety sub-scale (4.3%) despite having a total EPDS of less than 10 (see Figure 1).
We were also interested in evaluating any association between screening scores and ethnicity. Of the women that answered the ethnicity question (n=1,885), a lower proportion of Latinx women screened positive for EPDS overall (32.9%) compared with non-Latinx women (38.8%), χ2 (1) = 4.157, p= 0.04. Similarly, the proportions of women screening positive for anxiety overall was lower among Latinx women (21.0%) compared with non-Latinx women (26.7%), χ2 (1) = 4.721, p= 0.03.
Discussion
More than 1 in 3 women in the study screened positive for perinatal depression based on their overall EPDS score, and more than 1 in 4 had a positive screen on the EPDS anxiety sub-scale. Approximately two-thirds of women with a positive overall screen also had a positive anxiety sub-scale. Use of the EPDS 3A as well as the Hospital Anxiety and Depression Scale (HADS-A) to identify women with anxiety during late pregnancy, and at 2 to 4 months postpartum, demonstrates that 28% of new mothers exhibit anxiety symptoms.16 This is comparable to the prevalence of anxiety symptoms found in our study.
Among all women who screened positive on the anxiety sub-scale in the current study, approximately 4% would have been missed based on their total EPDS score (<9), indicating no symptoms of depression. This result is aligned with the work of Lautarescu et al., (2022) who found that between 1.9% to 3.38% of women with perinatal anxiety symptoms may have been missed because their total EPDS screen was negative (<13).15 Another study found that the EPDS 3A identified an additional 2.5% of anxiety cases that would not have been detected using the total EPDS score alone.7
Studies suggest effectiveness in using the EPDS for detecting anxiety using the sub-scale. Smith-Nielsen et al. (2021) found that an EPDS 3A of over five was optimal for identifying anxiety (sensitivity: 70.9; specificity: 92.2; AUC: 0.926).7 The authors concluded that the EPDS anxiety subscale may be a time-efficient screening tool for perinatal anxiety and can be used to identify both anxiety and depression.7 Loyal et al. (2020) reported that the EPDS 3A has good internal consistency which is greater than or equal to 0.70. Furthermore, it was reported that the overall EPDS score was more strongly associated with the 3A anxiety scores than with the HADS-A anxiety scores, although the study concludes that further studies are needed to evaluate its validity during pregnancy. To assess validity of a 4-item EPDS anxiety subscale by comparing it to the Spielberger State-Trait Anxiety Inventory (STAI-6), van der Zee-van den Berg et al. (2019) included items 3,4,5, and 10 of the EPDS instrument, and reached a conclusion that the 4-item subscale does not provide adequate screening for anxiety compared to the STAI-6 in a community sample of postpartum women. They also concluded that the 4-item subscale may not allow discrimination between depression and anxiety compared to the STAI-6.17 This finding is in alignment with our findings that the majority of women with symptoms of depression also had anxiety symptoms, while a small number were experiencing only anxiety symptoms without depression.
It is clear that perinatal women suffer from both anxiety and depression, and identifying women with each condition, as well as those with co-occurring anxiety and depression, will help providers tailor care, interventions, and guidance to meet each individual’s unique needs. Perinatal anxiety and depression are often treated with similar interventions, such as selective serotonin reuptake inhibitors and cognitive behavioral therapy, but women may need different resources and reassurance if they are experiencing both conditions, or experiencing anxiety alone.18
Our findings that non-Latinx women have higher rates of positive overall EPDS screens and anxiety sub-scale screens than Latinx women is aligned with the study of de la Rosa et al. (2021) reporting Latinx women were significantly less likely to report an EPDS score of 10 or above (8.6%) than non-Latinx women (20.5%).19 Hartley et al., (2014) recommend using the total EPDS score and EPDS-3A to identify PD and PA in Latinx women but also recommend further validation studies.20 In contrast, Liu & Tronic (2012) found that Latinx women experience higher levels of postpartum depressive symptoms than non-Hispanic white women.21 Some studies suggest that stigma and social acceptability, as well as low rates of seeking care, are contributors to the differences in the documented diagnosis of depression among Latinx women, despite of the number of reliable screenings to detect PD.23 Further studies are required to assess the meaning of lower score of EPDS in Latinx women compared to non-Latinx women. Our screening questions were only in English, which means findings may not be generalizable to Latinx women who do not speak English.
The strengths of our study include a large sample size and use of the EPDS, a widely used screening tool in healthcare settings. Limitations of the study include lack of an anxiety-specific comparison tool administered alongside the EPDS 3A subscale, such as the GAD-7. Additionally, study findings may not be generalizable to all perinatal women, as individuals completing the screening were all rural residents who were visiting public health clinics that largely provide services to an underserved population. Future research comparing the EPDS-3A to other validated, reliable anxiety scales such as the GAD-7 is warranted. Furthermore, future studies could include evaluation of differences between Latinx and non-Latinx childbearing women, to better understand discrepancies.
Health Implications
Consideration of the total EPDS score as well as scores on the anxiety sub-scale (or screening for both anxiety and depression with two separate scales) is important in providing more comprehensive perinatal mental health screening and care with appropriate guidance and resources. There is a high occurrence of PD and PA, and the EPDS is an efficient tool to screen and treat both anxiety and depression. However, future studies are required to assess validity of EPDS-3A compared to other anxiety scales. Utilizing the EPDS-3A can be a first step to identify the risk of perinatal anxiety and to initiate discussion about further screening or treatments of the symptoms. While more research will be required, the EPDS-3A sub-scale may be an efficient way to screen patients for anxiety at the same time as screening for depression, using only one screening tool.
Acknowledgements and Funding
We thank five rural public health districts in Utah: Central, Southeast, Southwest, San Juan, and Tooele for assisting with recruitment and screening women. This study was supported by the Utah Department of Health.
References
1. Fawcett EJ, Fairbrother N, Cox ML, White IR, Fawcett JM. The Prevalence of Anxiety Disorders During Pregnancy and the Postpartum Period: A Multivariate Bayesian Meta-Analysis. The Journal of clinical psychiatry. 2019;80(4).
2. McKee K, Admon LK, Winkelman TNA, et al. Perinatal mood and anxiety disorders, serious mental illness, and delivery-related health outcomes, United States, 2006-2015. BMC women’s health. 2020;20(1):150-150.
3. Farr SL, Dietz PM, O’Hara MW, Burley K, Ko JY. Postpartum anxiety and comorbid depression in a population-based sample of women. Journal of women’s health (2002). 2014;23(2):120-128.
4. Ramakrishna S, Cooklin AR, Leach LS. Comorbid anxiety and depression: a community-based study examining symptomology and correlates during the postpartum period. J Reprod Infant Psychol. 2019;37(5):468-479.
5. Wisner KL, Sit DKY, McShea MC, et al. Onset timing, thoughts of self-harm, and diagnoses in postpartum women with screen-positive depression findings. JAMA Psychiatry. 2013;70(5):490-498.
6. O’Connor E, Rossom RC, Henninger M, Groom HC, Burda BU. Primary Care Screening for and Treatment of Depression in Pregnant and Postpartum Women: Evidence Report and Systematic Review for the US Preventive Services Task Force. Jama. 2016;315(4):388-406.
7. Smith-Nielsen J, Egmose I, Wendelboe KI, Steinmejer P, Lange T, Vaever MS. Can the Edinburgh Postnatal Depression Scale-3A be used to screen for anxiety? BMC Psychology. 2021;9(1):118.
8. Castro ECT, Martins Brancaglion MY, Nogueira Cardoso M, et al. What is the best tool for screening antenatal depression? Journal of affective disorders. 2015;178:12-17.
9. Kozinszky Z, Dudas RB. Validation studies of the Edinburgh Postnatal Depression Scale for the antenatal period. Journal of affective disorders. 2015;176:95-105.
10. Eysenck MW, Fajkowska M. Anxiety and depression: toward overlapping and distinctive features. Cognition and Emotion. 2018;32(7):1391-1400.
11. Levis B, Negeri Z, Sun Y, Benedetti A, Thombs BD. Accuracy of the Edinburgh Postnatal Depression Scale (EPDS) for screening to detect major depression among pregnant and postpartum women: systematic review and meta-analysis of individual participant data. BMJ (Clinical research ed). 2020;371:m4022.
12. Matthey S, Fisher J, Rowe H. Using the Edinburgh postnatal depression scale to screen for anxiety disorders: conceptual and methodological considerations. Journal of affective disorders. 2013;146(2):224-230.
13. Martin CR, Redshaw M. Establishing a coherent and replicable measurement model of the Edinburgh Postnatal Depression Scale. Psychiatry research. 2018;264:182-191.
14. Stasik-O’Brien SM, McCabe-Beane JE, Segre LS. Using the EPDS to Identify Anxiety in Mothers of Infants on the Neonatal Intensive Care Unit. Clinical Nursing Research. 2019;28(4):473-487.
15. Lautarescu A, Victor S, Lau-Zhu A, Counsell SJ, Edwards AD, Craig MC. The factor structure of the Edinburgh Postnatal Depression Scale among perinatal high-risk and community samples in London. Archives of women’s mental health. 2022;25(1):157-169.
16. Loyal D, Sutter AL, Rascle N. Screening Beyond Postpartum Depression: Occluded Anxiety Component in the EPDS (EPDS-3A) in French Mothers. Maternal and child health journal. 2020;24(3):369-377.
17. van der Zee-van den Berg AI, Boere-Boonekamp MM, Groothuis-Oudshoorn CGM, Reijneveld SA. The Edinburgh Postpartum Depression Scale: Stable structure but subscale of limited value to detect anxiety. PloS one. 2019;14(9):e0221894-e0221894.
18. Rivas-Vazquez RA, Saffa-Biller D, Ruiz I, Blais MA, Rivas-Vazquez A. Current Issues in Anxiety and Depression: Comorbid, Mixed, and Subthreshold Disorders. Professional psychology, research and practice. 2004;35(1):74-83.
19. de la Rosa IA, Huang J, Gard CC, McDonald JA. Examining the Prevalence of Peripartum Depressive Symptoms in a Border Community. Womens Health Rep (New Rochelle). 2021;2(1):210-218.
20. Hartley CM, Barroso N, Rey Y, Pettit JW, Bagner DM. Factor structure and psychometric properties of english and spanish versions of the edinburgh postnatal depression scale among Hispanic women in a primary care setting. J Clin Psychol. 2014;70(12):1240-1250.
21. Liu CH, Tronick E. Rates and Predictors of Postpartum Depression by Race and Ethnicity: Results from the 2004 to 2007 New York City PRAMS Survey (Pregnancy Risk Assessment Monitoring System). Maternal and child health journal. 2012;17(9):1599-1610.
22. Guintivano J, Manuck T, Meltzer-Brody S. Predictors of Postpartum Depression: A Comprehensive Review of the Last Decade of Evidence. Clinical obstetrics and gynecology. 2018;61(3):591-603.
23. Lara-Cinisomo S, Clark CT, Wood J. Increasing Diagnosis and Treatment of Perinatal Depression in Latinas and African American Women: Addressing Stigma Is Not Enough. Women’s health issues : official publication of the Jacobs Institute of Women’s Health. 2018;28(3):201-204.
Citation
Pentecost R, Williams M, Simonsen S, Sheng X, & Latendresse G. (2022). Anxiety Symptoms and Severity among Perinatal Women Screened for Depression with the Edinburgh Postnatal Depression Scale. Utah Women’s Health Review. doi: 10.26054/0d-03zy-rr24
Opportunities in Mixed Method Health Literacy Research Among Hispanic Women in Utah
Problem Statement
National and local news cycles often highlight health-related disparities of the Hispanic community. Underlying many of the reports is the important concept and impact of health literacy. Health literacy becomes important for caregivers and/or patients when faced with a situation that requires the ability to find, understand, and use health information and services. Health literacy among Hispanic women is particularly important to highlight because of the lack of available data and impact Low Health Literacy (LHL) can have on individuals and family units. Due to limited research literature regarding the Hispanic women population in Utah, information regarding health literacy needs and barriers is most likely inferred from larger studies or not available on open-source research systems. This commentary is meant to describe a problem while also promoting open-sourced mixed method research as a solution. Additionally, it is important to highlight the need for multidisciplinary collaboration in pursuance of innovative solutions to address the health literacy needs of Hispanic women in Utah.
Status of Literature
There is a known fluctuation of health literacy among individuals who are able to read well and are comfortable using numbers.1,2 Within the United States, researchers estimate limited English language proficiency among the Spanish speaking population, anywhere between 30– 51%3, Utah specific numbers are not conclusive at this time. Difficulties arise in situations where the caregiver and/or patient is not familiar with medical terms, how their body works, is unable to interpret statistics, and evaluate risks and benefits of treatment.1 Additionally, when faced with a with a serious diagnosis or illness, individuals with LHL may feel scared or confused during their healthcare experience.1 LHL puts Hispanic immigrants at a higher risk for low or no access to healthcare and healthcare services.4,5 Researchers believe this is due to a number of number of possible barriers such as low education levels, low English proficiency and/ or non-citizenship status which leaves Hispanic patients to assume they are ineligible for U.S. healthcare services, fear stigma, or deportation.5 Researchers also postulate LHL leads to difficulties interpreting spoken or written information6 which instigates outcomes such as high rates of return emergency room visits6,7, low medication adherence8, and misunderstanding of health insurance.9
Specifically within the Hispanic women community, researchers are concerned with LHL in association with chronic diseases such as cardiovascular disease and diabetes7,10. Past research suggests U.S. born Hispanic women are less likely to access mental health services, due to a persistent stigma in relation to mental health services and lack of health information understanding.11 Similar reports exist for other medical services.4 Utah-specific evaluation of LHL, health outcomes and women is available, but remains difficult to find via open-source search engines, data banks and journals.
Call to Action
Promoting health literacy among Hispanic women may seem difficult, but interventions such as community-based health education programs have proven effective in the past.4,5 Utah-based research is needed in order to understand where and what health literacy interventions could be used to increase health literacy rates among Utah Hispanic women. Currently there is limited open-sourced information available regarding health literacy among Hispanic women in Utah. Researchers concur that in order to improve health literacy among Hispanics further research is needed to better identify and explain health literacy gaps.4,5,7,10,12 Mixed method research is potentially a solution. 5,10 Specifically, after a systematic review of 77 Hispanic population-related studies the following topics were recommended as areas of possible mixed method research opportunities: 1. The influence of acculturation on migrant health ; 2. The role of informal (e.g., family) vs. formal (e.g. promotoras) social support in facilitating health care access; 3. The “Hispanic mortality paradox”; 4. Traditional healing and medicine among Hispanic immigrants.5
Along with academic research efforts to improve health literacy among Hispanic women, efforts within community structures and systems are also needed. The Center for Disease Control and Prevention promotes a multidisciplinary and collaborative approach known as “Health in All Policies” in order to integrate and articulate health considerations into policymaking decisions.13 Health researchers investigating Hispanic health literacy also ask for consideration of comprehensive health and immigration reforms that respect the human right of Hispanic immigrants to gain access to health care.5
References
1. CDC. The What, Why, and How of Health Literacy. Centers for Disease Control and Prevention. Published March 29, 2021. Accessed November 30, 2021. https://www.cdc.gov/healthliteracy/learn/Understanding.html
2. Millar RJ, Sahoo S, Yamashita T, Cummins PA. Literacy skills, language use, and online health information seeking among Hispanic adults in the United States. Patient Educ Couns. 2020;103(8):1595-1600. doi:10.1016/j.pec.2020.02.030
3. Sentell T, Braun KL. Low Health Literacy, Limited English Proficiency, and Health Status in Asians, Latinos, and Other Racial/Ethnic Groups in California. Journal of Health Communication. 2012;17(sup3):82-99. doi:10.1080/10810730.2012.712621
4. Becerra BJ, Arias D, Becerra MB. Low Health Literacy among Immigrant Hispanics. J Racial and Ethnic Health Disparities. 2017;4(3):480-483. doi:10.1007/s40615-016-0249-5
5. Pérez-Escamilla R, Garcia J, Song D. HEALTH CARE ACCESS AMONG HISPANIC IMMIGRANTS: ¿ALGUIEN ESTÁ ESCUCHANDO? [IS ANYBODY LISTENING?]. NAPA Bull. 2010;34(1):47-67. doi:10.1111/j.1556-4797.2010.01051.x
6. Easton P, Entwistle VA, Williams B. Health in the “hidden population” of people with low literacy. A systematic review of the literature. BMC Public Health. 2010;10(1):459. doi:10.1186/1471-2458-10-459
7. Ivanov LL, Wallace DC, Hernández C, Hyde Y. Diabetes Risks and Health Literacy in Southern African American and Latino Women. J Community Health Nurs. 2015;32(1):12-23. doi:10.1080/07370016.2015.991664
8. Association Between Health Literacy and Medication Adherence among Hispanics With Hypertension – PMC. Accessed June 24, 2022. https://www-ncbi-nlm-nih-gov.ezproxy.lib.utah.edu/pmc/articles/PMC6545226/
9. Villagra VG, Bhuva B, Coman E, Smith DO, Fifield J. Health insurance literacy: disparities by race, ethnicity, and language preference. Am J Manag Care. 2019;25(3):e71-e75.
10. Aponte J. General literacy and health literacy in Dominicans with diabetes. Hisp Health Care Int. 2013;11(4):167-172. doi:10.1891/1540-4153.11.4.167
11. Lopez V, Sanchez K, Killian MO, Eghaneyan BH. Depression screening and education: an examination of mental health literacy and stigma in a sample of Hispanic women. BMC Public Health. 2018;18(1):646. doi:10.1186/s12889-018-5516-4
12. Lorini C, Santomauro F, Donzellini M, et al. Health literacy and vaccination: A systematic review. null. 2018;14(2):478-488. doi:10.1080/21645515.2017.1392423
13. Health in All Policies | AD for Policy and Strategy | CDC. Published June 18, 2019. Accessed November 30, 2021. https://www.cdc.gov/policy/hiap/index.html
Citation
Tovar I. (2022). Opportunities in Mixed Method Health Literacy Research Among Hispanic Women in Utah. Utah Women’s Health Review. doi: 10.26054/0d-jp1z-dgwb
Gender-Based Violence as Structural Violence Among Sexual & Gender Minority Populations: Pilot Data from the University of Utah
Abstract
Objectives: To examine gender-based violence (GBV) against sexual and gender minority (SGM) women at the University of Utah as structural violence. A better understanding of GBV within SGM populations can improve prevention efforts and intervention, and advance further research.
Methods: This study utilized quantitative methods of data collection in the form a survey.
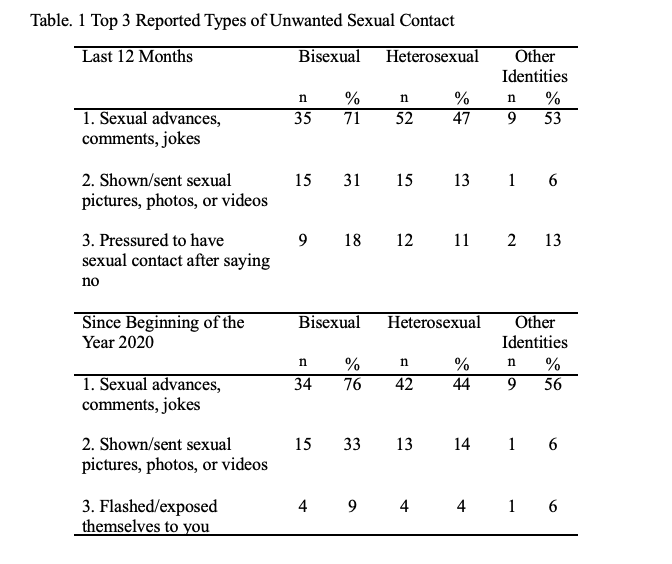
Results: This pilot study found that among University of Utah women responding to the survey (N = 211), bisexual women (n = 53) reported experiencing GBV at disproportionately higher rates than their heterosexual counterparts (n = 116) in the past 12 months (n = 14 [27%], n = 17 [15%] respectively). The most highly reported type of GBV were unwelcome sexual advances, gestures, comments, or jokes (n = 35 [71%], n= 52 [47]), followed by being shown or sent explicit photos or videos (n = 15 [31%], n = 15 [13%]) among bisexual and heterosexual students, respectively.
Conclusions: SGM women are at greater risk of experiencing GBV, as they are subject to additional factors characteristic of their marginalization. These factors interact at individual, interpersonal, and structural levels, influencing key health outcomes among SGM women.
Health Implications: Approaching GBV against SGM women as an issue of structural violence can facilitate a more comprehensive understanding and enhance efforts to address gaps in existing services and resources. In doing so, the emotional, physical, and social wellbeing of these marginalized populations can be improved.
Introduction
Estimates indicate that 1 in 3 women worldwide will experience gender-based violence (GBV) in her lifetime.1 Among women attending college, 26 percent of undergraduate and 10 percent of graduate students are targets of sexual assault and/or rape.2 Heteronormativity is implicit in this statistic in the historically and current view that heterosexuality is assumptive for both agents and targets of GBV. GBV is “violence directed at an individual based on his or her biological sex or gender identity. It includes physical, sexual, verbal, emotional, and psychological abuse, threats, coercion, and economic or educational deprivation, whether occurring in public or private life.”3 Women are more likely targets for GBV than men. In support of the idea that GBV as currently constructed is heteronormative, emerging data suggest that sexual and gender minority (SGM) women (e.g., bisexual, transgender, lesbian women) are at greater risk of experiencing GBV compared to their heterosexual counterparts. Some research has indicated that SGM women overall are 3.7 times more likely than heterosexual women to experience GBV.4 Other research suggests that bisexual women are 1.8 to 2.6 times more likely to experience GBV than heterosexual women.5 SGM women are also more likely to be targets of GBV by both women and men agents.5 In this pilot mixed-methods study, we examined the incidence and experience of GBV for SGM women at the University of Utah (UU), the state’s flagship public institution.
Methods
This pilot project used quantitative data collection in the form of a survey open to university community members. The UU’s Institutional Review Board (IRB) approved the project. Due to the pandemic, the university was largely operating remotely at this time. Because student life was disrupted during this phase of the study, data collection was negatively impacted. We present here a preliminary consideration of our findings.
Data Collection: Quantitative
The project began with the development of a quantitative data collection tool in REDCap, a research electronic data capture software, and took approximately 10 minutes to complete.6 The survey was composed of 52 questions based on the Draft Instrument for Measuring Campus Climate Related to Sexual Assault developed by the US Department of Justice7 as well as on Utah’s Behavioral Risk Factor Surveillance System (UT-BRFSS).8 Survey questions included items assessing sexual violence, eg, “In the past 12 months, has anyone HAD SEX with you or ATTEMPTED to have sex with you after you said or showed that you didn’t want them to or without your consent? (yes/no),” and intimate partner violence, eg, “During the past 12 months did an intimate partner push, hit, slap, kick, choke, or physically hurt you in any other way? (yes/no).”
Once the survey was constructed, we recruited participants from the UU from September to December 2020. We announced the study in a regular newsletter for medical and health students, staff, and faculty. We also distributed the survey link to colleagues in our professional networks at the UU and posted flyers at several campus locations. The total number of survey respondents was 211.
Analysis
Descriptive and frequency data from the survey are included here to capture perceptions about GBV in a higher education setting from respondents who identify as women on a university campus.
Results
Note: “Other Identities” refers to participants who identified as lesbian/gay, pansexual, or another sexual orientation not listed.
Table 1 shows descriptive statistics for the top 3 reported types of GBV experienced by heterosexual and bisexual women in the last 12 months, with the start date falling between September and December 2019, depending on when the survey was completed in 2020. The top 3 reported types of unwanted sexual misconduct were (1) unwanted sexual advances, comments, and/or jokes, (2) shown/sent unwanted sexual pictures, photos, or videos, and (3) sexual contact after saying “no.” It is worth noting participants reported experiencing the same top 2 forms of GBV since the beginning of 2020. The third-most frequently reported type of GBV experienced since the beginning of 2020 was being “flashed or exposed themselves to you without your consent,” which was different than findings for the last 12 months.The change in the third-most reported type of unwanted sexual violence from being pressured to having sex to being flashed by others may give insight into how the COVID-19 pandemic impacted unwanted sexual contact.
Strengths & Limitations
The study is limited by its small sample size, for which there are several reasons. The study took place after the COVID-19 pandemic had begun, which made it difficult to recruit participants. The volatile topic of the study may also have contributed to lower participation. These factors possibly contributed to a sample size that was not as robust as planned.
Responses to the survey gave us preliminary information about how SGM women experience GBV in a university setting. This data provides useful information for future studies. Additionally, we now have a better idea of how to recruit participants for our next study to allow for a larger sampling. Further exploration might examine how the COVID-19 pandemic has contributed to sexual and gender minority women’s experiences of gender-based violence. Qualitative methods of data collection may also yield substantial insights into these experiences.
Discussion
Sample characteristics for the 211 participants who completed the survey are shown in Table 2. Only 19 percent identified as non-White, while just under 20 percent identified as non-female assigned at birth, with the same percentage identifying their gender identity as women. Due to the small number of participants identifying as gay/lesbian or pansexual (5%), our survey findings primarily provide insight into how heterosexual and bisexual White women experience GBV at the UU. Participants who identified as lesbian/gay, pansexual, or another sexual orientation not listed in our survey were combined into “other identities” in Table 2.
Although it is easier to identify GBV at the individual level, GBV is an example of structural violence. In the effort to promote health equity for SGM populations, it is crucial to explore GBV against SGM women within the context of structural violence. Structural violence is defined as a “form of violence wherein some social structure or social institution may harm people by preventing them from meeting their basic needs.”9 The Health Equity Promotion Model (HEPM) (see Figure 1)10 provides a useful framework for understanding how GBV structural and individual factors interact to influence key mental and physical health outcomes among SGM women.
Reflecting the existing literature,11 our findings suggest that rates of GBV among bisexual women in Utah are higher than in heterosexual, cisgender populations. While heterosexual and cisgender women face many of the same risk factors for experiencing GBV,SGM women are subject to additional factors characteristic of their marginalization, such as discrimination, identity concealment, and social stigma.10,11 These stressors manifest and interact at structural levels, such as heterosexism, and individual and interpersonal levels, including targeting because of one’s non-heterosexual and/or non-cisgender identities. Such a cascade contributes to the greater likelihood that SGM women experience GBV and feel discouraged from seeking assistance.12
We typically examine GBV through a heteronormative perspective, depicting(heterosexual) men as perpetrators and (heterosexual) women as victims. Heteronormative assumptions about GBV are sustained at the structural level through institutional heterosexism.12Other structural elements manifest in the form of widespread social conditions and attitudes, such as stigma, exclusion, and erasure of SGM identities.12
Even if an individual knows cognitively that anyone can perpetrate or experience GBV regardless of their gender or sexual orientation, the occurrence of such can be difficult to identify if GBV is only recognized and validated in heterosexual, cisgender relationships. The lack of awareness regarding GBV against SGM populations is an ongoing, structural issue in terms of both the relevant literature and within the larger cultural consciousness. This results in GBV against SGM going both unnoticed and unaddressed, thereby further perpetuating the myth that it does not exist and simultaneously worsening its effects.
Positioning GBV against SGM women as an issue of structural violence invites opportunities for greater mobilization. Considering the various structural elements that contribute to GBV allows for exploration and acceptance of one’s personal responsibility for a societal issue. It also draws attention to shifting gender norms, the need for education about GBV in SGM populations, and the empowerment of girls and women across the lifespan.In this way, every person can take part in changing the environment to prevent GBV.
Health Implications
GBV manifests structurally via individual, social, and political attitudes and conditions.For example, legal definitions of GBV, discrimination from service providers, and a dearth ofLGBTQ+ specific resources result in fewer avenues for justice for SGM women.5 Current states’ legal definitions about domestic violence–a form of GBV–that exclude same-sex couples impede victim/survivor ability to pursue legal remedies.5 When GBV occurs in same-gender relationships and the individuals involved are of similar stature, police tend to assume equivalent power dynamics in the relationship, and all too often they arrest both parties, known as dual arrest.13 When the GBV incident involves physical violence, the dual arrest paradigm may preclude the actual target being able to access protections available through statute, while the GBV agent may use the dual arrest to attempt to convince theGBV target that they are also culpable for the violence. Such a dynamic may support and propagate a continuing cycle of GBV in SGM relationships.
One reason bisexual women may be at greater risk for GBV, and less likely to reach out subsequent to being targeted, is fear of disclosing their sexual orientation. Long-term concealment of sexual orientation has been linked to increased risk for depression and chronic health conditions.14 GBV is associated with a myriad of poor physical and mental health outcomes, including depression, post traumatic stress disorder, chronic illness, and sleep disorders.15,16 This links to 2 of the 7 domains of health: mental and physical health.17 The intersection of these 2 dynamics (identity concealment, poorer mental and physical health) may in part explain the disparately high rates of GBV that bisexual women experience.The top 2 reported types of GBV experienced at the college level by both bisexual and heterosexual participants were unwelcome sexual advances, gestures, comments, or jokes, and receiving unwanted sexual pictures, photos, or videos. This finding indicates that bisexual and heterosexual women in college may experience similar, specific types of GBV, and it highlights an opportunity for universities to develop resources aimed at addressing them. It is critical to keep the ubiquity of the experience in mind when developing resources and support on university campuses, as repeated university-wide announcements about specific incidences of GBV can contribute to secondary trauma. While inadvertent, such messaging can act to perpetuate GBV at an institutional level.
It is also important to consider the lack of resources and avenues for justice for those who experience technological forms of GBV. This absence is significant, as technological forms ofGBV (such as the sharing of explicit photos without consent) can have severe, lasting consequences for the affected individual, especially SGM.18 The victim-survivor may suffer great impacts to their psychological and emotional wellbeing; such impacts may be compounded if assistance for GBV does not recognize or competently address violence enacted through digital means. Certain types of technological GBV have impeded the victim-survivor’s ability to maintain employment, thereby affecting their financial health and stability.11
Continued research is necessary to gain a better understanding of GBV against SGM women as an issue of structural violence. Identifying other structural elements contributing to GBV can enhance efforts to address gaps in existing services and provide more comprehensive, competent resources for SGM populations.
4. Flores AR, Langton L, Meyer IH, Romero AP. Victimization rates and traits of sexual and gender minorities in the United States: Results from the National Crime Victimization Survey 2017. Science Advances. 2020;6(40):1-10. doi:10.1126/sciadv.aba6910.
5. Brown TNT, Herman JL. Intimate partner violence and sexual abuse among LGBT people: A review of existing research. 2015. Accessed September 30, 2021. https://williamsinstitute.law.ucla.edu/wp-content/uploads/Intimate-Partner-Violence-and-Sexual-Abuse-among-LGBT-People.pdf
6. Harris PA, Taylor R, Thielke R, Payne J, Gonzalez N, Conde JG. A metadata-driven methodology and workflow process for providing translational research informatics support. Journal of Biomedical Informatics. 2009;42(2):377-381.
8. Behavioral Risk Factor Surveillance System Questionnaire. Utah Department of Health, Office of Public Health Assessment. 2016. Accessed 2019. https://opha.health.utah.gov/wp-content/uploads/2020/12/2016-Utah-BRFSS.pdf
9. Sinha P, Gupta U, Singh J, Srivastava A. Structural violence on women: An impediment to women empowerment. Indian Journal of Community Medicine. 2017;42(3):134.
10. Fredriksen-Goldsen KI, Simoni JM, Kim H-J, et al. The health equity promotion model: Reconceptualization of lesbian, gay, bisexual, and transgender (LGBT) health disparities. American Journal of Orthopsychiatry. 2014;84(6):653–683. doi:10.1037/ort0000030.
11. Edwards KM, Sylaska KM, Neal AM. Intimate partner violence among sexual minority populations: A critical review of the literature and agenda for future research. Psychology of Violence. 2015;5(2):112-121. doi:10.1037/a0038656
12. Scheer JR, Martin-Storey A, Baams L. Help-seeking barriers among sexual and gender minority individuals who experience intimate partner violence victimization. In: Russell B, ed. Intimate Partner Violence and the LGBT+ Community: Understanding Power Dynamics. Springer; 2020:139-158.
13. Masri A. Equal rights, unequal protection: Institutional failures in protecting and advocating for victims of same-sex domestic violence in post-marriage equality era. TulaneJournal of Law & Sexuality. 2018;27:75-90.
14. Hoy-Ellis CP, Fredriksen-Goldsen KI. Lesbian, gay, & bisexual older adults: Linking internal minority stressors, chronic health conditions, and depression. Aging and Mental Health. 2 Apr 2016:1-10. doi:10.1080/13607863.2016.1168362
15. Lutwak N. The psychology of health and illness: The mental health and physiological effects of intimate partner violence on women. The Journal of Psychology. 2018;152(6):373-387.298. doi:10.1080/00223980.2018.1447435
16. Dillon G, Hussain R, Loxton D, Rahman S. Mental and physical health and intimate partner violence against women: A review of the literature. International Journal of Family Medicine. 2013;2013:1-10. doi:10.1155/2013/313909
17. Frost C, Murphy P, Shaw J, et al. Reframing the view of women’s health in the United States: Ideas from a multidisciplinary National Center of Excellence in Women’s Health Demonstration Project. Clinics in Mother and Child Health. 2013;11(1):1-3. 305 doi:10.4172/2090-7214.1000156
18. Powell A, Henry N, Flynn A. Image-based sexual abuse: An international study of victims and perpetrators. Summary report. 2018:1-17. doi:10.13140/RG.2.2.35166.59209
Citation
Powell DK, Younce B, Gren LH, Hoy-Ellis CP, & Frost CJ. (2022). Gender-Based Violence as Structural Violence Among Sexual & Gender Minority Populations: Pilot Data from the University of Utah. Utah Women’s Health Review. doi: 10.26054/0d-nym1-7vr1
Scholar Sarah Deer illuminates how the Colonial legal system has failed Native communities due to patriarchy and oppressive structures that condone violence, perpetuating the oppression of marginalized communities.
Domestic violence is the willful intimidation, physical assault, battery, sexual assault, and/or other abusive behavior as part of a systematic pattern of power and control perpetrated by one intimate partner against another. It includes physical violence, sexual violence, psychological violence, and emotional abuse. The frequency and severity of domestic violence can vary dramatically; however, the one constant component of domestic violence is one partner’s consistent efforts to maintain power and control over the other (NCADV n.d.)
Severe forms of human trafficking are: Sex Trafficking – The recruitment, harboring, transportation, provision, obtaining, patronizing, or soliciting of a person for the purpose of a commercial sex act which is induced by force, fraud, or coercion, or in which the person induced to perform such act has not attained 18 years of age; or Labor Trafficking: The recruitment, harboring, transportation, provision or obtaining of a person for labor or services, through the use of force, fraud or coercion, for the purpose of subjection to involuntary servitude, peonage, debt bondage or slavery (USA 2020).
Indigenous people are Native people’s to a land. Indigenous may also include other Native peoples from other contexts who have settled on other lands.
LGBTQIA+ is a term to refer to people who are Lesbian, Gay, Bisexual, Transgender, Intersex, Asexual, Queer and other sexually and gender diverse communities.
Native American / Alaskan Native comprises of the indigenous peoples of the North American continent, commonly referred to as the United States, and also in other contexts as Turtle Island.
People of Color is a complex term to refer to racial and ethnic minoritized communities such as Asian American, Black, African American, Hispanic, Latino/a/x, Pacific Islander, and Mixed Race or multi-racial people.
Sexual violence is an all-encompassing, non-legal term that refers to crimes like sexual assault, rape, and sexual abuse (RAINN 2022).
Introduction
The purpose of the Utah State Wide Needs Assessment is to understand the extent to which resources are available to address domestic violence/intimate partner violence, human trafficking, and sexual violence in Utah:
Services available to assist survivors and victims of domestic violence/intimate partner violence, human trafficking, and sexual assault in Utah, particularly in underserved communities (including outreach, direct services, housing, prevention, and culturally relevant services).
Estimation of the types and extent of survivor needs, including in underserved communities.
Assess for the presence and extent of gaps pertaining to geographic location (rural and urban), service type, and accessibility, including underserved communities.
The study addresses the needs of survivors of domestic violence (DV), sexual violence (SV), and human trafficking (HT) in Utah. The study takes place in Utah which has a population of 3.3 million people, and is growing rapidly in size and diversity. 14.4% of the state are Hispanic/Latino, 2.7% are Asian, 2.6% are two or more races, 1.6% are American Indian/Alaskan Native, 1.5% are Black/African American, and 1.1% are Native Hawaiian or Pacific Islander.
There is a need to respond to violence in the state of Utah. The overall perception of domestic violence, sexual violence and human trafficking in Utah are that conditions have worsened, the physical violence has become even more deadly. While participants of this study described a growth in local response, they illuminated how silence and the culture of Utah continues to create challenges for survivors.
Data from the Utah Department of Health has shown that one in four adult homicides are domestic violence-related, and that 1 in 10 males or 2 in 11 females will experience interpersonal violence. In 2018, a report from the Utah Department of Health showed that intimate partner violence (IPV) affected 18.1% of adult females and 10% of adult men (Utah Department of Health 2018). And 37% of transgender people will experience domestic violence in their lifetime (Peitzmeier et al., 2020). The same report indicated that less than 15% of Utahns who experienced IPV sought help for it. And between 2018 and 2019, there were 72 cases of strangulation identified related to domestic violence in Salt Lake City alone (Fukushima et al., 2020). Homicide is more likely for victims who experience strangulation by 750%.
Across the state of Utah, domestic violence organizations conduct a Lethality Assessment Program (LAP). Between 2016 and June 2021, 24,202 LAP screenings were conducted. It was found during the last two years of LAP screenings that 3,653 cases faced high danger (Utah Domestic Violence Coalition 2022).
Similar data shows that rape is the only violent crime in Utah with a rate higher than the national average. Research conducted by Dr. Melton illuminates that 40% of CODIS (Combined DNA Index System) hits are serial offenders. RAINN conveys that 1 in 6 women experiences sexual violence in her lifetime (n.d.).
Human trafficking is under-reported and more difficult to identify. In 2020, there were also 182 victims of human trafficking identified in the state from the National Human Trafficking Hotline (n.d.) and 1,413 cases 2017 to 2020.
Although victims of domestic violence, sexual violence, and human trafficking experience these forms of abuse specifically, they oftentimes may intersect in the form of polyvictimization where a survivor may experience multiple forms of abuse in their lifetime.
This report reflects the tip of the iceberg. There is limited data on domestic violence, sexual violence and human trafficking in Utah and how minoritized populations are impacted by violence. Additionally, there is a lack of comprehensive studies on American Indian and Alaskan Native communities, and much of the data represents national studies. Therefore, this study represents what Sonia Salari refers to as the iceberg effect of maltreatment, where what is known is the tip of the iceberg and there is so much unknown, and many survivors who experience violence that goes under-reported.
The “culture leads to victim-blaming quite honestly. I think that survivors oftentimes feel a lot of self-blame, which then can go into feelings of shame, which really we know mental health-wise, what those feelings of shame affect people so negatively… [Utah] culture also is less likely to believe survivors when they come forward… when we look back historically at rape laws or domestic violence laws, they stem back to times when women were seen as property; and because they were seen as property, that led to those first rape laws really being that they had to actively resist… we still see that bleeding through in our culture” – Nurse
“So, what has happened over these last three decades has absolutely changed how we do things. The problem is we still have so much violence. It hasn’t ended… We need to make sure that what we do is effective. Because frankly we can do harm.”- Lawyer
Methods
Previous statewide needs assessments focused on domestic violence service providers and human trafficking noted similar areas necessary to improving response within Utah. Gezinski (2017) recommended specific steps to be taken within each section (funding, education, legal services, community, continued research), including outcome measurement and conducting a statewide assessment every 3-5 years. Fukushima et. al. (2018) recommended long-term comprehensive service provisions, coordinated community response, increased outreach to identify vulnerable populations, survivor leadership, as well as facilitating local education and awareness efforts. After multiple conversations with local organizations – the Utah Domestic Violence Coalition, the Utah Coalition Against Sexual Assault, Restoring Ancestral Winds, and DCFS, it was established that a state-wide needs assessment be conducted under the leadership of the Principal Investigator (Dr. Fukushima) and the Gender-Based Violence Consortium. A needs assessment is defined by Peterson and Alexander (2001) as “the role of needs assessment is to identify and also address needs.” It is a “tool for determining valid and useful problems.” Overall, a needs assessment is a “collection of data bearing on the need for services, products, or information.” The research team will conduct a mixed methods study to further understand the needs for service provision surrounding domestic violence, human trafficking and sexual assault. The Utah State-wide Needs Assessment employs mixed methods which triangulates qualitative and quantitative data collection. The methodology for this study involves survey distribution (N=293), followed by focus groups and/or interviews (N=41) with experts of domestic violence, sexual assault, and/or human trafficking. Data collection occurred between July and December 2021. Recruitment occurred after IRB approvals (IRB_00141188) online via social media and emails. Focus groups and emails were conducted remotely utilizing Zoom. Data collection occurred between July 2021 until May 2022.
Participants
293 individuals participated in the online survey and 41 individuals participated in focus groups and interviews. Participants were professionals with a wealth of experience working on domestic violence, sexual violence or human trafficking with an average year of experience for survey participants being 9.5 years and 11 years for interviewees and focus group participants. Expertise by types of violence varied with the highest of expertise in domestic violence (n=216), sexual violence (n=165), and child abuse (n=124). Of the 283 participants who disclosed their range of professional identities, the highest representation was with advocates (20%), mental health providers (18%), administrator/executive director/director (14%), and medical providers (8%), with participants identifying in smaller numbers as prevention and education (5%), victim service provider (5%), case manager/supervisor/manager (4%), housing provider (4%), receptionist/secretary (2%), researcher/analyst (2%), volunteer (2%), child welfare (1%), legal provider/lawyer (1%), outreach (1%), law enforcement (1%), social service provider (1%), and less than 1%: religious leaders and media/marketing. Survey participants were 89% female identifying with smaller participation from male and gender-nonconforming participants, 82% heterosexual with 19% identifying as Lesbian, Gay, Bisexual, Asexual or Queer, with diverse racial participation with Asian and Hispanic / Latino slightly lower than the Utah population, and White over-represented, with other racial minorities in parity with Utah population. Survey Participants were able diverse with 17% identifying with living with a disability.Interviewees and focus group participants were predominantly women (95%), and heterosexual (80%), with smaller participation from men (5%) and Lesbian, Gay, Bisexual or Queer (20%), and were closer to parity with Utah racial demographics, with larger participation form Alaskan Native/American Indian (5%). Participants were also geographically diverse. Although a large number were from Salt Lake County, participants also joined from southern, northern and eastern Utah. Additionally, 47 participants identified as survivors.
Community Perceptions
Misperceptions about domestic violence, sexual violence and human trafficking persist. Nearly 4 in 10 of the surveyed participants believe that the community believes that: domestic violence and sexual violence do not occur very often and that trafficking never occurs. Regardless of the perception that violence is not occurring very often or at all, there is a need to raise awareness about violence in Utah.
Marginalized Communities
In order to be effective at responding to violence, it is essential that governmental and nongovernmental responders address the response for the most marginalized in communities. There are a variety of marginalized communities, where this study brings to the fore specific communities and people:
American Indian / Alaskan Native communities
Communities of Color: Black, Latinx/a/o/Hispanic, Asian, and Pacific Islander
There are 8 federally recognized tribes in Utah: Confederated Tribes of the Goshute Reservation, Navajo Nation, Northwestern Band of Shoshone Nation, Paiute Indian Tribe of Utah, San Juan Southern Paiute, Skull Valley Band of Goshute, Ute Mountain Ute Tribe, Ute Indian Tribe. Restoring Ancestral Winds is a tribal coalition that addresses stalking, domestic, sexual, dating, and family violence. RAW collaborates with UDVC and UCASA, Rape Recovery Center, as well as providers funded by DCFS work to support survivors of domestic violence, sexual violence, and human trafficking. Also, RAW has partnerships with the Strong Hearts Native Helpline and the National Indigenous Women’s Resource Center. In 2021, Gentle Ironhaw Shelter opened in Blanding to house domestic violence survivors.
Domestic violence is deadly for Native people where four out of 5 Native women and girls are affected by violence with homicide rates 10 times the national average. And 1 in 3 Native women are raped in their lifetime. Utah is the 10th most dangerous place for Native peoples, with the highest numbers of missing and murdered indigenous women, girls and two-sprit cases (Lucchesi and Echo-Hawk 2018). Additionally, there is a need to address non-Native violence against Native people, where 80% of abusers are non-Native people.
There has been an increase in partnerships between Utah governmental representatives and Native leaders. In 2020, a Missing and Murdered Indigenous Women task force was created, with representatives of Restoring Ancestral Winds. While there is a wealth of expertise, knowledge and desire to support Native communities, the AI/AN are truly under-resourced financially, where in the diverse tribes, there may be only one officer to investigate a region or one advocate to support survivors.
Although there are 574 federally recognized tribes, the diverse native communities continue to experience homogenization. Additionally, the rurality of tribal communities, means that survivors oftentimes traverse long-distances to have their needs met, distances that they do not have resources to travel or it may impact the ability for the survivor to engage with services if they are also parenting. For Native survivors accessing services, there is a need to increase education and awareness of serving diverse cultures. Participants described Native survivors experiencing re-traumatization when accessing resources with governmental and non-governmental agencies. Culture is incredibly important when responding to the needs of Native survivors. One interviewee described how justice responses to Native survivors might sometimes include advice, recommendations or processes that go against Native beliefs. There is a need to provide culturally aware services that work in collaboration with funding Tribal communities to provide the expertise and services. The Urban Indian Health Center was lauded as a model. Many Native leaders would like to support non-Native organizations, however, they are under-resourced in people and time to lend their expertise to other organizations. Therefore, there needs to be two-fold forms of resourcing occurring for Native communities: 1) increasing funds to Native organizations and 2) diversifying recruitment in organizations to actively recruit Native experts. Additionally, federal funds have been utilized to support traditional ceremonial forms of healing as a means to foster culturally aware responses to violence – this is highly recommended that such resourcing is supported.
Recognizing that there are different mechanisms of reporting of violence, this impacts what is known about Native communities. Some tribal communities report to SANE nurses, where information and reporting is centralized with Public Health Services. Or others are working with American Indian Health Services. Some data surrounding violence against American Indians and Alaskan Natives focuses on domestic violence, excluding sexual violence. Additionally, Indian nation is fluid and broad, which means that Native communities may be accessing non-native services.
As an agency, we are actively working upon fostering that relationship with our tribal community. And we know we have failed in some places–we know it–and it is something that we have become very aware of… And especially with the Gabby Petito case, we’re like, “Wait a minute. That is a tragedy that happened, but what about all these other people that are from our community that we didn’t even know that they were missing? Why don’t we know that?” – Advocate
Communities of Color
Black, Latinx/a/o/Hispanic, Asian, and Pacific Islander
Utah is increasing in diversity with a population increase between 2010 and 2020 of 17.4% (Clair 2020). Although Utah is growing in diversity, an ongoing concern is how to support the racially and ethnically diverse communities that experience domestic violence, sexual violence and human trafficking. Although organizations such as Comunidades Unidas, Pik2AR, Utah Coalition Against Sexual Assault Spanish language-line, Asian Association of Utah, and coalition members support survivors regardless of race, there is a need to address race and ethnicity in Utah. Color-blind racism is the norm in Utah, where people do not “see race.” However, “We cannot un-will ourselves to un-see something that we’ve already seen.” Race is a powerful social identity, where diverse and culturally aware responses to violence are much needed in the state. Survivors are hesitant to access services due to the perception of resources being for “whites” or unable to accommodate diverse communities. Additionally, there is a need to provide specialized services and groups for diverse communities to grapple with how there are layers of oppression that they experience due to violence, when seeking out services/resources, and when attempting to leave or heal from violence or abuse. As data shows, communities of color are being impacted by domestic violence and sexual violence at a greater rate than their white counterparts. Communities of color are a central factor that impacts who is more likely to experience being trafficking where communities of color are disproportionately represented in sexual economies, and in effect vulnerable to trafficking (Butler 2015; Fukushima 2019). This does not make communities of color more violent, but rather, highlights the ongoing impacts of structural violence and decades-old discriminatory policies, like redlining, on communities of color that also exacerbate conditions of abuse.
Immigrant Communities
“We have seen more folks that are refugee status or identify as refugee… that community… also needing much more support… And also a cultural response to what their experience of that, not only sexual violence, but all the things that contribute to like how they’re feeling right now with all the trauma they’ve endured and witnessed too.” – Clinical Director “The need… it’s about funding. I would love to be able to have a bilingual therapist; I would love to be able to have support groups in Spanish and be able to just really, again, following with that trauma-informed care be able to provide our clients, no matter where they come from, the best services and the most informed services.” – Advocate
Utah refers to itself as a “welcoming,” conveying that there are efforts in support New Americans who welcome. 9% of the Utah population is immigrant (American Immigration Council 2020). Immigrant communities include US diasporas who are also indigenous (for example, Native people whose peoples are not traced to the Utah region), refugees, asylum seekers and migrant laborers. The top national origins in Utah are Mexican, Indian, Venezuelan, Peruvian, and Canadian. 140,517 people in Utah lived with at least one undocumented family member. And 1 in 9 Utah workers are immigrant. Immigrants are found laboring in a range of industries, with higher representation in building and grounds maintenance, construction/extraction, farming/fishing/forestry, production, and food preparation and serving. These industries are also the same industries where trafficking is more likely to occur. The Violence Against Women Act and Trafficking Victims Protection Act include protections for immigrant survivors of violence, where they are able to access services and immigration relief. However, despite the resources available to immigrant communities, they continue to face a range of barriers including: staying in abusive conditions due to fear of law enforcement, lack of multi-lingual services, and an absence of culturally responsive resources to new comers who experience violence. Although UCASA and COLAVI (Colavi: La Coalición Latina En Contra De La Violencia Intrafamiliar) provide support in Spanish, Spanish is just one of the many languages preferred by people from Latin America, and even a second language for people whose preferred language are Zapotec, Mixteco, Quechua, Guarani, among the many languages spoken in Latin America, which it is estimated that 560 indigenous languages are spoken in Latin America (Existe Ayuda, n.d.). Language access and immigration relief are central to supporting immigrant survivors of violence.
Over 1 in 2 of the surveyed believe survivors fear calling the crisis-line due to their legal status and over a third found crisis-line insufficient due to there being no interpreter/translation provided. Fear due to their legal status is also a barrier for immigrant survivors accessing housing, when seeking legal services, and when reporting crimes to law enforcement. Nearly half of the participants also believe that survivors do not seek out medical services due to fear about their legal status. And 1 in 2 believe that survivors are unable to have their immigration needs.
LGBTQIA+
“We actually don’t see a lot of trans folks in our center from what my experience would have seen, and I think that’s like an area that we’re trying to focus on as well, it’s like how can we better train ourselves and create a space for survivors that are trans[gender] to be able to feel comfortable enough to receive services from us and if not, who can we refer to that would be a better fit?” – Therapist “Homeless youth that we’re dealing with that are transgender and LGBTQIA they feel more marginalized in the community… There aren’t safe spaces for them… It’s not safe, it’s more trauma… In jail, prison, and in detention facilities they’re not affirmative. We’re not training spaces where harmed LGBTQIA show up to be affirmative. So, it’s just another place where there’s more trauma and more abuse and more vulnerability. I just had a transgender female come out of the male side of the prison. And she was supposed to complete an inpatient program on the men’s side of the prison where she was being sexually harassed, almost assaulted by other prisoners and being shamed by the officers… Where are the safe spaces for an LGBTQIA child of color that’s fleeing a home where they reject him or her and then they show up at a space where they can be trafficked?” – Government worker
Lesbian, Gay, Bisexual, Transgender, Intersex, Queer survivors of violence experience a range of violence that are higher rates than their heterosexual counterparts. While it is estimated that 35% heterosexual women will experience, rape, physical violence or stalking by an intimate partner in their lifetime, for gay men it is 26%, for lesbian it is 44%, and 61% for bisexual women (NISVS 2010). And while it is estimated that 1 in 5 women and experience sexual violence in a lifetime (CDC 2021), the rates for transgender people is nearly 1 in 2 (HRC Foundation 2021).
Similar to communities of color, LGBTIQ survivors of violence continue to feel that there are not enough safe spaces for them. And that overall, LGBTIQ+ community members continue to have lower rates of help-seeking due to a range of concerns with being “outed” or experiencing discrimination (NCAVP 2016; Barker 2022). Particular areas of need and barriers for LGBTIQ+ is with accessing housing and healthcare (Belknap et al., 2009).
Disability
6.8% of Utahn’s live with a disability, and 11% of those living with a disability are uninsured. There are a range of challenges that are faced in addition to experiencing violence. Participants described how it was difficult to put people into boxes that are required for disability services. It is common for domestic abusers to threaten the safety of animals to compel survivors to stay in abusive conditions. Although HB175 expands protective order protections for animals, there exist a range of disabilities that impact survivors of violence beyond emotional animal assisted services. People living with a disability have a higher prevalence of abuse, and are three times more likely to be sexually assaulted compared to peers without a disability (NCADV 2018b) with other studies conveying that people living with a disability are 7 times more likely to experience sexual assault (Shapiro 2018). And 40% greater chance of experiencing intimate partner violence. A review of 54 cases in Florida found that 28% of human trafficking involved individuals with intellectual disabilities (Nichols and Heil 2022).
“There’s so little awareness about the [number] of women with disabilities who are assaulted… I think when people think of disabilities, they may think of someone in a wheelchair with a severe cognitive disability. But we’re talking about women with autism, brain injuries, and men, they’re in the jails. They are the people on the streets as well. So, just recognizing that disability spans across all of our areas and we all are kind of responsible for making sure that awareness is out there.” – Government worker
Services & Response
Change
There are 21 organizations that provide services to survivors of sexual violence and 26 organizations to survivors of domestic violence. Oftentimes these organizations are providing services for multiple types of abuse. And human trafficking responses is coordinated through the Utah Trafficking in Persons Task Force. During the past year, 83% of the participants described how their organizations experienced change, with the most change with regards to adapting to the global pandemic, new staff, loss of staff, and decrease in funds/revenue.
In the past 5 years there were a range of positive changes including how the #MeToo movement led to more visibility surrounding sexual violence, there seems to be a shift away from silence in Utah, collaborations are growing, and pandemic created more flexibility to support survivors of violence and responders.
Although there were positive changes, negative changes included increase in complexity of cases, increase in fear of lethality, technological/digital divide, and the response unable to keep up with the growing numbers of survivors.
Barriers
Survivors in Utah face a range of barriers, that impact their ability to access services. In particular, they fear their abuser, do not want their abuser to get into “trouble”, lack knowledge about resources, lack financial resources to leave, or are unable to leave due to child care for children.
Survivors in Utah face a range of barriers, that impact their ability to access services. In particular, they fear their abuser, do not want their abuser to get into “trouble”, lack knowledge about resources, lack financial resources to leave, or are unable to leave due to child care for children.
There are not enough resources to survivors. Over 4 in 10 of respondents do not believe there are enough to support survivors of domestic violence. Over half of respondents do not believe there are enough resources to support survivors human trafficking. And nearly 4 in 10 of respondents do not believe there are enough resources to support survivors of sexual violence.
Despite the wealth of knowledge and years of expertise, 1 in 2 of respondents thought about leaving their organizations because of feeling overwhelmed or overworked, desires to earn more money or receive better benefits, lack of support from leadership, the organization’s culture, or trauma from their work.
Nearly 1 in 2 of the participants have thought about leaving their organizations.
Needs
The top five needs for survivors of domestic violence, sexual violence and human trafficking: housing, financial support, emotional support, mental health, and family support.
5 Top needs for survivors of violence:
Housing
Financial support
Emotional support
Mental health
Family support
Crisis Line
Survivors of sexual violence, domestic violence and human trafficking need to know where to call to reach out for help. The top reasons why survivors call a crisis-line is because they are seeking safety, they need emotional support, or assistance with urgent needs such as housing, medical, and other needs. Current challenges faced by crisis-line services are that survivors are unaware of the crisis-line, survivors fear calling due to their legal status, the crisis-line needs more staff support, survivors are denied services/support due to eligibility requirements, or there was no interpreter/translation provided.
Housing
A majority of the participants believe that housing for survivors of sexual violence, domestic violence and human trafficking are insufficient. And 4 in 10 believe that housing is inaccessible. The top five barriers survivors face when accessing housing is that there are either not enough beds or housing options. Housing options are unaffordable to survivors. In the past year, housing in Utah increased by 3.8%. For survivors of violence the inability to afford housing may impact their ability to leave abusive conditions or heal from the violence they experienced. The limited options for housing in Utah and restrictions with funding also means that survivors may be considered ineligible for housing. Survivors may also be unaware of housing services. And for immigrant survivors, although Utah is welcoming to migrant community, those whose traffickers or abusers used their legal status to compel them to stay in abusive conditions means that survivors are also afraid of authorities due to their legal status.
Utah’s strong owner rights have led victims who are renters and call law enforcement for safety, to experience consequences – landlord evictions for “disturbing the peace.” In addition to being uprooted from their homes, survivors who are forced to evict under these circumstances face a range of additional barriers of not receiving their deposit back for breaking the lease (Peterson et al., 2021).
Transportation
Transportation came up regularly during the interviews and focus groups. Participants described how lack of transportation or the inability to travel long distances to services, impacts survivors. Although there are resources in all parts of Utah, for survivors in rural settings finding their way to services is not always easy, and may add further stress.
Medical
Medical services are essential and a basic need from physical to mental health needs. Survivors of IPV accrue higher costs compared to non-survivors due to immediate aftermath of violence as well as long-term issues (Mclean and Bocinski 2017). The lifetime costs for survivors of rape is estimated $122,461 per victim (Peterson et al., 2017). Trafficking survivors are accessing healthcare while being trafficked, with 68.3% being seen at the emergency room (Lederer and Wetzel 2014). In the aggregate, respondents of this study top five reasons survivors of violence sought out medical services due to needing urgent care, substance use treatment, primary care, care for another family member, or to receive reproductive services. While there are many medical needs, survivors continue to face barriers due to their lack of health insurance, the costs associated with medical care, they are unaware of medical services, fear service providers due to their legal status, and experience bias or discrimination from medical providers.
Justice & Law
Domestic violence is a misdemeanor and law enforcement are required by law to use reasonable means to protect victims and prevent further violence (Utah Code sections 77–36–2.1 & 2.2). The top five reasons that survivors reach out to law enforcement are for safety/protection, filing a complaint, aiding in an investigation, criminal system related issues, or probation. For sexual violence survivors, only 1 in 10 of sexual assault cases end in a conviction with people of color three times as likely to be charged in contrast to a white perpetrator (Jacobs 2021). Survivors face a range of barriers when reporting to law enforcement including being fearful of law enforcement due to their legal status, experiencing maltreatment from law enforcement, bias and discrimination from law enforcement, being denied support, and racial profiling.
In addition to enforcement, survivors of violence have a range of legal needs. This includes protective orders, restraining orders, custody of a child, divorce, legal needs related to domestic violence and prosecution of their abuser. After reporting to law enforcement, legal needs continue to be unfulfilled because they are expensive, survivors are unaware of services, there is a need for more providers/staff, fear of services due to their legal status, and survivors were denied support/services. Filing protective orders can be a lengthy process for survivors. And abusers violate protective orders (Gillis 2021), and take advantage of the system by finding ways to block survivors from receiving protection or representation. 1 in 2 of the participants believe that survivors are unable to have their immigration needs met. Overall, survivors of violence have varying perceptions of justice – for many of the interviewees participants described the need for more education as justice and transformative forms of justice that do not rely on the criminal legal system that is intended to be healing for all with accountability (Mingus 2022). A transformative justice question is by focusing response on: what do survivors and people who have caused harm need?
Campus Response
Universities and educational environments are an important site of prevention. However, current challenges have emerged on campuses despite Title IX resources and processes. These challenges have included:
Inability to support students after the student transfers from another institution
Difficulty of victim confidentiality; conflicts with mandated reporting
Polyvictimization (i.e., stalking, domestic violence, sexual assault intersecting)
Difficulties reporting
Desire for institutional accountability
International students are not entitled to the same support/benefits
Although it appears that some institutions are on the decline with rape or fondling reporting, it is unclear if rape and other forms of assault are on the decline or if victims are not reporting. Additionally number of incidents is not indicative of campus severity – it only illuminates that reporting is occurring.
Campus programming in university settings during domestic violence awareness month (October) and sexual violence awareness month (April) has increased discussions about violence and in effect, campus reporting.
Violence Prevention
Violence prevention in the state of Utah encompasses a state-wide conference on domestic violence (organized by the Utah Domestic Violence Coalition in September or October (in collaboration with Utah Association of Domestic Violence Treatment), annual state-wide conference on sexual violence during the month of March (organized by UCASA), and an annual symposium on human trafficking organized by the University of Utah and the Utah Trafficking in Persons Task Force (in January). During the month of October DVAM (Domestic Violence Awareness Month) activities are ongoing throughout the month. Additionally, Sexual Assault Awareness Month has led to a robust amount of activities including most recently Denim Day at the Capitol Hill on April 27, 2022. And in 2021, Stop the Violence Utah was created to foster a state-wide campaign (https://stoptheviolenceutah.org/). State-wide coalitions, local nonprofits, academic institutions, continue to invest time and energy into organizing educational content on domestic violence, sexual violence and human trafficking. However, these endeavors are under resourced and education in primary education limited. Primary education on domestic violence continues to put onerous on victims to affirmatively refuse, instead of teaching consent (Villarreal and Evelyn 2021). The primary need to foster more education and prevention is to fund these endeavors, support education and prevention in rural settings, provide more resources to organizations to staff prevention and education, foster relationships between community and organizations, and continue to make opportunities visible.
The priority areas for violence prevention in the state of Utah, based on needs:
Increase funding to prevention efforts
Increase awareness in rural communities
Increase campaigns targeted at increasing survivor awareness
Increase ins staff/providers dedicated to prevention and education efforts
Build community partnerships to foster trust between organizations and the community’s served.
Recommendations
Recommendation 1: increase monetary resources to respond to marginalized communities
Alaskan Native/American Indian, People of Color, LGBTQIA, immigrant, and people living with disabilities continue to experience being under-deserved. In order to support dynamic communities, have complex cultural, social, and linguistic needs, organizations need more resources to house, provide programming, offer culturally relevant services, and hire multilingual staff.
Recommendation 2: Systematic data collection & centralized information sharing
Currently there is no centralized mechanism for data collection to track survivor needs overtime. Additionally, while there are coalitions that collect some information and reporting is required for DCFS funded entities, the public sharing of data to inform communities on progress and resourcing survivors is much needed. Resourcing the coalitions to hire staff to manage data and to share across coalitions in de-identified way will help not only support survivors, but also assist the various collectives in moving forward with a response that is data driven.
Recommendation 3: Culturally aware responses and trauma-informed response
There is a need to foster culturally aware and trauma-informed services and response. There are multiple promising models that it would benefit the state to invest in to respond to domestic violence, sexual violence and human trafficking. These models include: trauma-informed systems, housing first, human rights, theory driven responses (i.e., feminist multicultural / critical race theory / indigenous epistemologies), and community coalition and partnerships. What came through in the interviews and surveys is the need for translation and the strength of culturally responsive services.
Acknowledgements
The research team is incredibly thankful for the resources and support provided by the Utah Domestic Violence Coalition. In addition to a partnership with UDVC, the research team worked to promote the study through the informal support of the Restoring Ancestral Winds, Utah Coalition Against Sexual Assault, and the Department of Family and Children Services. The report is authored by the Principal Investigator, but is in gratitude to the undergraduate researchers that supported the study by recruiting participants and assisting with the qualitative data. In particular much appreciation to Mikaila Barker, who was so instrumental to the project in the IRB application, recruitment and analysis. Additional appreciation to undergraduate researchers: Tony (Liu) Chen, and Mariah Montoya. And much gratitude to Sohyun Park who served as the graphic designer and media researcher for the project and the Gender-Based Violence Consortium. The students who worked on this project were supported by the Office of Undergraduate Research, Honors College, and the Francis Family Fund. Additionally, this report is made possible due to the survivors and experts in social services, advocacy, community-based organizations, health care, academia, law enforcement, governmental organizations, among many other professions whose everyday calling and commitment are to respond to the needs of survivors of domestic violence, sexual violence and human trafficking.
References
American Immigration Council. (2020). Immigrants in Utah: Fact Sheet. https://www.americanimmigrationcouncil.org/research/immigrants-in-utah
API GBV (Asian Pacific Institute on Gender-Based Violence) (2018). Pacific Islanders andn Domestic Violence & Sexual Violence: Fact Sheet. https://api-gbv.org/wp-content/uploads/2019/02/DVFactSheet-Pacific-Islander-Apr-2018-formatted-2019.pdf
API GBV (Asian Pacific Institute on Gender-Based Violence) (n.d). Domestic Violence. https://www.apigbv.org/about-gbv/types-of-gbv/domestic-violence/
Barker, M. (2022). BEYOND A MULTIPLICITY OF STIGMA: LGBTQ+ SURVIVORS OF GENDER BASED VIOLENCE ACCESSING SERVICES IN THE STATE OF UTAH. Honors Thesis, University of Utah.
Belknap, J., Melton, H. C., Denney, J. T., Fleury-Steiner, R. E., & Sullivan, C. M. (2009). The Levels and Roles of Social and Institutional Support Reported by Survivors of Intimate Partner Abuse. Feminist Criminology, 4(4), 377–402. https://doi.org/10.1177/1557085109344942
Blackburn Center (2020). Black women & domestic violence. https://www.blackburncenter.org/post/2020/02/26/black-women-domestic-violence
Butler, C.N. (2015). The Racial Roots of Human Trafficking. UCLA Law Review 62: 1464 – 1515.
CDC (2021). Sexual Violence is Preventable. https://www.cdc.gov/injury/features/sexualviolence/ index.html#:~:text=Nearly%201%20in%205%20women,it%20occurred%20before%20age%2010.
Dempsey A.G. (2009). Aggression and victimization in middle school: A mixed methods analysis of the process and effectiveness of implementing a prevention program (Unpublished doctoral dissertation). University of Florida, Gainesville.
Denzin, N.K., & Lincoln, Y.S. (2013). Strategies of qualitative inquiry (4th ed.). Washington D.C.: Sage Publishers.
Driscoll, D.L., Appiah-Yeboah, A., Salib, P., Rupert, D. (2007). Merging qualitative and quantitative data in mixed methods research: How to and why not. Ecological and Environmental Anthropology (University of Georgia). Paper 18. http://digital commons/unl.edu/icwdmeea/18
Existe Ayuda. https://ovc.ojp.gov/sites/g/files/xyckuh226/files/pubs/existeayuda/tools/pdf/factsheet_eng.pdf
Fukushima, A.I., Gonzalez-Pons, K.,* O’Connor, A., Clark, L., & Gezinski, L. (2018). “Addressing the Needs for Survivors of Human Trafficking in Salt Lake City: A White Paper.” Salt City Mayor’s Office, the Salt Lake City Council, the Salt Lake County District Attorney’s Office.
Fukushima, A.I., Gezinski, L., & Boley, E.* (2018). “Violence Against Women Community Needs Assessment: Report, July 2018.” San Francisco, California, Department on the Status of Women.
Fukushima, A.I., Lukasinski, V., & Gonzalez-Pons, K. (2020). The Coordinated Community Response to Non-Fatal Strangulation in Intimate Partner Violence: Pilot Program. A White Paper. Utah: University of Utah.
Gezinski, L. (2017). Utah Statewide Domestic Violence Needs Assessment. Center for victim research repository. URI: https://www.udvc.org/file_download/13d55c5a-9854-4822-bba9-a30d4d27d56c
HRC Foundation (2021). Sexual Assault and the LGBTQ Community. https://www.hrc.org/resources/sexual-assault-and-the-lgbt-community
Jacobs, B. (2021). Most sexual assault cases in Salt Lake, Utah counties stall in police departments. New research explains why. Salt Lake Tribune, https://www.sltrib.com/news/2021/11/14/few-utah-sexual-assault/
Jick, T. D. (1979). Mixing qualitative and quantitative methods: Triangulation in action. Administrative Science Quarterly, 24(4), 602-611.
Kaufman, R.A. & English, F.W. 1979. Needs Assessment: Concept and Application. New Jersey: Educational Technology Publications.
Lederer, L.J. and Wetzel, C.A. (2014). The Health Consequences of Sex Trafficking and Their Implications for Identifying Victims in Healthcare Facilities. Annals of Health Law 23: 61 – 91.
McLean, G. and Bocinski, S.G. (2017). The economic cost of intimate partner violence, sexual assault, and stalking. Institute for Women’s Policy Research. https://iwpr.org/iwpr-general/the-economic-cost-of-intimatepartner-violence-sexual-assault-and-stalking/
Merck, A. (2020). Addressing the Spike in Domestic Violence amid Coronovirus for Latinas and All Women. Salud America. https://salud-america.org/addressing-the-spike-in-domestic-violence-amid-coronavius-for-latinasand-all-women/#:~:text=The%20U.S.%20Has%20a%20Domestic,of%20women%20overall%20(37.3%25)
Mingus, M. (2022). Transformative Justice: A Brief Description. Fellowship; New York Vol. 84, Iss. 2 (Winter 2021/2022): 17-19. https://www.proquest.com/docview/2644084057?pq-origsite=gscholar&fromopenview=true
National Coalition Against Domestic Violence (n.d.). What is Domestic Violence? https://ncadv.org/learnmore#:~:text=Domestic%20violence%20is%20the%20willful,psychological%20violence%2C%20and%20emotional%20abuse.
National Human Trafficking Hotline (n.d.). Utah. https://humantraffickinghotline.org/state/utah
NCADV (2018). Domestic Violence and the LGBTQ Community.https://ncadv.org/blog/posts/domestic-violenceand-the-lgbtq-community
Peitzmeier, S.M., Malik, M., Kattari, S.K., Marrow, E., Stephenson, R., Agenor, M., and Reisner, S. (2020). Intimate Partner Violence in Transgender Populations: Systematic Review and Meta-analysis of Prevalence and Correlates. American Journal of Public Health 110, e1_e14, https://doi.org/10.2105/AJPH.2020.305774
Petersen, D.J. & Alexander, G.R. (2001). Needs Assessment in Public Health: A Practical Guide for Students and Professionals. Springer US.
Peterson, C., DeGue, S., Florence, C., and Lokey, C.N. (2017). Lifetime Economic Burden of Rape Among U.S. Adults. Am J Prev Med 52(6):691-701. doi: 10.1016/j.amepre.2016.11.014.
Peterson, E.S., Hartman, T., Agarwal, R., McKitrick, C., and Jones, M. (2021). Some Utah landlords are evicting domestic violence victims. The Salt Lake Tribune. https://www.sltrib.com/news/politics/2021/03/19/some-utahlandlords-are/
RAINN (2022). Types of Sexual Violence. https://www.rainn.org/types-sexual-violence
Rosay, A.B. (2016). Violence Against American Indian and Alaska Native Women and Men. NIJ Journal,https://www.ojp.gov/pdffiles1/nij/249822.pdf.
Salari, S. (2021). Family Violence Across the Life Course: Research, Policy & Prevention. Kendall Hunt.
Soriano, F.I. (2012). Conducting Needs Assessments: A Multidisciplinary Approach. SAGE Human Services Guides. SAGE Publications.
Stockman, J.K., Hayashi, H., Campbell, J.C. (2015). Intimate Partner Violence and Its Health Impact on Disproportionately Affected Populations, Including Minorities and Impoverished Groups. J Womens Health (Larchmt). 2015 Jan 1; 24(1): 62–79.
Straus, A., & Corbin, J. (1990). Basic qualitative research. Newbury Park, CA: Sage.
T. B. (2021). How Domestic Violence Varies by Ethnicity. Very Well Mind, https://www.verywellmind.com/domestic-violence-varies-by-ethnicity-62648#:~:text=In%20fact%2C%20according%20to%20the,a%20partner%20in%20their%20lifetime.
United States of America (2020). Victims of Trafficking and Violence Protection Act of 2000 [United States of America], Public Law 106-386 [H.R. 3244], 28 October 2000, available at: https://www.refworld.org/docid/3ae6b6104.html [accessed 1 May 2022].
Utah Code 77–36–2.1 & 2.2. Duties of law enforcement officers. https://le.utah.gov/xcode/Title77/Chapter36/77-36-S2.1.html
Utah Department of Health (2018). New Report Shows Impact of Intimate Partner Violence in Utah. https://health.utah.gov/featured-news/new-report-shows-impact-of-intimate-partner-violence-in-utah
Venkatesh, V., Brown, S.A. & Bala, H. (2013). Bridging the qualitative-quantitative divide: Guidelines for conducting mixed methods research in information systems. MIS Quarterly, 37(1), 21-54.
Citation
Fukushima, AI. (2022). Utah Statewide Needs Assessment: Domestic Violence, Sexual Violence and Human Trafficking – 2022 Report. Gender-Based Violence Consortium, University of Utah. doi: 10.26054/0d-wpgq-gnf1
An estimated 1.3 million women will enter menopause each year in the US.1 While menopause is commonly viewed as affecting only reproductive health, studies have shown that the reduction of estrogen significantly impacts cognitive functioning as well.2,3 A decline in cognitive functioning may begin as forgetfulness, then progress to cognitive impairment and eventually lead to dementia. Alzheimer’s Disease (AD) is the most common cause of dementia and kills 1 in 3 older adults annually.4 Women make up two-thirds of AD and dementia diagnoses, yet there is no information from either the Centers for Disease Control5 or the Alzheimer’s Association4 that is specific to women and estrogen. This shows that more research needs to be done to examine the connection between estrogen and cognition to determine potential prevention and treatment for dementia in aging women.
Status of the Literature
Every woman goes through menopause, either through the natural aging process or the surgical removal of the ovaries. The most common symptoms of menopause are hot flashes, changes in mood and appetite, sleeping difficulties, lower libido, decreased concentration, and issues with cognition and memory.6 Some of these symptoms are cloaked in stigma, while hot flashes and reduced sex drive are widely, and stereotypically, discussed in the popular media, drawing attention away from the important neurological symptoms.7 Both brain and ovaries are part of the neuroendocrine system, and estrogen produced by the ovaries is critical for providing energy to the brain.8 Conde et al.9 found that a decline in cognitive performance was a prevailing complaint among menopausal women.
Menopause also has a documented impact on women’s brain functioning, especially in relation to memory. The majority of women report memory decline, especially short-term memory loss, to be a major symptom of menopause.10 Studies have also shown menopause to cause a reduction in processing speed and verbal memory.10 Additionally, in a neuroimaging comparison to age-similar men, menopausal women showed changes in brain structure such as volume reduction in certain areas and hypometabolism of glucose.11
Depression and anxiety are also common symptoms due to the decrease in estrogen. Estrogen loss is correlated with diminished synapse formation in the basal forebrain and hippocampus and reduced cholinergic and serotonergic brain functions, which impacts cognition and mood.3 Depression and anxiety can also affect cognition, as Devere explains,12 indicating there may be more to consider when diagnosing and treating cognitive impairment. Because menopause has so many associated symptoms, it can be difficult to discern whether a patient’s mental health symptoms are a result of menopause or have a different etiology.10 It is crucial that healthcare providers understand the scope of menopausal symptoms and how they might interact with mental health.
Unfortunately, mental health symptoms, issues with working memory and verbal memory, and slower cognition are not the only obstacles facing menopausal women. The impact of reduced estrogen on the brain can put women at a higher risk of developing AD.6 Menopausal women display similar neurological changes as those with AD, including reduced gray matter in the parietal and temporal regions and brain underactivity as indicated by glucose tracers.6
Call to Action
Studies have shown that estrogen influences cognitive function across several regions of the brain, namely those involved with information retrieval and memory, and evidence proves that menopause and AD are linked.12 This is an under researched topic, and one that is critical to the well-being of women. While some literature about cognitive decline in menopause contains controversy over the treatment of dementia, it is still a valid research area2 that further highlights the importance of recognizing the effects of decreased estrogen levels on cognitive decline. It is important for neurologists to take menopause as well as perimenopause into consideration when evaluating memory decline among women. Lastly, because there is the potential for contradiction in study results due to studying women with a variety of genetic factors for dementia, further research needs to take a more individualized approach to examine the effects of hormone replacement therapy among postmenopausal women. This is an issue that, if addressed, can have a life-changing impact on women’s well-being and longevity.
References
Peacock K, Ketvertis K. Menopause. StatPearls. Accessed November 25, 2021. https://www.ncbi.nlm.nih.gov/books/NBK507826/
Pertesi S, Coughlan G, Puthusseryppady V, Morris E, Hornberger M. Menopause, cognition and dementia – A review. Post Reprod Health. 2019 Dec;25(4):200-206. doi:10.1177/2053369119883485
Reuben R, Karkaby L, McNamee C, Phillips NA, Einstein, G. Menopause and cognitive complaints: Are ovarian hormones linked with subjective cognitive decline? Climacteric. 2021 24(4):321-332. doi:10.1080/13697137.2021.1892627
Alzheimer’s Disease facts and figures. Alzheimer’s Association. Accessed November 28, 2021. https://www.alz.org/alzheimers-dementia/facts-figures
What is Alzheimer’s Disease? Alzheimer’s Disease and related dementias. Centers for Disease Control. October 26, 2020. Accessed November 28, 2021. https://www.cdc.gov/aging/aginginfo/alzheimers.htm#Who
Mosconi L, Rahman A, Diaz I, Wu X, Scheyer O, Hristov HW, Vallabhajosula S, Isaacson RS, de Leon MJ, Brinton RD. Increased Alzheimer’s risk during the menopause transition: A 3-year longitudinal brain imaging study. PLoS One. 2018 Dec 12;13(12): e0207885. doi:10.1371/journal.pone.0207885
MacKenzie, M. 1.3 million women enter menopause each year. We have to stop ignoring them. Glamor. October 7, 2020. Accessed November 28, 2021. https://www.glamour.com/story/its-time-to-stop-ignoring-menopausal-women
Mosconi, L. How menopause affects the brain. TEDWomen 2019. 2019. Accessed November 28, 2021. https://www.ted.com/talks/lisa_mosconi_how_menopause_affects_the_brain
Conde DM, Verdade RC, Valadares ALR, Mella LFB, Pedro AO, Costa-Paiva L. Menopause and cognitive impairment: A narrative review of current knowledge. World J Psychiatry. 2021 Aug 19;11(8):412-428. doi:10.5498/wjp.v11.i8.412.
Huang W, Jiang S, Geng L, Li C, Tao M. Correlation between menopausal symptoms and everyday cognition in Chinese (peri)menopausal women. Gynecol Endocrinol. 2021 Jul;37(7):655-659. doi:10.1080/09513590.2021.1892629.
Mosconi L, Berti V, Dyke J, Schelbaum E, Jett S, Loughlin L, Jang G, Rahman A, Hristov H, Pahlajani S, Andrews R, Matthews D, Etingin O, Ganzer C, de Leon M, Isaacson R, Brinton RD. Menopause impacts human brain structure, connectivity, energy metabolism, and amyloid-beta deposition. Nature Sci Rep. 2021 Jun;11(10867). doi:10.1038/s41598-021-90084-y.
Devere R. Dementia insights: Cognitive consequences of perimenopause. Practical Neurology. 2019 May:107-109.
Citation
Bradford L, Fuller S, & Green JW. (2022). The Impacts of Menopause on Cognitive Function. Utah Women’s Health Review. doi: 10.26054/0d-8prr-kx1w