
Letter from the Editor, Karen Schliep, PhD MSPH, 2022
Welcome to the fourth annual issue of The Utah Women’s Health Review! On behalf of the editorial board and our dedicated staff, we are thrilled to present a diverse collection of original manuscripts that explore the intricacies of women’s health across the 7 Domains of Health.
In these eleven thought-provoking contributions, our authors delve into critical aspects of women’s well-being, shedding light on sex and gender health disparities. This issue holds a special place in our hearts as we navigate the complexities of women’s health against the backdrop of our ever-changing world.
This year’s issue includes two original research articles, seven insightful commentaries, and two illuminating data snapshots. Each piece thoughtfully examines at least one domain of health, contributing to our understanding of the multifaceted nature of women’s health. Additionally, we provide a link to the recorded proceedings from the 2022 “Abortion to Gen Z: Equity and Inclusion in Sex, Gender, & Women’s Health Virtual Symposium.”
Anxiety, Depression, and Pregnancy during COVID-19 (Valcarce et al): A meticulous exploration of anxiety and depression rates among pregnant women in Utah during the COVID-19 pandemic, urging a closer look at maternal mental health and the need for enhanced support and resources.
Pregnancy & Opioid Addiction (Ellsworth and Adediran): Unpacking the critical impact of opioid addiction on pregnant women and infants, addressing treatment gaps, and calling for further research to guide effective interventions.
The Consequences of Menopause on Cognitive Functioning (Ewoniuk): A compelling analysis of menopause’s impact on cognitive health, advocating for increased awareness and education, especially within the medical community.
Menstrual Cycle’s Effect on Women’s Intellectual Health (Spackman and Arteaga): Addressing the impact of menstruation on the intellectual health of women and girls, emphasizing potential negative effects and calling for increased understanding and awareness about menstruation to support women and girls intellectually.
Period Poverty (Adediran and Myrer): Tackling the pervasive issue of period poverty, defined as the inability to access affordable sanitary products, hygiene facilities, and menstrual hygiene education. The commentary well summarizes legislative efforts and policy recommendations, within and beyond Utah, to alleviate period poverty’s health and economic burdens.
COVID-19 Severity in Utah (Paegle et al): A comprehensive study revealing disparities in COVID-19 illness severity across demographic groups in Utah, emphasizing the need for targeted interventions.
Women in Post-Secondary Education: Utah Fails to Thrive (Turner): Analyzing trends and challenges faced by women in Utah’s educational landscape, calling for awareness, resources, and support to empower women in pursuing higher education.
Reproductive Health Literacy Among Adolescent Women in Utah (Waechtler): Addressing inadequate reproductive health literacy among adolescent women and proposing solutions to bridge educational gaps.
Do Interventions Targeting Women Impact Children’s Health Behaviors (Nava et al): An in-depth research article investigating changes in fruit and vegetable consumption and physical activity among children, revealing the potential impact of interventions focused on enhancing women’s health behaviors on the well-being of children and household members.
Obesity in Pregnancy and its Effects: Utah 1993–2020 (Bellows et al): A data snapshot addressing the prevalence of obesity during pregnancy in Utah and its associated consequences, calling for public health efforts to encourage healthy weight and lifestyles.
Intellectual Health During Pregnancy (Harward et al): A commentary focusing on how pregnancy induces significant changes in a person’s brain structure, impacting intellectual health. Despite limited literature on this topic, the commentary recommends increased basic research to understand physiological and cognitive changes during and after pregnancy, development of evidence-based health education materials addressing health literacy challenges, and exploration of ways to support intellectual health amid pregnancy-related changes.
As we present these insightful articles, we encourage you to reflect on the issues discussed and consider the broader implications for women’s health. Our call to action resonates throughout, urging a collective effort to address disparities, enhance education, and advocate for the well-being of women in Utah and beyond.
We extend our heartfelt gratitude to the authors, reviewers, and readers who contribute to the success of The Utah Women’s Health Review. Your support empowers us to continue exploring, understanding, and championing the diverse facets of women’s health.
We look forward to receiving and reviewing your submissions in the coming years, as we continue our mission to advance knowledge and promote positive change in women’s health.
Warm regards,
Karen Schliep, PhD MSPH
Utah Women’s Health Review
Editor-in-Chief
Obesity in Pregnancy and its Effects: Utah 1993-2020
Background
Obesity is a growing health problem that can adversely affect many aspects of health, including pregnancy. It is a common, serious, and costly disease that is more prevalent in disadvantaged and marginalized groups.1 Along with the many associated public health implications of obesity, some are specifically important in pregnancy and pediatric health, posing a challenge on obstetrics practice.
The standard measure of obesity is body mass index (BMI). A BMI greater than 30.0 kg/m² is considered obese, with BMI < 18.5 kg/m² considered underweight, 18.5 kg/m² ≤ BMI ≤ 24.9 kg/m² as normal weight, and 25 kg/m² ≤ BMI ≤ 29.9 kg/m² as overweight.2 While BMI can be reductive, it is the best tool for broad-based health policy perspectives.3
The seven domains of health influence obesity in pregnancy and its outcomes.4 When a woman is struggling in one domain, it can affect her ability to achieve a healthy state in others. Social health has effects on physical activity and diet that can come with cultural roots. Emotional health can be severely affected by obesity with weight gain and postpartum depression. Intellectual health may influence knowledge of the negative effects that are associated with pregnancy and obesity. Low socioeconomic status (SES) mothers have a higher risk of becoming obese due to inability to afford healthy foods. Struggling with obesity makes it much more difficult to return to a healthy state in each of the seven domains of health. These domains influence obesity, which leads to predisposing factors and early mortality for mothers and their babies.4
Researchers have found a correlation between obesity and miscarriage, stillbirth, diabetes, high blood pressure, cardiac dysfunction, renal dysfunction, hepatic dysfunction, sleep apnea, and risk of Cesarean section.5 Fetal risks in the setting of maternal obesity include birth defects, fetal macrosomia (larger than average size), impaired growth, asthma, and obesity.6 The purpose of this data snapshot is to characterize and describe the prevalence of obesity during pregnancy and its associated consequences in Utah and the United States.
Methods
Data was gathered from the Utah Maternal and Infant Health Program from 1993 to 2020. This program is an ongoing statewide monitoring system. After delivery of a live birth, the parent/parents are given a worksheet to fill out that will be used to create the child’s birth certificate; this worksheet also asks for information about the mother’s prepregnancy weight, height, and other social history and is added to the Utah Birth Certificate database.7 The BMI for each individual was calculated based on the data submitted to the Utah Office of Vital Records and Statistics. This data is then made available on the Public Health Indicator Based Information System (IBIS). Prevalence and 95% confidence intervals are reported. The national data used for comparison with the Utah data was obtained from the CDC website.
Results
Women who delivered a live birth during the years 1993 to 2020 and had a BMI that was classified as “obese” were used to calculate the following percentages. From Figure 1, it is evident that the prevalence of prepregnancy obesity has been increasing in Utah, reaching a high of 23.7% in 2020. However, this was still lower than the 2020 statistic for the entire United States of 30.0%.8

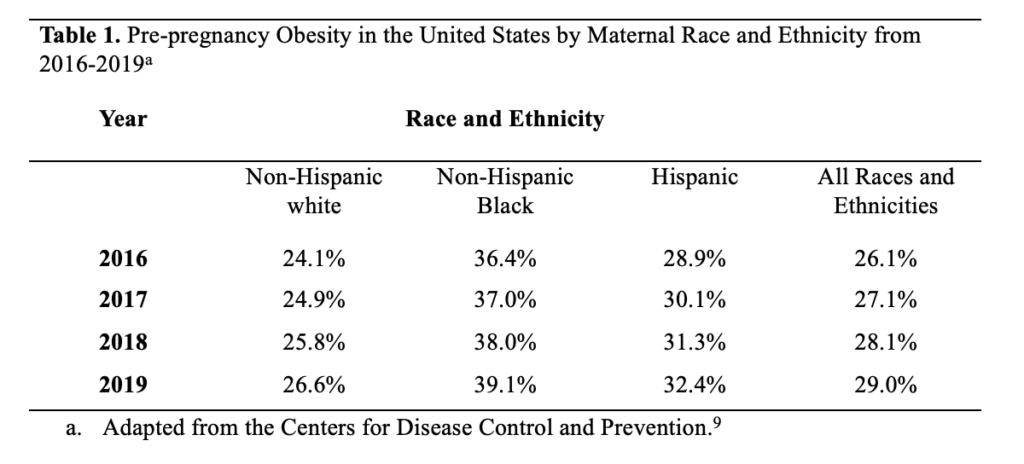
When comparing Figure 1 and Table 1, it is clear that prepregnant Utah women have a lower prevalence of obesity compared to women across the entire United States. However, both Utah and the United States show trends of consistent increase in prevalence of obesity.
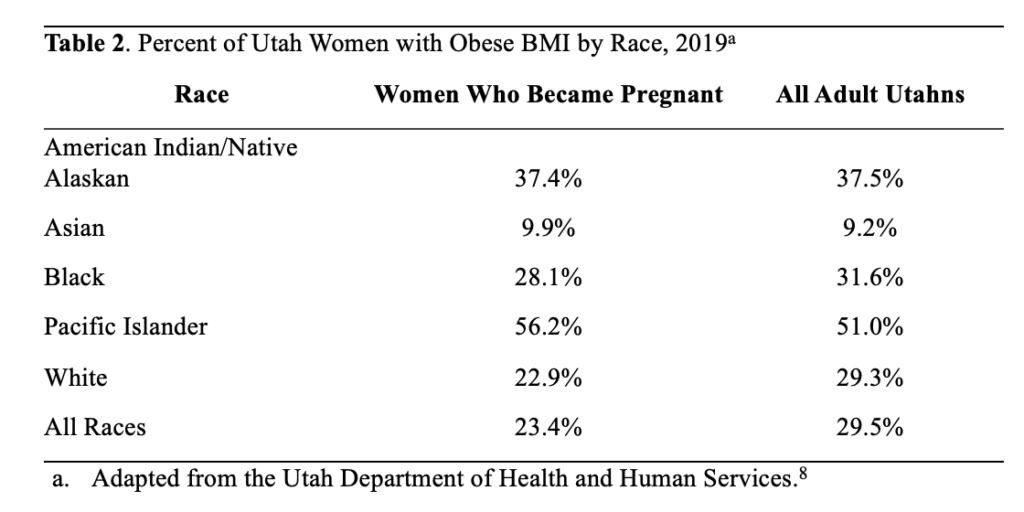
Table 2 compares the proportion of Utah women with a pre-pregnancy BMI of 30 or higher to the proportion of adult Utahns with a BMI in this range, stratified by racial group. Overall, only 23.4% of women who became pregnant were classified as obese, compared to 29.5% of Utahns as a whole. However, the proportion of Pacific Islanders with an obese pre-pregnancy BMI was higher than the overall proportion of Pacific Islander Utahns with an obese BMI (56.2% vs. 51.0%).
Discussion
Through the data gathered, it was found that of women who delivered live births, the proportion with a prepregnancy BMI of 30 kg/m2 or higher (those considered obese) has been steadily increasing. Since 1993, when the Utah Department of Health database first included this information, the percentage of obese pregnant women has increased from 9.6% to 23.7% in 2020. This number is lower than the United States average of 30% obese pregnant women in 2020, but still does not meet Healthy People 2030 objectives. By 2030, the Healthy People initiative aims to have 53.4% of U.S. women start pregnancy at a healthy weight; as of 2020, only 47.1% of Utah women met this standard.8 In addition, obesity rates in pregnant women are higher among those with lower education levels, lower income, and no health insurance, as well as those of Pacific Islander, Black, American Indian/Alaskan Native races, or Hispanic ethnicity.8
The increasing rates of obesity are concerning because of the many effects this can have on the health of the mother and the baby. A woman who is not at a healthy weight before becoming pregnant is more likely to have longer hospital stays and need more medical attention during pregnancy.8 Obese pregnant women are also at increased risk for many antepartum complications, including gestational diabetes, preeclampsia/eclampsia, stillbirth, and miscarriage.10 They are more likely to have longer labors, more fetal distress, and require a Cesarean section or operative vaginal delivery.8 This could possibly lead to more long-term health consequences as the newborn grows older and may affect subsequent pregnancies for the same woman. These complications can become very costly for the mother, especially considering that being below poverty level is a risk factor for obesity, and thus these women may be less able to afford treatment for these complications.
Much of what can be done in the public health sphere involves encouraging healthy weight and lifestyles before a woman even becomes pregnant. By doing so, public health can help prevent many of the complications that an obese woman may experience during pregnancy. Women should also receive regular well-woman care/visits from their primary caregivers. They can receive counseling, if needed, on weight, and on the risks that can come with an unhealthy weight once pregnant. Pregnant women should also receive proper education and counseling on healthy antepartum weight gain and postpartum weight loss.8 Additionally, the Utah Department of Health hosts a program called Healthy Environments and Active Living that provides education on physical activity and healthy eating habits, available to all Utah citizens.
While the data on obesity in pregnancy is helpful in beginning to address the problem, there are some limitations to this data. Data was obtained based on self-reporting by the mother shortly after the birth, and may be inaccurate due to recall error or misreporting. Because of this, both the Utah and nationwide estimates of prepregnancy obesity may be underestimated. Since data was only obtained for live births, it is unknown how obesity affects the number of stillborn and miscarried fetuses. It is also difficult to separate obesity from confounding risk factors such as poverty, race, low education, and lack of medical care. More in-depth studies would be needed to determine how much obesity plays a role in pregnancy complications, as opposed to some of the other mentioned risk factors. Finally, BMI has been used for many years as a standard for measuring health, but it is limited in what it can say about the health of an individual. It does not take into account diet, exercise, or other lifestyle choices. It would be valuable to consider additional health measures, not just BMI, when determining the health of a pregnant woman.
Despite these limitations, the data in this snapshot is beneficial and can be applied to other locations. The data was obtained from Utah’s birth certificate database. Birth certificates are documents produced nearly worldwide, and therefore this type of data collection can be repeated with many populations. Birth certificates only include live births, but they can be a good starting point to encourage more research in this area. The data may not be enough to draft policy, but it can help direct public health officials and policymakers towards the public health issues that need more attention. More education should also be targeted at pregnant and prepregnant women, especially those of American Indian/Alaska Native and Pacific Islander descent, as they have the highest rates of obesity. Additionally, more research should be conducted on obesity in all pregnancies (not just those ending in live births) and should examine obesity more closely in those areas of the population that are already at risk, such as those of lower socioeconomic status. Through additional research, a more complete picture can be attained of the risks of obesity in pregnancy and what can be done to best help those women most at risk.
Acknowledgements
Public Health Indicator Based Information System (IBIS) retrieved on March 10, 2022, from Utah Department of Health, Center for Health Data and Informatics, Indicator-Based System for Public Health. Website: http://ibis.health.utah.gov/
References
1. Centers for Disease Control and Prevention. Adult Obesity Causes & Consequences. Centers for Disease Control and Prevention. Published March 22, 2021. https://www.cdc.gov/obesity/adult/causes.htm
2. National Heart, Lung, and Blood Institute. Calculate Your BMI – Standard BMI Calculator. NIH.gov. Published 2019. https://www.nhlbi.nih.gov/health/educational/lose_wt/BMI/bmicalc.htm
3. CDC. About Adult BMI. Centers for Disease Control and Prevention. Published 2018. https://www.cdc.gov/healthyweight/assessing/bmi/adult_bmi/index.html
4. 7 Domains of Health – UWH Review. uwhr.utah.edu. Accessed March 17, 2022. https://uwhr.utah.edu/7-domains-of-health/
5. Fitch AK, Bays HE. Obesity definition, diagnosis, bias, standard operating procedures (SOPs), and telehealth: An Obesity Medicine Association (OMA) Clinical Practice Statement (CPS) 2022. Obesity Pillars. 2022;1:100004. doi:10.1016/j.obpill.2021.100004
6. Pregnancy and obesity: Know the risks. Mayo Clinic. Published 2018. https://www.mayoclinic.org/healthy-lifestyle/pregnancy-week-by-week/in-depth/pregnancy-and-obesity/art-20044409
7. Birth Records | Utah Office of Vital Records and Statistics. vitalrecords.health.utah.gov. https://vitalrecords.health.utah.gov/records
8. IBIS-PH – Complete Health Indicator Report – Obesity in Pregnancy. ibis.health.utah.gov. Accessed March 10, 2022. https://ibis.health.utah.gov/ibisph-view/indicator/complete_profile/ObePre.html
9. A D. Increases in Prepregnancy Obesity: United States, 2016–2019. National Center for Health Statistics. Published November 2020. https://www.cdc.gov/nchs/products/databriefs/db392.htm
10. Leddy MA, Power ML, Schulkin J. The impact of maternal obesity on maternal and fetal health. Reviews in obstetrics & gynecology. 2008;1(4):170-178. https://www.ncbi.nlm.nih.gov/pmc/articles/PMC2621047/
Citation
Bellows E, Canning S, Price P, & Ricart H. (2023). Obesity in Pregnancy and its Effects: Utah 1993-2020. Utah Women’s Health Review. doi: 10.26054/0d-6pn3-80gy
Do Interventions Targeting Women Impact Children’s Health Behaviors?
Abstract
Objectives: Women play an important role in promoting healthy eating and physical activity within their households, influencing the current and life-long health behaviors of children. The purpose of this study is to describe changes in fruit/vegetable consumption and physical activity among children living with racially and ethnically diverse women participating in a lifestyle-change intervention.
Methods: The study involves secondary analysis of data from a randomized trial of a wellness-coaching intervention led by Community Health Workers, called Community Wellness Coaches in this study. Study participants came from five diverse racial/ethnic communities. Participants received monthly vs. quarterly wellness coaching. Data on changes in the health behaviors of children at four months after enrollment were collected through interviews. Children’s behavior changes were compared by study arm, demographics, and women’s health behaviors.
Results: Overall, 71.9% of women reported increases in the fruit/vegetable intake of children living in their household and 59.4% reported increases in children’s physical activity. There were no differences in children’s fruit/vegetable intake or physical activity by study arm (p=0.88). Women who reported that their own fruit/vegetable intake increased were more likely to report an increase in children’s consumption (aOR=2.55, 95%CI 1.05 – 6.21).
Conclusion and Implications: Among women of color participating in a health-behavior change intervention, women’s behavior changes were associated with improvements in child health behaviors. Interventions focused on improving women’s health behaviors may also impact the behaviors of children and other household members. Emphasizing the role of women on the health of children in such interventions may magnify this impact.
Introduction
The U.S has experienced nearly a two-fold increase in obesity in less than 30 years.1 Disparities in obesity rates exist among women from different racial/ethnic groups. For example,Utah data from 2021 reveal overweight/obesity rates of 39.2% (95% CI 32.5 – 46.3) among people of Asian descent, 62.8% (95% CI 54.5 – 70.5) among Black people, 64.2% (95% CI 63.3 – 65.1) among white people, 71% (95% CI 66.9 – 74.7) among people of Hispanic/Latinx descent, 74.9% (95% CI 68.8 – 80.2) among people of American Indian/Alaska Native descent, and 87.9% (95% CI 78.9 – 93.4) among people of Native Hawaiian/Pacific Islander descent.2 These rates differ slightly when compared to national data from 2021, although data indicate national disparities by race and ethnicity, with overweight/obesity rates of 14.5% (95% CI 11.4 – 18.1) among women of Asian descent, 39.6% (95% CI 36.2 – 43.0) among white non-Hispanic/Latinx women, 45.7% (95% CI 42.4 – 49.1) among women of Hispanic/Latinx descent, and 57.9% (95% CI 54.0 – 61.7) among Black women.3 When a child has a parent who is obese, a child is three times more likely to be overweight or obese.4 Thus, identifying novel and effective ways to address and prevent obesity in both mothers and their children is critical. Educational interventions that are delivered to mothers and impact their children have the potential to address childhood obesity.
Given the racial/ethnic disparities in obesity rates among women and children, the Coalition for a Healthier Community for Utah Women and Girls (UWAG) conducted a randomized trial of a 12-month wellness-coaching intervention for women of color [Hispanic/Latinx, American Indian/Alaska Native, African American, African Refugees/Immigrants, and Native Hawaiian/Pacific Islander] residing in Utah. The aim of the present secondary analysis using baseline and four-month data was to better understand whether wellness coaching focused on fruit/vegetable intake (FVI) and physical activity among these women was associated with changes in the health behaviors of children living in their homes. This research question is important because obesity is on the rise for both adults and children. Communities of color are also disproportionately impacted by high overweight and obesity rates, due to social determinants of health, such as disparities in food access (e.g., readily available highly processed and energy-dense foods and fewer low-cost, fresh foods), neighborhood environment resources, and lack of health-insurance coverage.5
Methods
The UWAG study was developed through a partnership between the Utah Women’s Health Coalition (UWHC) and Community Faces of Utah (CFU). CFU is an established partnership that includes leaders from five different community organizations along with University of Utah and Utah Department of Health personnel. The communities include African immigrants and refugees from Burundi, Central African Republic, Democratic Republic of Congo, and Rwanda, African Americans, American Indian/Alaska Natives, Hispanic/Latinx, and Native Hawaiian/Pacific Islanders. Community-based participatory research (CBPR) best practices were employed to build trust between community leaders and academic researchers.6, The process began with the leaders identifying the priority health issues for the intervention—diabetes and obesity—and the focus on increasing healthy diet and exercise behaviors.7 The UWAG partnership involved the community leaders and academic partners as research collaborators throughout all phases of the study, including planning, design, implementation, data analysis, and dissemination of study findings.7
Women from each of the CFU communities were trained to serve as Community Wellness Coaches (CWCs), helping to address issues related to obesity and diabetes by promoting healthy eating and exercise among women in their own communities. The CWCs understood the culture and context of their communities and thus were well suited to help women make healthy behavior changes.
The CWCs were also trained to collect height and weight, and to use a set of computer-assisted interview and coaching tools developed in Research Electronic Data Capture (REDCap) software.8, 9 REDCap is an application for building, collecting, and managing online surveys and data hosted by the University of Utah through the Center for Clinical and Translational Science (recently renamed the Clinical and Translational Science Institute). Height was measured in inches using a measuring tape. While resting against the measurement surface, participants were instructed to look straight ahead, to relax their shoulders with arms resting at their sides and legs straight with knees close together and bare feet flat and almost together. Height was recorded to the quarter-inch at the beginning of the study. Weight was measured in pounds using an analog scale that was zeroed before each use. Participants were instructed to remove their shoes and to wear light clothing. Weight was recorded to the whole pound, and was taken at baseline, and once at each of the three follow-up time points. While published protocols were not used for these measurements, best practices were used based on the clinical expertise of our team, which included a nurse midwife and a physician. BMI was calculated by multiplying by 703 the result of weight in pounds divided by height squared {i.e., BMI = [weight in pounds / (height in inches x height in inches) * 703]}. For all racial/ethnic categories except Native Hawaiian/Pacific Islanders, BMI categories were: underweight <18.5, normal weight 18.5-24.9, overweight 25-29.9, obese 30 or greater.10 BMI categories used for Native Hawaiian/Pacific Islanders were: normal weight <26, overweight 26-31.9, obese 32 or greater.11 The interview questions were developed and adapted with input from CWCs and in collaboration with community partners to ensure cultural appropriateness and clarity. In addition to demographic questions, women were asked about their health knowledge and health behaviors, as well as barriers and facilitators they perceived to their health behaviors. After all baseline information was gathered, participants were randomized to receive quarterly wellness coaching (low-intensity intervention arm) or monthly wellness coaching with monthly group activities (high-intensity intervention arm). The CWCs planned monthly activities based on the interests and needs of participants. Examples of these activities included grocery-store tours, healthy-cooking classes, group participation in 5K races, group hikes, bowling, and stress-management activities. Participants received tools related to these activities, such as measuring cups, exercise bands, recipes, and pedometers. Participants in both the low-intensity and high-intensity intervention arms were asked the same set of questions four months after randomization. At this follow-up interview, participants were asked to report changes in their diet and exercise behaviors as well as changes that they had observed in their children, spouse, and any other people living in the home during the prior four months. Data for analyses described in this paper came from baseline and four-month computer assisted participant interviews led by CWCs.
Questions on diet came from the Behavioral Risk Factor Surveillance System survey.12 Participants were asked by a CWC about the number of times they drank pure fruit juice in the past month, ate fruit (including fresh, frozen, or canned fruit juice and fruit), and ate vegetables (including beans, dark green vegetables, orange vegetables, and “other” vegetables). To acquire accurate comparable answers on servings of fruits and vegetables, CWCs showed women images of serving sizes compared to familiar items such as dice and playing cards next to the actual item. CWCs also provided physical versions of these items to women to hold as they answered the questions. Physical activity was assessed using the following question: “In an average week, how much time do you spend being physically active or doing exercise?” The answer category options available for describing the weekly amount of physical activity time were: none, less than 20 minutes, 20-29 minutes, 30-59 minutes, 1 hour to less than 1.5 hours, 2 to less than 2.5 hours, 2.5 to less than 3 hours, and 3 or more hours. The level used in the data analysis for achieving recommended physical activity was 150 minutes per week, and the change in daily physical activity from baseline to follow-up was described as increasing more than one level or as not increasing.
Statistical and Data Analysis
The goal of these secondary analyses was to explore whether participants reported changes in the health behaviors of their children between the baseline and the four-month interview. We created Directed Acyclic Graphs (DAGs) of the hypothesized relationships between maternal and child changes in fruit and vegetable consumption and physical activity, in order to visually encode: 1) assumptions; 2) a priori knowledge; and 3) identification of the minimally sufficient set of covariates needed for confounding control. DAGs were created using the browser-based Daggity.net .13 The DAGs provide a visual representation of the relationships among a complex system of interacting components (i.e., variables) and our assumptions about those relationships, in a mathematically grounded framework of non-parametric structural equation models, enabling a fuller understanding by a broader audience.14-16 See Figures 1 and 2.


Key variables were compared between women reporting an increase or no increase in the FVI or physical-activity behaviors of children in the home and were tested using Fisher’s exact 2-sided test. We explored whether demographics, health behaviors, or knowledge about diet/exercise were associated with children’s health-behavior changes. Paired T-tests were used to examine differences in the mother’s mean fruit and vegetable consumption and mean physical activity between baseline and follow-up. The association between women’s age and children’s increases in FVI and physical activity were assessed using pooled (equal variance) 2-sided t-tests as indicated by Folded F-Test (p=0.55, p=0.85, respectively).
Odds of reporting an increase in children’s FVI and physical activity at follow-up were compared to reporting no increase at follow-up and were calculated using Firth’s penalized-likelihood logistic regression in SAS software.17, 18 Sensitivity of the effect estimates were also examined between the non-pregnant study population and the total study population, and effect-measure modification (EMM) was assessed, using the full-regression model, for any covariate in either population with an interaction term chi-square p-value≤0.10. The data were analyzed using IBM SPSS Statistics for Windows, Version 21.0. and SAS 9.4 software; copyright © 2016 SAS Institute Inc. SAS and all other SAS Institute Inc. product or service names are registered trademarks or trademarks of SAS Institute Inc., Cary, NC, USA. Research ethics approval was obtained from the University of Utah Institutional Review Board and the Phoenix Area Indian Health Service Institutional Review Board prior to implementing the study (IRB 00055195).
Results
The study involved 485 Utah women from African American, African, American Indian/Alaska Native, Hispanic/Latinx, and Native Hawaiian/Pacific Islander communities living in households across the Wasatch front that included a total of 2,499 individuals. Participants were excluded from this analysis if they did not have four-month data or had no children living in their home at baseline. Of the 485 women in the study, 53.2% of them (n=258) had children under the age of 18 in the home at baseline. A total of 224 women had both children in the home and four-month follow-up data and thus were included in this analysis. These women had a total of n=607 children living in their homes. Demographic data are shown in Table 1.
At baseline, participants had a mean age of 40.0 years (SD=9.6) and nearly 60% were living below the federal poverty line. Overall, the women had an average of 2.7 (SD=1.4) children per household with variation across communities (data not shown). Approximately 90% of these women were either sedentary or not meeting guidelines for recommended weekly exercise at baseline and almost 70% were not meeting guidelines for fruits/vegetables per day at baseline. Notably, 81.7% of women were overweight/obese at baseline; four months after randomization, 16.1% of the participants experienced a 5% or greater weight loss from their baseline weight, and only 12.0% experienced weight gain of 5% or greater (data not shown). When stratified, 5.2% (n=3) of women reporting an increase in fruit and vegetable consumption for their children, also experienced weight gain of 5% or greater; 10.2% (n=12) of women reporting an increase in the physical activity of their child(ren), also experienced weight gain of 5% or greater, which did not differ significantly from women that did not experience weight gain during the study (p>.30) (data not shown).


As shown in Table 2 and Table 3, similar findings were observed among participants randomized to high-intensity and low-intensity study arms in the participant-reported changes in FVI among children at four months. There was a statistically significant difference in children’s behavior changes by women’s dietary behaviors, with 45.3% of women reporting that their own FVI increased, also reporting an increase in child consumption (aOR=2.55, 95%CI 1.05 – 6.21) in the minimally adjusted model. Fewer women who felt that preparation of fruits and vegetables was too time-consuming reported positive dietary changes in children. In fact, 94.4% of women who disagreed that “fruits and vegetables take too much time to prepare” reported increases in children’s consumption compared to only 5.6% of women who agreed/strongly agreed that preparation of fruits/vegetables was time-consuming (aOR=2.20, 95%CI 0.70 – 6.57). While we observed participant-reported increases in the FVI of children across all groups, Hispanic/Latinx women were the most likely group to report an increase in children’s consumption of fruit and vegetables, at 40.4%; and American Indian/Alaska Native women were the least likely to report an increase in their children’s fruit and vegetable intake, at 10.6% (cOR=0.40, 95%CI 0.16 – 0.97).


The proportion of participants reporting increases in physical activity among children was similar between those randomized to the high- and low-intensity arms of the study (p=0.88), as described in Table 3. We observed differences in the changes in children’s physical activity by a woman’s own physical-activity level. Although not statistically significant, if the woman’s physical activity had increased at four months by more than one category level, she had 1.60 times the odds of also reporting an increase in children’s physical activity (aOR, 95%CI 0.89 – 2.94). Women who had a baseline BMI considered normal or underweight had 2.48 times the adjusted odds (95%CI 1.08 – 6.09) of reporting an increase in physical activity for children at follow-up. While not statistically significant, differences were observed in the proportion of women reporting increases in physical activity in children based on their own self-reported physical activity and environmental barriers to physical activity. We observed lower numbers of women reporting increases in the physical activity of their children who also reported not having a safe place (93.2% vs 6.8%, p=.16), and/or too much pollution and/or noise to exercise (83.5% vs 16.5%, p=.44). Similarly, women who expressed a belief that exercise is important had 1.38 times the odds (95%CI 0.64 – 2.95) of also reporting an increase in physical activity at four months for their children. Among racial/ethnic groups, Hispanic/Latinx mothers reported increases in their children’s physical activity at a higher frequency (40.6%) compared to all other racial/ethnic groups (p=.27).
To examine the impact of pregnancy, we conducted a sensitivity analysis limiting the data analysis to women who were not pregnant at baseline and who were not pregnant at four-month follow-up (n=204, data not shown). We observed changes in excess of 10% of the reported effect estimates (aORs) from the minimally sufficient regression models in 64% of the estimates reported in Table 2 (fruit and vegetable consumption of children) and in 39% of the estimates reported in Table 3 (physical activity of children). The only estimate observed to cross the threshold for statistical significance (α=0.95) in the non-pregnant population was the odds of reporting an increase in fruit and vegetable consumption among women who reported being encouraged by their children to do healthy things a few times a week, compared to only being encouraged yearly or never. This estimate differed between the entire study population of women (aOR=2.57, 95%CI 0.99 – 6.62) and the non-pregnant women (aOR=3.51, 95%CI 1.28 – 9.76) in the study population.
We examined interaction in both the total and the non-pregnant study populations using the full-regression models and observed p-values ≥ 0.14 for all interaction terms in the fruit and vegetable consumption models. In the physical activity full models, we found evidence of interaction by BMI categories among the non-pregnant population (p≤.05), and weak evidence among the total study population (p≤.10). We also observed weak evidence of interaction by race and ethnicity in the non-pregnant study population (p≥.08), but not in the full study population (p≥.32). In further examining the interaction between BMI and women reporting increased physical activity at follow-up for children in their households, we observed BMI stratum-specific crude ORs that varied (39% change) between strata (with mostly overlapping 95% CIs), and that differed from the overall crude OR, suggesting the presence of confounding and effect measure modification (EMM). Similarly, we observed evidence of both confounding and EMM by race and ethnicity on the estimate of odds of mothers reporting increased physical activity for their children at follow-up, whereby a stratum-specific crude OR varied (59% change in estimate, with imprecise and overlapping 95% CIs), and differed from the overall crude OR. We observed greater percent-changes in estimate between the stratum-specific crude odds in the full study population, as compared to the non-pregnant population.


Discussion and Health Implications
In this study, we found that four months after the wellness-coaching intervention, 59.4% of participants reported an increase in their children’s exercise behaviors and 71.9% reported an increase in their children’s FVI, with no notable difference between women randomized into the high-intensity versus the low-intensity study arms. These behavior changes reported in children indicate that wellness-coaching programs for women may impact their children’s diet and exercise behaviors in the short-term, though the long-term implication is not clear.
Research has explored parents as “agents of change” within families and has shown that women’s participation in lifestyle-change programs can have long-term positive impacts on their children’s health behaviors. Examples include an increase in children’s consumption of fruits and vegetables (longitudinal follow-up over two years)19 and the improvement of their children’s insulin resistance (longitudinal follow-up over three months).20 These studies have focused on improving lifestyle behaviors (e.g., family nutrition/eating behaviors) and parenting skills related to these behaviors. These interventions prioritized the enhancement of parental self-efficacy through increasing nutritional knowledge and parenting skills related to eating and physical-activity practices in the home environment.21,22, 23 These parent-focused studies have demonstrated improvements to the health of offspring, including: 1) decreases in offspring BMI z scores;24-28 2) parental healthy BMI change as a predictor of healthy BMI change in offspring;29 3) improvements in family weight-related parenting practices that are associated with improvements in offspring’s dietary intake;19, 25, 30 and 4) improvements in diet and activity behaviors in mothers, associated with improvements in diet and activity of offspring.31
The present data analysis found several factors that were associated with lower levels of behavior change in children. For example, we found that women who reported not having a safe place to exercise in their communities were less likely to report an increase in their children’s exercise behaviors. Some participants, such as those from the African Immigrant/Refugee community felt uncomfortable exercising in public spaces. Other studies have found that children who live in unsafe neighborhoods, as reported by their parents, engage in physical activity approximately one day less per week than children whose parents report living in a safe neighborhood.32 This finding emphasizes the importance of creating safe environments for physical activity as an important factor in increasing children’s physical activity. We also found that women who felt that fruits/vegetables took too much time to prepare were less likely to report increases in their children’s FVI. Higher rates of at-home food preparation are associated with a higher diet quality.33 Educating women about ways to reduce preparation time, and providing meal-planning resources may lead to a higher likelihood of women cooking healthy foods like fruits and vegetables in the home.34 We do not have data on women’s shopping practices or grocery budgets. Future research should assess these factors in order to more fully understand barriers/facilitators to healthy household eating behaviors.
Key strengths of the UWAG study were the CBPR framework and the employment of women from each community as wellness coaches, which helped recruit and retain diverse study participants.35 Involving community leaders as members of the research team may also have increased the number of participants who were recruited and retained through building community trust in the study. Another strength of this study was that it included participants from five different racial/ethnic groups residing in the same urban area, increasing the diversity and generalizability of the study. The two major ethnicities that were not included in this study were Caucasian and Asian individuals; these could be added in a future replication of this study.
A significant limitation of this study is the fact that assessment relied on self-report by the study’s participants. For example, the health-behavior changes in children were reported by women, as directly measuring changes in children’s behaviors was not a primary aim of the study. There were no objective data collected about physical activity in the women or children; all physical activity data were self-reported by participants. As a result of assessment based on self-report, the study’s findings may reflect some response bias, such as recall bias or social-desirability bias, if women desired to portray their family health behaviors as healthier than they were in reality. Further, assessing dietary intake at baseline and again at four months—just one time over the course of a month—is a study limitation. For example, seasonal changes in the availability of fruits and vegetables have been shown to impact servings consumed.36, 37 Another limitation of this study is the short duration of assessment; future research should assess sustainability of behavior change over longer time periods. Future research focused on children’s health behaviors should incorporate interview data with children, conducted by trained CWCs under the supervision of registered dietitian nutrionists, as well as objective measures of physical activity in both children and women. Additionally, future research should assess the role of other members of the household (e.g., significant other, other children) in the facilitation of household health-behavior changes.
This study provides some evidence that interventions targeting women may have an impact on children’s diet and exercise behaviors in the short term. Studies targeting overweight/obese parents who have overweight/obese children aged five and under are particularly needed. Hesketh and Campbell noted that interventions aimed toward children under the age of five are rare, and interventions with infants and their mothers even rarer.38 This lack of interventions is alarming, as data show how important maternal influence is on children’s health, with an effect across the lifespan.
Acknowledgements
The authors would like to acknowledge the contributions of the Coalition for a Healthier Community for Utah Women and Girls (which includes many of this paper’s authors) and the Community Wellness Coaches. This includes:
- Utah Women’s Health Coalition
- Community Faces of Utah
- Best of Africa: Valentine Mukundente
- Calvary Baptist Church: Pastor France A. Davis, Doriena Lee
- Hispanic Health Care Task Force: Sylvia Rickard (deceased), Ana Sanchez-Birkhead, Jeannette Villalta
- National Tongan American Society: O. Fahina Tavake-Pasi, Ivoni Nash
- Urban Indian Center: Eruera “Ed” Napia
- Utah Department of Health: Brenda Ralls
- University of Utah and Utah Clinical & Translational Science Institute: Stephen C. Alder, B. Heather Brown, Louisa A. Stark
- University of Utah: Grant Sunada
- Community Wellness Coaches: Claudia Gonzalez, Natalie Gutierrez, Patricia Otiede, Penelope Pinnecoose, Olga Rubiano, Esperance Rugamwa, Se Toki, Jeanette Villalta, and Cathy Wolfsfeld
- University of Utah Center of Excellence in Women’s Health: Leanne Johnston, Sara E. Simonsen, Kathleen B. Digre
- University of Utah College of Health: Patricia Eisenman
- University of Utah Department of Biomedical Informatics: Bernie LaSalle
Funding: This study was supported by a grant from the Office on Women’s Health, Department of Health and Human Services Grant number: 1CCEWH111018-01-00 (KBD and SES). This study is registered under the Coalition for a Healthier Community–Utah Women and Girls–Phase II (UWAGII); University of Utah, Center of Excellence in Women’s Health and Center for Clinical and Translational Science; and National Institutes of Health, National Center for Advancing Translational Sciences [Grant (8UL1TR000105 (formerly UL1RR025764) NCATS/NIH)] (SCA, BHB, LAS). Research reported in this publication was supported by the National Institute of Nursing Research of the National Institutes of Health under Award Number F31NR020431 (JKM). The research and content reported in this publication is solely the responsibility of the authors and does not necessarily represent the official views of the National Institutes of Health or the Office on Women’s Health. The study is registered at https://clinicaltrials.gov/ct2/show/ NCT02470156 (No. NCT02470156).
References
1. Ingram DD, Malec DJ, Makuc DM, Kruszon-Moran D, Gindi RM, Albert M, Beresovsky V, Hamilton BE, Holmes J, Schiller J, Sengupta M. National Center for Health Statistics Guidelines for Analysis of Trends. Vital Health Stat 2. 2018(179):1-71. Epub 2018/05/19. PubMed PMID: 29775435.
2. (IBIS) PHIBIS. Health Indicator Report of Overweight or Obese by Race, Utah, 2020-2021. Utah Department of Health and Human Services: Healthy Environments Active Living BoHP, Division of Disease Control and Prevention, Utah Department of Health and Human Services; 2022.
3. Stierman BA, Joseph; Carroll, Margaret D.; Chen, Te-Ching; Davy, Orlando; Fink, Steven; Fryar, Cheryl D.; Gu, Qiuping; Hales, Craig M.; Hughes, Jeffery P.; Ostchega, Yechiam; Storandt, Renee J.; Akinbami, Lara J. National Health and Nutrition Examination Survey 2017–March 2020 Prepandemic Data Files Development of Files and Prevalence Estimates for Selected Health Outcomes. http://dx.doi.org/10.15620/cdc:106273: Centers for Disease Control and Prevention, (U.S.) NCfHS; 2021 6/14/2021. Report No.
4. Whitaker RC, Wright JA, Pepe MS, Seidel KD, Dietz WH. Predicting obesity in young adulthood from childhood and parental obesity. N Engl J Med. 1997;337(13):869-73. Epub 1997/09/26. doi: 10.1056/nejm199709253371301. PubMed PMID: 9302300.
5. Mujuru P, Jean-Francois B, Pérez-Stable EJ. National Institute on Minority Health and Health Disparities Specialized Centers of Excellence on Minority Health and Health Disparities. Am J Prev Med. 2022;63(1 Suppl 1):S6-s7. Epub 2022/06/21. doi: 10.1016/j.amepre.2022.03.006. PubMed PMID: 35725142; PMCID: PMC9212883.
6. Blacksher E, Nelson C, Van Dyke E, Echo-Hawk A, Bassett D, Buchwald D. Conversations about Community-Based Participatory Research and Trust: “We Are Explorers Together”. Prog Community Health Partnersh. 2016;10(2):305-9. Epub 2016/06/28. doi: 10.1353/cpr.2016.0039. PubMed PMID: 27346777.
7. Simonsen SE, Digre KB, Ralls B, Mukundente V, Davis FA, Rickard S, Tavake-Pasi F, Napia EE, Aiono H, Chirpich M, Stark LA, Sunada G, Keen K, Johnston L, Frost CJ, Varner MW, Alder SC. A gender-based approach to developing a healthy lifestyle and healthy weight intervention for diverse Utah women. Eval Program Plann. 2015;51:8-16. Epub 2015/01/07. doi: 10.1016/j.evalprogplan.2014.12.003. PubMed PMID: 25559947.
8. Harris PA, Taylor R, Thielke R, Payne J, Gonzalez N, Conde JG. Research electronic data capture (REDCap)–a metadata-driven methodology and workflow process for providing translational research informatics support. J Biomed Inform. 2009;42(2):377-81. Epub 2008/10/22. doi: 10.1016/j.jbi.2008.08.010. PubMed PMID: 18929686; PMCID: PMC2700030.
9. Harris PA, Taylor R, Minor BL, Elliott V, Fernandez M, O’Neal L, McLeod L, Delacqua G, Delacqua F, Kirby J, Duda SN. The REDCap consortium: Building an international community of software platform partners. J Biomed Inform. 2019;95:103208. Epub 2019/05/13. doi: 10.1016/j.jbi.2019.103208. PubMed PMID: 31078660; PMCID: PMC7254481.
10. Centers for Disease Control and Prevention. About Adult BMI: Centers for Disease Control and Prevention; 2022 [cited 2023 July 31]. Available from: https://www.cdc.gov/healthyweight/assessing/bmi/adult_bmi/index.html.
11. World Health Organization. The Asia-Pacific perspective: redefining obesity and its treatment. Sydney: Health Communications Australia: Regional Office for the Western Pacific, 2000.
12. National Center for Chronic Disease Prevention and Health Promotion DoPH. Behavioral Risk Factor Surveillance System: Centers for Disease Control and Prevention; 2022 [cited 2018 September 04]. Available from: https://www.cdc.gov/brfss/index.html.
13. Textor J, van der Zander B, Gilthorpe MS, Liskiewicz M, Ellison GT. Robust causal inference using directed acyclic graphs: the R package ‘dagitty’. Int J Epidemiol. 2016;45(6):1887-94. Epub 2017/01/17. doi: 10.1093/ije/dyw341. PubMed PMID: 28089956.
14. Pearl J. Causal diagrams for empirical research. Biometrika. 1995;82(4):669-88. doi: 10.1093/biomet/82.4.669.
15. Pearl J. Causality : models, reasoning, and inference. 2nd edition. ed: Cambridge : Cambridge University Press; 2000.
16. Pearl J. Causal inference in statistics: An overview. Statistics surveys. 2009;3(none):96-146. doi: 10.1214/09-SS057.
17. Heinze G, Schemper M. A solution to the problem of separation in logistic regression. Stat Med. 2002;21(16):2409-19. Epub 2002/09/05. doi: 10.1002/sim.1047. PubMed PMID: 12210625.
18. Karabon P, Beaumont W, editors. Rare Events or Non-Convergence with a Binary Outcome? The Power of Firth Regression in PROC LOGISTIC2020.
19. Flores-Barrantes P, Iglesia I, Cardon G, Willems R, Schwarz P, Timpel P, Kivelä J, Wikström K, Iotova V, Tankova T, Usheva N, Rurik I, Antal E, Liatis S, Makrilakis K, Karaglani E, Manios Y, Moreno LA, González-Gil EM, On Behalf Of The Feel Diabetes-Study G. Longitudinal Associations between Food Parenting Practices and Dietary Intake in Children: The Feel4Diabetes Study. Nutrients. 2021;13(4). Epub 2021/05/01. doi: 10.3390/nu13041298. PubMed PMID: 33920052; PMCID: PMC8071003.
20. López-Contreras IN, Vilchis-Gil J, Klünder-Klünder M, Villalpando-Carrión S, Flores-Huerta S. Dietary habits and metabolic response improve in obese children whose mothers received an intervention to promote healthy eating: randomized clinical trial. BMC Public Health. 2020;20(1):1240. Epub 2020/08/17. doi: 10.1186/s12889-020-09339-4. PubMed PMID: 32795294; PMCID: PMC7427732.
21. Loveman E, Al-Khudairy L, Johnson RE, Robertson W, Colquitt JL, Mead EL, Ells LJ, Metzendorf MI, Rees K. Parent-only interventions for childhood overweight or obesity in children aged 5 to 11 years. Cochrane Database Syst Rev. 2015;2015(12):Cd012008. Epub 2015/12/23. doi: 10.1002/14651858.Cd012008. PubMed PMID: 26690844; PMCID: PMC8761478 EM: none known. LE: none known. MIM: none known. KR: none known.
22. Golan M, Crow S. Parents are key players in the prevention and treatment of weight-related problems. Nutr Rev. 2004;62(1):39-50. Epub 2004/03/05. doi: 10.1111/j.1753-4887.2004.tb00005.x. PubMed PMID: 14995056.
23. Golan M. Parents as agents of change in childhood obesity–from research to practice. Int J Pediatr Obes. 2006;1(2):66-76. Epub 2007/10/02. doi: 10.1080/17477160600644272. PubMed PMID: 17907317.
24. Janicke DM, Sallinen BJ, Perri MG, Lutes LD, Huerta M, Silverstein JH, Brumback B. Comparison of parent-only vs family-based interventions for overweight children in underserved rural settings: outcomes from project STORY. Arch Pediatr Adolesc Med. 2008;162(12):1119-25. Epub 2008/12/03. doi: 10.1001/archpedi.162.12.1119. PubMed PMID: 19047538; PMCID: PMC3782102.
25. West F, Sanders MR, Cleghorn GJ, Davies PS. Randomised clinical trial of a family-based lifestyle intervention for childhood obesity involving parents as the exclusive agents of change. Behav Res Ther. 2010;48(12):1170-9. Epub 2010/10/05. doi: 10.1016/j.brat.2010.08.008. PubMed PMID: 20883981.
26. Golley RK, Magarey AM, Baur LA, Steinbeck KS, Daniels LA. Twelve-month effectiveness of a parent-led, family-focused weight-management program for prepubertal children: a randomized, controlled trial. Pediatrics. 2007;119(3):517-25. Epub 2007/03/03. doi: 10.1542/peds.2006-1746. PubMed PMID: 17332205.
27. Jansen E, Mulkens S, Jansen A. Tackling childhood overweight: treating parents exclusively is effective. Int J Obes (Lond). 2011;35(4):501-9. Epub 2011/03/03. doi: 10.1038/ijo.2011.16. PubMed PMID: 21364527.
28. Magarey AM, Perry RA, Baur LA, Steinbeck KS, Sawyer M, Hills AP, Wilson G, Lee A, Daniels LA. A parent-led family-focused treatment program for overweight children aged 5 to 9 years: the PEACH RCT. Pediatrics. 2011;127(2):214-22. Epub 2011/01/26. doi: 10.1542/peds.2009-1432. PubMed PMID: 21262890.
29. Wrotniak BH, Epstein LH, Paluch RA, Roemmich JN. Parent weight change as a predictor of child weight change in family-based behavioral obesity treatment. Arch Pediatr Adolesc Med. 2004;158(4):342-7. Epub 2004/04/07. doi: 10.1001/archpedi.158.4.342. PubMed PMID: 15066873.
30. Arredondo EM, Ayala GX, Soto S, Slymen DJ, Horton LA, Parada H, Campbell N, Ibarra L, Engelberg M, Elder JP. Latina mothers as agents of change in children’s eating habits: findings from the randomized controlled trial Entre Familia: Reflejos de Salud. Int J Behav Nutr Phys Act. 2018;15(1):95. Epub 2018/10/05. doi: 10.1186/s12966-018-0714-0. PubMed PMID: 30285755; PMCID: PMC6167856.
31. Klohe-Lehman DM, Freeland-Graves J, Clarke KK, Cai G, Voruganti VS, Milani TJ, Nuss HJ, Proffitt JM, Bohman TM. Low-income, overweight and obese mothers as agents of change to improve food choices, fat habits, and physical activity in their 1-to-3-year-old children. J Am Coll Nutr. 2007;26(3):196-208. Epub 2007/07/20. doi: 10.1080/07315724.2007.10719602. PubMed PMID: 17634164.
32. Galaviz KI, Zytnick D, Kegler MC, Cunningham SA. Parental Perception of Neighborhood Safety and Children’s Physical Activity. J Phys Act Health. 2016;13(10):1110-6. Epub 2016/11/03. doi: 10.1123/jpah.2015-0557. PubMed PMID: 27254849.
33. McLaughlin C, Tarasuk V, Kreiger N. An examination of at-home food preparation activity among low-income, food-insecure women. J Am Diet Assoc. 2003;103(11):1506-12. Epub 2003/10/25. doi: 10.1016/j.jada.2003.08.022. PubMed PMID: 14576717.
34. Mook K, Laraia BA, Oddo VM, Jones-Smith JC. Food Security Status and Barriers to Fruit and Vegetable Consumption in Two Economically Deprived Communities of Oakland, California, 2013-2014. Prev Chronic Dis. 2016;13:E21. Epub 2016/02/13. doi: 10.5888/pcd13.150402. PubMed PMID: 26866947; PMCID: PMC4752515.
35. Frerichs L, Lich KH, Dave G, Corbie-Smith G. Integrating Systems Science and Community-Based Participatory Research to Achieve Health Equity. Am J Public Health. 2016;106(2):215-22. Epub 2015/12/23. doi: 10.2105/ajph.2015.302944. PubMed PMID: 26691110; PMCID: PMC4815818.
36. Button BLG, McEachern LW, Martin G, Gilliland JA. Intake of Fruits, Vegetables, and Sugar-Sweetened Beverages among a Sample of Children in Rural Northern Ontario, Canada. Children (Basel). 2022;9(7). Epub 2022/07/28. doi: 10.3390/children9071028. PubMed PMID: 35884012; PMCID: PMC9320505.
37. Stelmach-Mardas M, Kleiser C, Uzhova I, Peñalvo JL, La Torre G, Palys W, Lojko D, Nimptsch K, Suwalska A, Linseisen J, Saulle R, Colamesta V, Boeing H. Seasonality of food groups and total energy intake: a systematic review and meta-analysis. Eur J Clin Nutr. 2016;70(6):700-8. Epub 2016/01/14. doi: 10.1038/ejcn.2015.224. PubMed PMID: 26757837.
38. Hesketh KD, Campbell KJ. Interventions to prevent obesity in 0-5 year olds: an updated systematic review of the literature. Obesity (Silver Spring). 2010;18 Suppl 1:S27-35. Epub 2010/01/29. doi: 10.1038/oby.2009.429. PubMed PMID: 20107458.
Citation
Nava M, Christini K, Kepka D, Kent-Marvick J, Digre KB, Stark LA, Davis FA, Lee D, Mukundente V, Napia E, Sanchez-Birkhead A, Tavake-Pasi OF, Villalta J, Brown H, & Simonsen S. (2023). Do Interventions Targeting Women Impact Children’s Health Behaviors?. Utah Women’s Health Review. doi: 10.26054/0d-jacn-53wd
Intellectual Health During Pregnancy
Problem Statement
A pregnant person’s brain experiences incredible changes during and after pregnancy. Although there are numerous physical changes to the body during pregnancy, the intellectual changes impact brain structure and are not visibly noticeable. These structural changes related to the domain of intellectual health. Intellectual health includes a pregnant person’s processing and memory abilities and the capacity to engage in creative, independent, and critical thoughts.1 Further, these adjustments – often referred to as “pregnancy brain” – could include impacts to memory, concentration, and executive functioning.2 Studies suggest that “pregnancy brain” is the brain’s way of shutting off unnecessary functions, and instead prioritize functions necessary for the pregnant person to transition into parenthood, such as the ability to anticipate the offspring’s needs.3 This phenomenon, referred to as pruning, may even account for more efficient brain circuits.4 In this commentary, we will outline the current research on the effects of pregnancy on pregnant people’s intellectual health and brain functioning, while noting the limited literature available on this topic. We then propose potential next steps, which include expanding resources to support expecting parents and calling for additional research on the topic of supporting intellectual health during and after pregnancy.
Status of Literature
While limited, the available literature that focuses on intellectual health during and after pregnancy further explores the negative and positive effects that take place associated with changes in brain structure and function. One study determined that “test results demonstrate deficits in learning and memory tasks, as well as in attention and language abilities during pregnancy”.2 These deficits occurred most often during the second and third trimesters by the effects of “hydrocortisone on acquisition and consolidation of information” and an increase in sex hormones.2 Another study indicated that during pregnancy, it was common for the hypothalamus to shrink, a key indicator of overall brain health and short- and long-term memory capabilities.5
On the other hand, a decrease in brain matter also resulted in benefits for the pregnant person. Even though the brain of a pregnant person did shrink and some areas had a decrease in grey matter during the end of pregnancy, the brain refocused on others areas as it began to infer and predict what the infant’s needs would be.6 The common misconception is that the loss of grey matter during pregnancy has only negative affects, when in reality the brain is adjusting for more concise circuits and connections.4
It is also important to note that while there is limited literature on the changes to intellectual health during and after pregnancy, interventions specific to this population are lacking. Therefore, we propose several solutions in our call to action.
Call to Action
Intellectual health changes due to pregnancy are frequently understudied. Therefore, we recommend an increase in basic research about intellectual changes due to pregnancy. This research should address physiologic and cognitive changes, their short- and long-term risks and benefits, and subsequent impacts on quality of life.
Another important step in creating positive change is an increased emphasis on development of high-quality, evidence-based health education materials about cognitive changes due to pregnancy. This material should consider health literacy challenges of target populations, emphasizing communication quality and addressing access barriers through involvement of trusted community partners. Thus, implementation research is needed to identify best practices and assess population-level impact, especially as studies suggest these changes may be lifelong.7
Since existing research is limited, an emphasis should be placed on further exploring ways to support intellectual health as pregnancy-related changes occur. We have briefly outlined changes occurring within the brain due to pregnancy and their potential impact immediately and into the future. As a result, we advocate for additional basic and applied research regarding intellectual health within the context of pregnancy.
References
- Frost CJ, Digre KB. 7 Domains of Women’s Health: Multidisciplinary Considerations of Women’s Health in the 21st Century. Dubuque, IA: Kendall Hunt Publishing Company; 2016.
- Barda G, Mizrachi Y, Borokchovich I. et al. The effect of pregnancy on maternal cognition. Sci Rep 11, 12187 (2021). https://doi.org/10.1038/s41598-021-91504-9
- Hoekzema E, Barba-Müller E, Pozzobon C, et al. (2017). Pregnancy leads to long-lasting changes in human brain structure. Nature neuroscience, 20(2), 287–296. https://doi.org/10.1038/nn.4458
- Wnuk A. How Pregnancy Changes the Brain. www.brainfacts.org. https://www.brainfacts.org/brain-anatomy-and-function/body-systems/2018/how-pregnancy-changes-the-brain-022818. Published February 28, 2018. Accessed April 30, 2023.
- Duarte-Guterman P, Leuner B, Galea LAM. The long and short term effects of motherhood on the brain. Front Neuroendocrinol. 2019;53:100740. doi:10.1016/j.yfrne.2019.02.004
- Gritters J. This is your brain on motherhood. The New York Times. https://www.nytimes.com/2020/05/05/parenting/mommy-brain-science.html. Published May 5, 2020. Accessed May 1, 2023.
- Martínez-García M, Paternina-Die M, Barba-Müller E, et al. Do Pregnancy-Induced Brain Changes Reverse? The Brain of a Mother Six Years after Parturition. Brain Sciences. 2021;11(2):168. doi:https://doi.org/10.3390/brainsci11020168.
Citation
Harward A, Nuncio Zúñiga A, & Greenwood L. (2023). Intellectual Health During Pregnancy. Utah Women’s Health Review. doi: 10.26054/0d-5xs5-j0v0
Menstrual Cycle’s Effect on Women’s Intellectual Health
Problem Statement
Menstruation affects girls and women starting as young as ten years old and can involve various aspects of a girl’s life. Some of the most common symptoms of the menstrual cycle are bloating, bleeding, mood swings, feeling irritable, and more.1 These symptoms vary in intensity and frequency; no two periods are the same. The average period happens once a month, and lasts for about 7 days.1 The menstrual cycle is something female bodies naturally adapt to, but depending on severity, it can affect many aspects of an individual’s life. Specifically, those who menstruate are more likely to have their school performance affected due to shame and stigma, lack of period products, hormones affecting one’s concentration, and more.
Status of the Literature
Missing school due to menstruation is something that can have a significant impact on the intellectual health of women and girls. For example, in a study given to teachers, researchers found that “teachers perceived the menstrual cycle to affect Physical Education (88%), pupil confidence (88%), school attendance (82%) and attitude and behavior (82%). Teachers also perceived the menstrual cycle to influence multiple aspects of school attendance and personal performance”.2 In addition, another study in Africa showed that “one in ten girls missed school while on their period, and that 50 percent of girls miss between 1 and 4 days of school every month due to menstruation”.3 It is common for schools to lack proper supplies for menstruation nor offer any female hygiene products at all.
However, some efforts have been put in place to raise awareness for how menstruation affects women and girls. Specifically, the “Menstrual Hygiene Day” was launched to raise awareness about the need for adequate and sufficient menstrual hygiene management for adolescent girls in schools and beyond. The efforts of these awareness campaigns is to advocate for and break taboos and stigma surrounding menstruation.3 Schools around the United States have started programs to offer feminine hygiene products in bathrooms, so students do not miss school due to a lack of supplies. Unfortunately, women and girls who live in poverty are affected by lack of menstrual products at a much higher rate. Although availability of menstruation products in girls bathrooms is now an option, this does not mean they are always free. The United States is a high-income country where low-income folks struggle to meet their needs; however, only 17 states in the U.S. have passed laws that require schools to give access to period products for free, leaving 33 states vulnerable.4
Feminine hygiene products contribute to a significant component of how menstrual cycles negatively impact women’s intellectual health. A study on female college students found that 14.2% of women in the sample size had experienced period poverty in the last year, with 10% experiencing it each month.5 This study also analyzed the correlation between period poverty and women’s mental health. Results showed that women who experienced period poverty every month showed the most severe symptoms of depression.5 Mental health and intellectual health have a strong correlation because it can affect one’s motivation, productivity, and focus.
Unfortunately, period poverty is also a global crisis. For example, in Tanzania, period poverty is the single largest barrier to young girls completing their education.6 In Tanzania, many young women cannot afford disposable pads. In efforts to replace pads and tampons, women have used cow dung, mattresses, and feathers to stop their bleeding.7 In addition, the schools do not offer safe places for women to change their disposable pads or provide alternatives to home learning.6 In effect, these young women stay home due to deep shame, mental health struggles, and health risks from using unsanitary menstruation products. It’s no surprise that the young girls in Tanzania fall behind in their schoolwork, for a period does not stop after only one month.
Call To Action
Understanding and spreading awareness about menstruation can help increase ways for women and girls to be supported intellectually. Additionally, learning about varying menstruation experiences can allow for openings to new outcomes. For example, a study conducted by Boyle and colleagues looked at the positive effects of menstruation on academic performance. Specifically, Boyle found that “although most significant relationships were negative between menstruation and academic performance, scores positively predicted grades in English, Math, Art, History, and Study of Society”.8 This study showed menstruation to have a positive impact on academic performance rather than negative. Although there is an overall lack of studies on how menstruation positively impacts women’s intellectual health, this study serves as a call to action. It is crucial to continue looking at the correlations between menstruation and intellectual health. By understanding how periods affect female bodies in both negative and positive ways, new systems can be presented to better support women academically.
References
1. NHS Choices. (2019). Overview – Periods. NHS. https://www.nhs.uk/conditions/periods/
2. Brown, N, Williams, R, Bruinvels, G, Piasecki, J, & Forrest, LJ. (2022, February). Teachers’ perceptions and experiences of menstrual cycle education and support in UK schools. Frontiers. Retrieved November 28, 2022, from https://www.frontiersin.org/articles/10.3389/fgwh.2022.827365/full
3. Khan, M. (2022, May 27). Menstrual Health and hygiene: What role can schools play? World Bank Blogs. Retrieved November 28, 2022, from https://blogs.worldbank.org/education/menstrual-health-and-hygiene-what-role-can-scho ols-play#:~:text=Menstruation%20affects%20girls’%20attendance%20and,every%20mon th%20due%20to%20menstruation.
4. Long, C. (2022, August 23). Free period products are now available in public schools. UPR Utah Public Radio. https://www.upr.org/utah-news/2022-08-23/free-period-products-available-to-public-scho ol-students-beginning-this-semester
5. Cardoso, LF, Scolese, AM, Hamidaddin, A, & Gupta, J. (2021). Period poverty and mental health implications among college-aged women in the United States. BMC Women’s Health, 21(14). https://doi.org/10.1186/s12905-020-01149-5
6. Lynd M. Period Poverty and Education | School-to-School International. Published 2021. https://sts-international.org/sts-blog/period-poverty-education/
7. Mimi ni Tai. (n.d.). Elle Peut Naidim. Retrieved November 30, 2022, from http://www.epn.or.tz/miminitai
8. Boyle GJ (2017). Effects of menstrual cycle moods and symptoms on academic performance: a study of senior secondary school students. The British journal of educational psychology, 67 ( Pt 1), 37–49. https://doi.org/10.1111/j.2044-8279.1997.tb01225.x
Citation
Spackman L & Artega A. (2023). Menstrual Cycle’s Effect on Women’s Intellectual Health. Utah Women’s Health Review. doi: 10.26054/0d-266g-hzp8
Reproductive Health Literacy Among Adolescent Women in Utah
Problem Statement
The adolescent brain is not fully developed until at least 25 years of age.1, 2, 3 This is especially apparent for the parts of the brain that control judgment and impulsiveness.1 As this relates to reproductive health, inadequate reproductive health literacy is a concern for female adolescents ages 12–18 in Utah. If adolescents do not have knowledge about how the reproductive health system works, then they may be unlikely to identify signs of fertility and are at greater risk of an unintended pregnancy, which leads to other adverse social and health outcomes for the mother and child.4
Reproductive health literacy is an important aspect of the status of sexual education in Utah because the state limits sexual education to abstinence-only.5 Ensuring adolescents have knowledge of reproductive health is part of all domains of health, including intellectual health. The more education a woman has, the more likely she can understand her reproductive health system, including her fertility. Curriculum changes that include more comprehensive sexual education, which incorporate fertility awareness-based methods (FABMs), are one approach to help adolescents understand hormonal fluctuations and cycle-related experiences as well as avoid unintended pregnancies. Having empowering knowledge on how the reproductive system works through charting with FABMs can help adolescents choose to engage in other activities during their fertile window that do not lead to sexual intercourse, or to choose other contraceptive measures that can prevent unintended pregnancies.
Status of the Literature
Health literacy improves health outcomes across generations.6,7 The Centers for Disease Control and Prevention (CDC) found that 40% of high school students across the U.S. engaged in sexual intercourse and 54% of those sexually active did not use a condom the previous time they had sex.8 Healthy sexuality, free of shame and stigma, paired with information to make the best decisions for themselves and their partners, is an important goal. For instance, some studies have found that many high school students rely on information about sexual and reproductive health received from peers9,10 and not what they learn from trained educators, which is insufficient. When adolescent women have low reproductive health literacy, they are at a higher risk for unintended pregnancy.4
Various studies have found that sexual and reproductive health education serves as a protective factor against adolescent pregnancies.10,11,12 Furthermore, the American Association of Pediatrics (AAP), American College of Obstetricians and Gynecologists (ACOG), and American Academy of Family Physicians (AAFP) encourage pediatricians, schools, and parents to provide developmentally-appropriate and evidence-based education about human sexuality and reproduction to adolescents because it has been shown to reduce the risk of pregnancy.13,14,15 The CDC also supports this approach to reducing pregnancy risk for adolescents by providing recommendations for schools about how they can deliver quality sexual health education, such as helping students to take responsibility to improve their health outcomes.16 However, Utah’s current state of sexual education focuses on the benefits of abstinence and prohibits discussions around any form of contraception.5
In Utah, 85% of schools report abstinence as a topic in their sexual education programs.8 In contrast to the U.S. as a whole, other topics of discussion where Utah falls short include the importance of correct and consistent condom usage, the efficacy of condoms, and methods of contraception other than condoms. 8 Only 0–23% of Utah schools discuss these topics, compared to 27–45% of schools across the U.S.8 It can be argued that the topics allowed in Utah’s sexual education curriculum influence the outcomes of the pregnancy rate for female adolescents. Although Utah’s adolescent pregnancy rate for women ages 15–19 was 9.2% in 2021, this figure is lower than the U.S. average of 13.9%.17
Currently, Utah has two programs tailored to adolescent populations (ages 10-19) in the juvenile justice and foster care systems: the Sexual Risk Avoidance Education program and the Personal Responsibility Education program. Both are intended to educate adolescents on abstinence and contraception.17,18 Including FABMs in the full range of contraceptive options is warranted, as they help increase understanding about menstrual cycle parameters, fertility, and hormonal fluctuations that may influence individuals’ lived experiences. They are also an alternative for preventing pregnancy when users receive adequate training.19
Research on the inclusion of FABMs in reproductive health education for adolescents and their impact on adolescent behavior is limited. A 2005 study showed that adolescents enrolled in the Teen STAR program were about 9% less likely to initiate sexual behavior compared to those who were in the control group.20 While this study was more than 15 years ago, Teen STAR continues to offer educational programs to teenagers based in the science of the Billings Ovulation Method, an FABM that requires users of the method to track daily cervical mucus sensations to identify their window of fertility each menstrual cycle.21
Call to Action
One way to enhance adolescent knowledge of reproductive health, so that they can feel empowered, is via FABMs, which are a natural way to understand one’s own menstrual cycle, alternations in hormones, and fertile window. Adolescents can find information about these methods through organizations like FACTS About Fertility, which regularly provides a low-cost webinar for teenagers to learn the basics of charting their cycles using a FABM. However, at this time, more research on Teen STAR in addition to other FABMs targeted at adolescents such as TeenFEMM are needed regarding the effectiveness in avoiding unwanted pregnancies before rolling out in reproductive health education programs, including programs in Utah. Incorporating FABMs in school-based health education policy at the state and local level through existing programs and guiding adolescents to implement FABMs into practice has the potential to enhance reproductive health literacy of Utah’s adolescents.
References
- Strasburger, VC, Zimmerman, H, Temple, JR, Madigan, S. Teenagers, sexting, and law. 2019 May 1; Pediatrics, 143(5). https://doi.org/10.1542/peds.2018-3183
- Vijayakumar, N, Op de Macks, Z, Shirtcliff, EA, Pfeifer, JH. Puberty and the human brain: Insights into adolescent development. 2018 July 1; Neuroscience & Biobehavioral Reviews, 92: 417-436. https://doi.org/10.1016%2Fj.neubiorev.2018.06.004
- Arain, M, Haque, M, Johal, L, Mathur, P, Wynand, N, Rais, A, Sandhu, R, Sharma, S. Maturation of the adolescent brain. 2022 December 7; Neuropsychiatric Disease and Treatment, 9: 449-461. http://dx.doi.org/10.2147/NDT.S39776
- França, AS, Pirkle, CM, Sentell, T, Velez, MP, Domingues, MR, Bassani, DG, Câmara, SMA. Evaluating health literacy among adolescent and young adult pregnant women from a low-income area of northeast Brazil. 2020 December; International Journal of Environmental Research and Public Health, 17(23): 8806. http://dx.doi.org/10.3390/ijerph17238806
- Centers for Disease Control and Prevention (CDC). Analysis of state health education laws: Utah summary report. Centers for Disease Control and Prevention. 2017 December. https://www.cdc.gov/healthyyouth/policy/pdf/summary_report_factsheets/Utah.pdf. Accessed November 30, 2022.
- Corrarino, JE. Health literacy and women’s health: challenges and opportunities. 2013 April 30; Journal of Midwifery & Women’s Health, 58(3): 257-264. https://doi.org/10.1111/jmwh.12018
- Fleary, SA, Joseph, P, Pappagianopoulos, JE. Adolescent health literacy and health behaviors: a systematic review. 2017 November 25; Journal of Adolescence, 62:116-127. https://doi.org/10.1016/j.adolescence.2017.11.010
- Centers for Disease Control and Prevention (CDC). School health profiles 2018: Characteristics of health programs among secondary schools. 2019; Centers for Disease Control and Prevention. https://www.cdc.gov/healthyyouth/data/profiles/pdf/2018/CDC-Profiles-2018.pdf. Accessed November 30, 2022.
- Kyielleh, JM, Tabong, PT, Konlaan, BB. Adolescents’ reproductive knowledge, choices, and factors affecting reproductive health choices: A qualitative study in the West Gonja District in Northern region, Ghana. 2018 January 24; BMC International Health and Human Rights, 18(6). https://doi.org/10.1186/s12914-018-0147-5
- Vongxay, V, Albers, F, Thongmixay, S, Thongsombath, M, Broerse, JE, Sychareun, V, Essink DR. Sexual and reproductive health literacy of school adolescence in Lao PDR. 2019 January 16; PLOS One, 14(1). https://doi.org/10.1371/journal.pone.0209675
- Fonner, VA, Armstrong, KS, Kennedy, CE, O’Reilly, KR, Sweat, MD. School based sex education and HIV prevention in low- and middle-income countries: A systematic review and meta-analysis. 2014 March 4; PLOS One, 9(3). https://doi.org/10.1371/journal.pone.0089692
- Wangamati, CK. Comprehensive sexuality education in sub-Saharan Africa: adaptation and implementation challenges in universal access for children and adolescents. 2020 December 9; Sexual and Reproductive Health Matters, 28(2). https://doi.org/10.1080/26410397.2020.1851346
- Breuner, CC, Mattson, G, American Academy of Pediatrics (AAP) Committee on Adolescence, AAP Committee on Psychosocial Aspects of Child and Family Health. Sexuality education for children and adolescents. 2016 August 1; Pediatrics, 138(2). https://doi.org/10.1542/peds.2016-1348
- American College of Obstetricians and Gynecologists (ACOG) Committee on Adolescence, AAP Committee on Psychosocial Aspects of Child and Family Health. Comprehensive sexuality education. Committee Opinion No. 678. 2016 November; Obstetrics and Gynecology, 128: 227-230. https://www.acog.org/clinical/clinical-guidance/committee-opinion/articles/2016/11/comprehensive-sexuality-education
- American Academy of Family Physicians (AAFP). Adolescent health care, sexuality, and contraception. 2020. https://www.aafp.org/about/policies/all/adolescent-sexuality.html. Accessed April 10, 2023.
- Centers for Disease Control and Prevention (CDC). What Works in Schools: Sexual health education. 2023 March 13; Centers for Disease Control and Prevention. https://www.cdc.gov/healthyyouth/whatworks/what-works-sexual-health-education.htm. Accessed April 10, 2023.
- Utah Department of Health and Human Services. Complete health indicator report of adolescent births. Public Health Indicator Based Information System (IBIS): Utah’s Public Health Data Resource. https://ibis.health.utah.gov/ibisph-view/indicator/complete_profile/AdoBrth.html. November 14, 2022. October 22, 2021. Accessed November 30, 2022.
- Utah Department of Health and Human Services. How we are addressing the problem. n.d. https://mihp.utah.gov/uncategorized/how-we-are-addressing-the-problem. Accessed June 23, 2023.
- Duane, M, Stanford, J, Porucznik, C, Vigil, P. Fertility awareness-based methods for women’s health and family planning. 2022 May 24; Frontiers in Medicine, 9(858977). https://doi.org/10.3389/fmed.2022.858977
- Vigil, P, Riquelme, R, Rivadeneira, R, Aranda, W. Effects of Teenstar, an abstinence only sexual education program, on adolescent sexual behavior. 2005 October; Revista Médica de Chile, 133(10): 1173-1182. http://dx.doi.org/10.4067/S0034-98872005001000006
- Teen STAR. Our history. n.d. https://www.teenstar.org/history.html. Accessed April 10, 2023.
Citation
Waechtler L. (2023). Reproductive Health Literacy Among Adolescent Women in Utah. Utah Women’s Health Review. doi: 10.26054/0d-32cm-2k4h
Women in Post-Secondary Education: Utah Fails to Thrive
Problem Statement
This commentary will outline the education levels of women in Utah including trends, failures to progress, and confounding factors. Utah has one of the largest graduate degree gender gaps in the country.1
While the definition of education can be rather subjective, for the purposes of this commentary we will divide educational attainment among adults into the following categories: less than high school; high school graduate (includes equivalency); some college; Associate’s degree; Bachelor’s degree; and Graduate or Professional degree.2
In 2016 the percentage of students who attended public schools and graduated with a traditional diploma, 4 years after beginning the 9th grade, was 84.1% worldwide.3 The Healthy People 2030 goals includes a desire to increase this level of education to 90.7%.3 In Utah, 6.6% of women have earned less than a high school degree, 23.4% hold a high school or equivalent degree, 26.5% have completed some college, 10.8% hold an associate’s degree, 23.5% have a bachelor’s degree, and 9.3% have a graduate or professional degree.2
Status of the Literature
Education has been strongly correlated with health status as those with higher levels of education often have higher income, improved mental health, a strong social support network, a lower risk of death later in life, and a deeper understanding of disease and preventative health habits.2,3 Education is a prominent and crucial topic often discussed in many public health domains across the globe, including women’s health.
According to the U.S. Census Bureau, national trends show women earn more bachelor’s degrees than men, 20.6% to 19.8% respectively. Utah exceeds those numbers with 23.0% of women and 22.6% of men earning bachelor’s degrees. Interestingly enough, Utah women fall behind when it comes to graduate and professional degrees. The percentage of women earning a graduate degree in the U.S. is about 13% but in Utah that percentage stands at 9.3%.4
Utah women are aggressively falling behind their counterparts across the country even though they highly desire graduate degrees.5 According to a study conducted by Utah State University (USU), where 907 college enrolled women participated, nearly half of them indicated they planned to attend graduate school.5 This leaves us with the burning question; why are only 9.3% of women in Utah actually achieving this goal?
Call to Action
It seems as though ambition or intention is not an issue for women in Utah so there must be other barriers influencing their ability to earn a graduate degree. According to USU, women enrolled in graduate degree programs in Utah are older, more ethnically diverse, likely to cohabitate or have a child, and struggle with managing family responsibilities while obtaining a higher education.5
Many companies discuss “work-life” balance and prioritize this mindset for their employees as burnout has become a more prominent issue, particularly within healthcare fields as a result of the pandemic. However, this same mentality is not often discussed or prioritized for graduate students, who are more often than not, juggling careers, families, and attending graduate school full time.5 This balancing act plays a major role in the percentage of women who hold graduate degrees in Utah. Undergraduates often do not face the same balancing act challenges of graduate students and this is reflected in the number of women who complete their degree programs, 23.5% and 9.3% respectively.2
There are many resources available to graduate school students including childcare, scholarships, fellowships, housing, transportation, healthcare, grants, and continued educational support.6 We need to raise awareness and create paths to overcome the perceived barriers of attending and successfully completing graduate school. We must move forward, empower, and provide women in Utah with the resources they need to follow their ambition, achieve their academic goals, and close the graduate degree gender gap.
In Utah, the issue is not lack of resources but rather a failure by Utah academic institutions to adequately get the word out to potential undergraduate and graduate students on how and where to access these resources. Resources should be well advertised in application materials so that potential students can assess whether they will have the necessary resources to accomplish their goals prior to applying for a program or at the very least prior to deciding to enroll. Graduate students need continuous support in order to balance their academics, personal life, and careers effectively. While there is an immense amount of work to be accomplished on this topic, graduate school is not the only way we can improve health outcomes and increase life expectancy. Education should be a universal opportunity and all forms of education will increase the health and wellness of our communities.
References
- Utah Public Radio | By Clayre Scott. “Utah Has the Biggest Graduate Degree Gender Gap in the Country.” UPR Utah Public Radio, Utah Public Radio , 5 Oct. 2022, https://www.upr.org/utah-news/2022-10-05/utah-has-the-biggest-graduate-degree-gender– gap-in-the-country.
- Utah Department of Health. “Complete Health Indicator Report of Utah Population Characteristics: Education Level in the Population.” IBIS, Utah Department of Health , 29 Mar. 2022, https://ibis.health.utah.gov/ibisph-view/indicator/complete_profile/EduLevPop.html.
- U.S. Department of Health and Human Services . “Increase the Proportion of High School Students Who Graduate in 4 Years – AH‑08.” Increase the Proportion of High School Students Who Graduate in 4 Years – AH‑08 – Healthy People 2030, Office of Disease Prevention and Health Promotion, 2021, https://health.gov/healthypeople/objectives-and-data/browse-objectives/adolescents/incre ase-proportion-high-school-students-who-graduate-4-years-ah-08.
- Bureau, U.S. Census. Explore Census Data, U.S. Census Bureau , 2021, https://data.census.gov/.
- University, Utah State. “Utah Women Pursuing Higher Education Face Challenges.” Welcome To Utah State University, Utah State University , 21 Sept. 2022, https://www.usu.edu/today/story/utah-women-pursuing-higher-education-face-challenges.
- The University of Utah. “Resources Hub.” Resources Hub – Graduate School – The University of Utah, https://gradschool.utah.edu/resources-hub/index.php.
Citation
Turner E. (2023). Women in Post-Secondary Education: Utah Fails to Thrive. Utah Women’s Health Review. doi: 10.26054/0d-366k-gegc
Socio-Demographic Disparities in SARS-CoV-2 Illness Severity; Utah, 2020
Abstract
Objectives: To describe differences in COVID-19 illness severity by race, ethnicity, age, and gender in a Utah population-based sample by examining the likelihood of severe outcomes along an expanded illness severity index.
Methods: This cross-sectional study uses clinical records of individuals tested for SARS-CoV-2 between March 10, 2020, and July 10, 2020, at University of Utah Health facilities. We utilized descriptive statistics and adjusted multinomial logistic regression to assess associations between demographic characteristics and COVID-19 illness severity.
Results: Of the 6445 individuals eligible for this study, 53.3 percent identified as female; 12.6 percent were ≥ 65 years of age; and 61.0 percent identified as White, non-Hispanic or Latino (WNH). Compared to WNH, racial and ethnic minoritized groups had a higher adjusted odds ratio (aOR) of receiving emergency department care or hospitalization (aOR =1.83 [95% CI: 1.09, 3.07]; aOR = 7.11 [95% CI: 2.90, 17.43], respectively). Compared to patients younger than 65 years, patients 65 years or older had a higher probability of receiving emergency department care or hospitalization (aOR =2.94 [95% CI: 1.46, 5.96]; aOR = 10.24 [95% CI: 5.53, 18.97], respectively). Male individuals, as compared to female, had similar probability of receiving emergency department care or hospitalization (OR = 0.72 [95% CI: 0.52, 1.0] and OR = 1.06 [95% CI: 0.80, 1.46], respectively).
Conclusions: We found that COVID-19 illness severity varied by race, ethnicity, and age characteristics in Utah, with greater illness severity disproportionately impacting racial and ethnic minoritized groups and those of greater age. We did not detect differences by gender in this sample.
Introduction
In mid-December 2019, a novel Coronavirus–SARS-CoV-2–was identified in a cluster of patients in Wuhan, Hubei Province, China.1,2 This virus quickly spread internationally, prompting the World Health Organization (WHO) to declare Novel Coronavirus Disease (COVID-19) a global pandemic on March 11, 2020.3 Now, more than 3 years after its initial detection and identification, over 100 million cases of COVID-19 have been identified in the United States, resulting in over 1 million deaths.4
While disease transmission and mortality are mitigated through vaccination and standard non-pharmaceutical interventions (i.e., physical distancing, masking, etc.), inequitable access to interventions, testing, and treatments combined with existing health disparities have allowed the burden of COVID-19 to persist. While health inequities vary geographically, racial and ethnic minoritized groups, including Black or African-Americans and Hispanic or Latino populations, bear a disproportionate burden of COVID-19-related health disparities, such as infection, morbidity, and mortality. Compared to White, non-Hispanic or Latino (WNH) individuals, racial and ethnic minoritized groups are more likely to contract COVID-19 due to living in higher-density residences and working in occupations requiring in-person presence.9, 11-14. These underserved communities also have reduced access to COVID-19 testing services.10,15
Racial and ethnic minoritized individuals have been identified as having more severe COVID-19 outcomes, such as hospitalization and death, compared to WNH.5-7, 7-19 While limited access to healthcare overall can partially explain race and ethnic disparities in COVID-19 morbidity and mortality,9,16 more detailed insights into COVID-19 outcome disparities are limited. Most studies focus on three levels of illness severity: testing positive, hospitalization, and mortality. The limited literature does not adequately address the severity variation experienced in non-hospitalized individuals.16,18,20
Given that racial and ethnic minoritized groups constitute over a quarter of the population in the United States,21 an understanding of how such populations are affected by COVID-19 illness severity is of great public health importance. Without knowledge of race and ethnicity’s effects on the risk of severe illness, targeted surveillance and preventive interventions for at-risk populations are hampered. Understanding the relationship between race, ethnicity, and COVID-19 severity will reduce modeling errors for COVID-19, increase targeted and effective allocation of public health assistance and outreach, and reduce COVID-19-related morbidity and mortality.6
To address prior knowledge gaps, this study aims to describe differences in COVID-19 outcome severity by race, ethnicity, and related sociodemographic factors in a Utah population-based sample with minimal selection bias.
Methods
Study Design and Sample Population
We conducted this retrospective cross-sectional study using clinical data of individuals tested for SARS-CoV-2 infections by the University of Utah’s academic healthcare system from March 10, 2020, to July 10, 2020. University of Utah Health, based in Salt Lake City, Utah, is an extensive healthcare network that oversees five regional hospitals and over 100 health centers and institutes, and 26 of these facilities interacted with COVID-19-positive individuals during the testing period.22 As a major referral center for the Intermountain West, University of Utah Health’s patient population comprises Utah and non-Utah residents. University of Utah IRB approval was obtained prior to the start of this study. We extracted clinical and demographic data from the University of Utah Electronic Data Warehouse. The clinical data used in this study included SARS-CoV-2 testing unit location and results; indications of select comorbidities; an indication of mechanical ventilation; an indication of in-hospital death (measured up to July 10, 2020); a general patient classification (outpatient, inpatient, emergency, institutional series, etc.); and admission and discharge date and time. Additionally, demographic data included self-reported race, ethnicity, gender identity, and age.
COVID-19 Predictors
The primary predictors of COVID-19 severity explored in this study were race, ethnicity, gender identity, and age. We explored multiple race and ethnicity combinations using self-reported race and ethnicity responses. The most granular race and ethnicity combination had 8 distinct responses. We created a collapsed race and ethnicity combination using this granular combination for statistical modeling and to protect patient confidentiality, as some demographic categories had limited observations (Table 1).
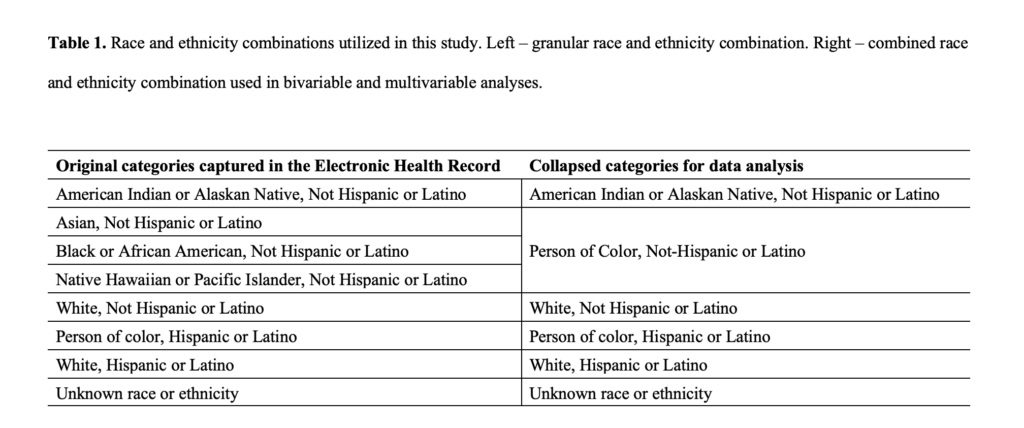
COVID-19 Outcome
We developed a COVID-19 severity index using the information on admission and discharge units, length of stay, indications of ventilation, and indications of mortality. This severity index had 5 non-overlapping, independent levels. These levels, from least severe to most severe, were as follows: negative SARS-CoV-2 test, positive diagnostic test and outpatient care (outpatient), positive diagnostic test and emergency department (ED) care, positive diagnostic test and hospitalization (hospitalization), and positive diagnostic test and in-hospital mortality (death). A novel aspect of this severity index includes outpatient and ED care. Outcome categorization heavily relied on patterns in admission and discharge units and indications of ventilation and mortality. However, when these were unknown, illness severity assignment was made using responses in clinical variables. Individuals were sorted based on the highest level of care received. For example, individuals who were first tested in the ED and subsequently hospitalized were categorized as hospitalized. The individuals first tested in an outpatient setting who later died while under hospital care were classified as in-hospital death, and so on.
Inclusion and Exclusion
Individuals who tested positive but did so while seeking care for another condition (e.g., pre-surgery testing) were removed from the sample, as our objective for this study was to evaluate COVID-19 severity among individuals seeking care due to the virus. Basic information on admission, disposition, or patient type was excluded from the analysis. It should be noted that all individuals who tested negative for the virus were included only in the descriptive analysis and were removed during inferential statistics. These individuals who tested negative were also removed during the length of stay analysis. Similarly, those who identified as non-binary or did not disclose their gender were removed from inferential analysis due to low frequency.
Statistical Methods
The associations between sociodemographic characteristics and COVID-19 illness severity were analyzed using standard cross-tabulation methods, with all categorical results reported in frequencies and percentages. Length of stay for all severity levels was characterized using medians, interquartile ranges, and ranges. We used multivariable logistic regression to generate odds ratios (95% CI) on associations between race, ethnicity, and gender and the likelihood of ED and inpatient hospitalization care. Reference categories for gender, age, and race and ethnicity were as follows: female, 18 to 25 years of age, and WNH. Model fit was assessed using Akaike Information Criterion (AIC). Adjusted multinomial logistic regression was employed to assess demographic predictors of COVID-19 death using the same reference categories for gender, age, and race and ethnicity. We report missing values for our predictors and outcomes. All models were a complete case analysis. We used Stata (StataCorp. 2021. Stata Statistical Software: Release 17. College Station, TX: StataCorp LLC) for all analyses.
Results
Characterization of Sample
Of the 70,913 tested for SARS-CoV-2 from March 10, 2020, to July 10, 2020, 6470 adults tested positive for SARS-CoV-2, and 6445 were eligible for this study. Of the 6445 individuals eligible for this study, race and ethnicity were known for 4829 (85.8%), gender identity was known for 6424 (83%), and age was known for all (100%). There were 25 deaths before discharge, leaving a sample of 6420 for the multivariable analyses. Just over half of the sample population identified as female (53.3%). 12.6 percent of the sample population was 65 years or older during testing. Finally, most individuals in this sample identified as WNH (61.0%) (Table 1).
An overall percent positivity of 9.1 percent was observed in this population between March 10, 2020, and July 10, 2020. Notably, all non-White individuals (23.1%) exhibited a proportionally higher percent positivity than WNH individuals (3.9%). Individuals who identified as female had a slightly lower percent positivity than those who identified as male (8.2%, 10.1%, respectively). Individuals who identified as non-binary or did not disclose their gender had the highest percent positivity of the strata (16.9%) (Table 2).
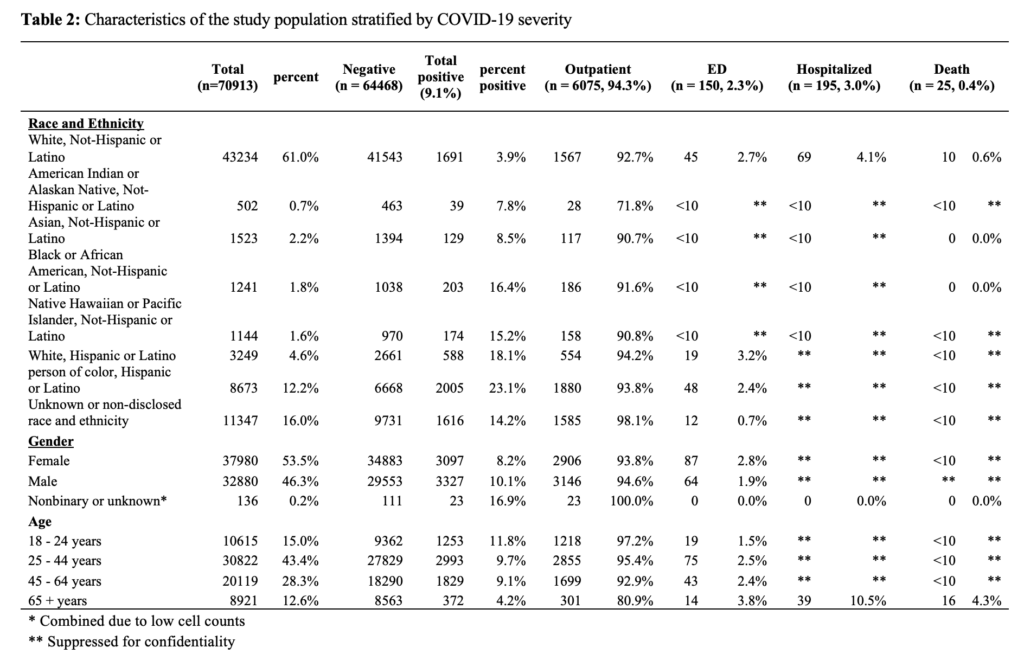
Out of the 6445 individuals who tested positive for SARS-CoV-2, 6075 (94.3%) received outpatient care, 150 (2.3%) received care in the emergency department, 195 (3.0%) were hospitalized, and 25 (0.04%) individuals died in hospital (Table 3).
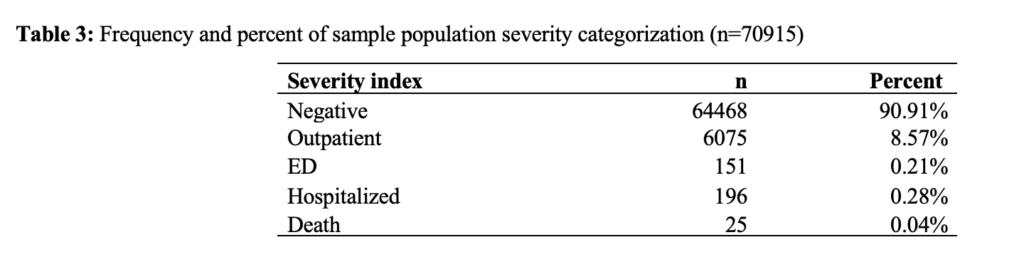
Length of stay in care by type of care for this study population was as follows: outpatient (median=13 hours, IQR=4 hours), emergency department (median=4 hours, IQR=7 hours), inpatient hospitalization (median=52 hours, IQR=98 hours), patients requiring ventilation (median=285 hours, IQR=671), and those patients who died in hospital (133 hours, IQR=186) (Table 4).
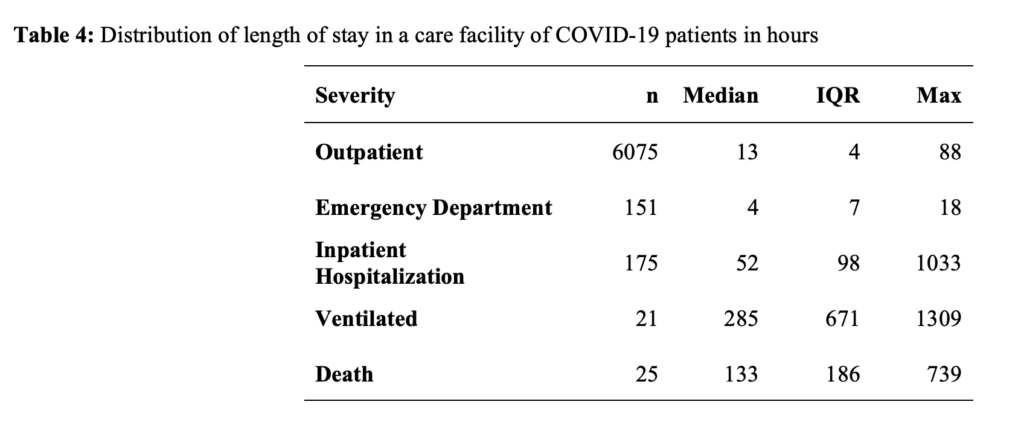
Compared to WNH, racial and ethnic minoritized groups had increased adjusted odds ratios (aOR) of receiving emergency department care or hospitalization (aOR =1.83 [95% CI: 1.09, 3.07]; aOR = 7.11 [95% CI: 2.90, 17.43], respectively) (Table 5). Compared to patients younger than 65 years, patients 65 years or older had increased odds of receiving emergency department care or hospitalization (aOR =2.94 [95% CI: 1.46, 5.96]; aOR = 10.24 [95% CI: 5.53, 18.97], respectively). Compared to women, men had similar odds of receiving emergency department care or hospitalization (aOR = 0.72 [95% CI: 0.52, 1.0] and aOR = 1.06 [95% CI: 0.80, 1.46], respectively).
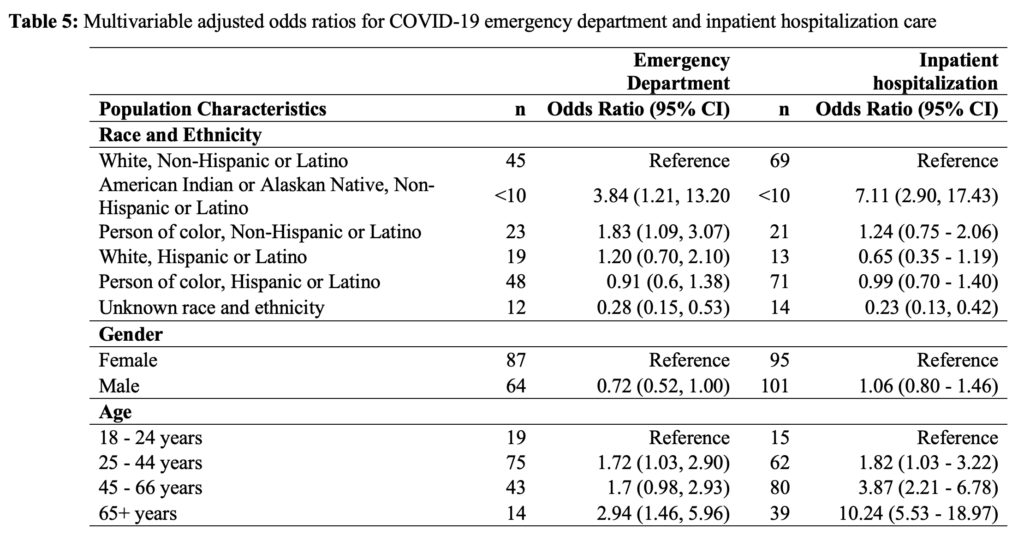
Discussion
In this study, we aimed to describe differences in COVID-19 outcome severity by race, ethnicity, gender identity, and age. We found that among the 9.1 percent (n = 6,420) of patients who tested positive for SARS-CoV-2 at University of Utah Health facilities from March to July of 2020, 95 percent received outpatient care, approximately 2 percent received care in the emergency department, 3 percent were hospitalized, and 0.4 percent died. Differences in COVID-19 illness severity could be partially explained by racial identity. Individuals who identified as “American Indian or Alaskan Native, non-Hispanic or Latino,” or “person of color, non-Hispanic or Latino” had higher odds of receiving ED care than WNH individuals. Similarly, “American Indian or Alaskan Native, non-Hispanic or Latino” individuals had higher odds of being hospitalized than WNH individuals.
This study’s results are generally in line with prior research reporting an increased level of COVID-19 illness severity in non-White individuals compared to persons of color.23 Similarly, work utilizing the Coronavirus Disease 2019-Associated Hospitalization Surveillance Network (COVID-NET) found that the highest hospitalization, hospitalization in intensive care units (ICU), and death rates occurred among Hispanic or Latino individuals and Black or African American individuals.16,24 Our results deviate slightly from previous work in that associations between being White, Hispanic or Latino, versus WNH, and COVID-19 illness severity were largely null.
Our null findings could be due to several reasons. First, it is possible that ethnic identity between these groups did not explain the likelihood of severe COVID-19 outcomes in this population during the pandemic. Second, immigration status in comorbidity burden may play a significant role in illness outcome but were not considered in this current work. Finally, we had limited power to detect differences within our early pandemic sample. Larger studies within Utah are needed before definitive conclusions can be made.
Individuals who did not disclose their race and ethnicity or were documented as being of an unknown race or unknown ethnicity had lower odds of receiving ED care or being hospitalized. This is not due to inherent protection inferred by non-disclosure of race and ethnicity but due to an evident reporting bias: it appears that patients are less likely to disclose their race and ethnicity when receiving care in the outpatient setting than patients who require higher levels of care (eg, ED or hospitalization). This also indicates individuals’ lack of trust when seeking healthcare for non-critical situations.
Depending on social and biological determinants, disease experience and burden vary in different groups. The COVID-19 pandemic and associated diseases are no different and have highlighted and broadened persistent health disparities in the United States.23, 25, 26 Racial and ethnic minoritized groups are more likely to reside and work in high transmission areas, have less access to testing and vaccination services, and present with a higher level of illness severity when seeking care. Additionally, racial and ethnic minoritized groups are, in general, more burdened by comorbidities that are strongly associated with severe COVID-19 outcomes.27 Notably, previous work in Utah calls attention to the fact that many areas with high health disparities have proportionally larger racial and ethnic minoritized populations than areas with low health disparities.27 This work suggests that there may be an association between compounded transmission and racial and ethnic minoritized individuals residing in Utah.16,23,24
Limitations and Strengths
This study is subject to 2 distinct limitations. First, this study only captures illness severity through the lens of clinical outcomes in patients who sought testing and treatment at 1 medical network during the pandemic’s beginning. As such, these results may not be generalizable to all COVID-19 patient experiences across the pandemic, characterized by various surges of different SARS-CoV-2 lineages, dissemination of vaccines and treatments, and changes in public health response. Secondly, this study did not account for all structural and social determinants that have been identified as affecting health outcomes (socioeconomic status, insurance coverage, occupation, place of residence, level of educational attainment, etc.). Consequently, these results do not capture all variations in COVID-19 illness severity influenced by structural and social determinants.
However, this work has its strengths. First, we describe and characterize illness severity using a granular index. This is distinct, as most work early in the pandemic assessed illness severity using only 3 levels of severity rather than the 5 developed for this study. Secondly, this work captured information on race and ethnicity for 84 percent of individuals in the sample. This is notable as race and ethnicity are often under-reported in medical and public reports. Finally, while this work only focuses on the earliest stage of the COVID-19 pandemic, it sets a solid methodological foundation for future infectious disease studies in Utah using the Enterprise Data Warehouse, especially those designed to capture illness severity.
Conclusion
This retrospective descriptive analysis found that COVID-19 illness severity, measured by an expanded illness severity index, varies by race, ethnicity, and age. In Utah, the likelihood of more significant illness severity outcomes disproportionately impacts older individuals and individuals identifying as “American Indian or Alaskan Native and non-Hispanic or Latino” or “person of color and non-Hispanic or Latino.” Further work is needed to understand the complexities of the COVID-19 disease experience and how it has changed over time in Utah and throughout the Intermountain West. Specifically, an emphasis on structural and social determinants of COVID-19 illness, while controlling for biological determinants, across the entire pandemic is needed.
Acknowledgements
We are grateful for healthcare professionals working tirelessly to combat the COVID-19 pandemic. The University of Utah Electronic Data Warehouse provided data for this study.
References
1. Rothan HA, Byrareddy SN. The epidemiology and pathogenesis of coronavirus disease (COVID-19) outbreak. J Autoimmun. 2020;109:102433. doi:10.1016/j.jaut.2020.102433
2. Adhikari SP, Meng S, Wu YJ, et al. Epidemiology, causes, clinical manifestation and diagnosis, prevention and control of coronavirus disease (COVID-19) during the early outbreak period: a scoping review. Infect Dis Poverty. 2020;9(1):29. doi:10.1186/s40249-020-00646-x
3. World Health Organization. WHO Director-General’s opening remarks at the media briefing on COVID-19 – 11 March 2020. Accessed April 15, 2022. https://www.who.int/director-general/speeches/detail/who-director-general-s-opening-remarks-at-the-media-briefing-on-covid-19—11-march-2020
4. Centers for Disease Control and Prevention. CDC COVID Data Tracker: Home. Accessed April 15, 2023. https://covid.cdc.gov/covid-data-tracker/#datatracker-home
5. Selden TM, Berdahl TA. COVID-19 and racial/ethnic disparities in health risk, employment, and household composition. Health Affairs. 2020;39(9):1624-1632. doi:10.1377/hlthaff.2020.00897
6. Martinez DA, Hinson JS, Klein EY, et al. SARS-CoV-2 Positivity rate for Latinos in the Baltimore-Washington, DC region. JAMA. 2020;324(4):392-395. doi:10.1001/jama.2020.11374
7. Karaye IM, Horney JA. The impact of social vulnerability on COVID-19 in the US: An analysis of spatially varying relationships. American Journal of Preventive Medicine. 2020;59(3):317-325. doi:10.1016/J.AMEPRE.2020.06.006/ATTACHMENT/5E18ADFE-2EA7-4E86-B70D-329794452EEA/MMC1.PDF
8. Millett GA, Jones AT, Benkeser D, et al. Assessing differential impacts of COVID-19 on Black communities. Annals of Epidemiology. 2020;47:37-44. doi:10.1016/J.ANNEPIDEM.2020.05.003
9. Hawkins D. Differential occupational risk for COVID-19 and other infection exposure according to race and ethnicity. American Journal of Industrial Medicine. 2020;63(9):817-820. doi:10.1002/AJIM.23145
10. Rader B, Astley CM, Sy KTL, et al. Geographic access to United States SARS-CoV-2 testing sites highlights healthcare disparities and may bias transmission estimates. Journal of Travel Medicine. 2020;27(7):taaa076. doi:10.1093/jtm/taaa076
11. Simmons A, Chappel A, Kolbe AR, Bush L, Sommers BD. Health disparities by race and ethnicity during the COVID-19 pandemic: Current evidence and policy approaches. ISSUE BRIEF. 2021;1. Accessed April 18, 2022. https://www.cdc.gov/nchs/nvss/vsrr/COVID19/index.htm
12. Vahidy FS, Nicolas JC, Meeks JR, et al. Racial and ethnic disparities in SARS-CoV-2 pandemic: Analysis of a COVID-19 observational registry for a diverse US metropolitan population. BMJ Open. 2020;10(8):e039849-e039849. doi:10.1136/bmjopen-2020-039849
13. Azar KMJ, Shen Z, Romanelli RJ, et al. Disparities in outcomes among COVID-19 patients in a large health care system in California. Health Affairs. 2020;39(7):1253-1262. doi:10.1377/hlthaff.2020.00598
14. Adegunsoye A, Ventura IB, Liarski VM. Association of Black race with outcomes in COVID-19 disease: A retrospective cohort study. Ann Am Thorac Soc. 2020;17(10):1336-1339. doi:10.1513/AnnalsATS.202006-583RL
15. Gold JAW, Rossen LM, Ahmad FB, et al. Race, ethnicity, and age trends in persons who died from COVID-19—United States, May-August 2020. MMWR Morb Mortal Wkly Rep. 2020;69(42):1517-1521. doi:10.15585/MMWR.MM6942E1
16. Hsu HE, Ashe EM, Silverstein M, et al. Race/ethnicity, underlying medical conditions, homelessness, and hospitalization status of adult patients with COVID-19 at an Urban Safety-Net Medical Center—Boston, Massachusetts, 2020. MMWR Morb Mortal Wkly Rep. 2020;69(27):864-869. doi:10.15585/MMWR.MM6927A3
17. Strully K, Yang TC, Liu H. Regional variation in COVID-19 disparities: Connections with immigrant and Latinx communities in US counties. Ann Epidemiol. 2021;53:56-62.e2. doi:10.1016/j.annepidem.2020.08.016
18. Berchick ER, Hood E, Barnett JC. Health Insurance Coverage in the United States: 2018. Washington, DC: US Department of Commerce; 2019.
19. Acosta AM, Garg S, Pham H, et al. Racial and ethnic disparities in rates of COVID-19–Associated hospitalization, intensive care unit admission, and in-hospital death in the United States from March 2020 to February 2021. JAMA Network Open. 2021;4(10):e2130479-e2130479. doi:10.1001/jamanetworkopen.2021.30479
20. US Census Bureau. US Census Bureau QuickFacts: United States. Accessed April 15, 2022. https://www.census.gov/quickfacts/fact/table/US/PST045219.
21. About University of Utah Hospitals & Clinics. University of Utah Health. Accessed April 16, 2022. https://healthcare.utah.edu/about/
22. Dalsania AK, Fastiggi MJ, Kahlam A, et al. The relationship between social determinants of health and racial disparities in COVID-19 mortality. Journal of Racial and Ethnic Health Disparities. 2022;9(1):288-295. doi:10.1007/s40615-020-00952-y
23. Magesh S, John D, Li WT, et al. Disparities in COVID-19 outcomes by race, ethnicity, and socioeconomic status: A systematic review and meta-analysis. JAMA Network Open. 2021;4(11):e2134147-e2134147. doi:10.1001/jamanetworkopen.2021.34147
24. Mein SA. COVID-19 and health disparities: The reality of “the Great Equalizer.” Journal of General Internal Medicine. 2020;35(8):2439-2440. doi:10.1007/s11606-020-05880-5
25. Killerby ME, Link-Gelles R, Haight SC, et al. Morbidity and mortality weekly report characteristics associated with hospitalization among patients with COVID-19–Metropolitan Atlanta, Georgia, March-April 2020. Accessed April 15, 2022. https://www.cdc.gov/coronavirus/2019-ncov/hcp/infection-control-
26. Moore JT, Pilkington W, Kumar D. Diseases with health disparities as drivers of COVID-19 outcome. Journal of Cellular and Molecular Medicine. 2020;24(19):11038-11045. doi:https://doi.org/10.1111/jcmm.15599
27. Lewis NM, Friedrichs M, Wagstaff S, et al. Disparities in COVID-19 incidence, hospitalizations, and testing, by area-level deprivation—Utah, March 3–July 9, 2020. MMWR Morbidity and Mortality Weekly Report. 2020;69(38):1369-1373. doi:10.15585/MMWR.MM6938
Citation
Paegle AJ, VanDerslice JA, Benson LS, Schliep KC. (2023). Socio-Demographic Disparities in SARS-CoV-2 Illness Severity; Utah, 2020. Utah Women’s Health Review. doi: 10.26054/0d-7tf3-0ah7.
Period Poverty
Problem Statement
Period poverty is defined as the inability to access affordable and clean sanitary products, adequate hygiene facilities, and sufficient menstrual hygiene education.1 It also includes the lack of safe and private spaces for cleaning and means for disposal of used menstrual hygiene products.2
Recent estimates show nearly 500 million women and girls globally suffer from period poverty,3 with the majority living in low and middle-income countries2,3 and low-income women living in high-income countries.1,3 In the United States (U.S.), the prevalence of period poverty is unclear, due to a lack of nationwide assessments and limited research.1 The small number of available studies in this area show substantial proportions of period poverty in the U.S. In a qualitative study of low-income women, 64% of participants reported experiencing period poverty in the past 12 months.1 Similarly, a study of high school students reported that 48% suffered from period poverty at least once during the school year.4 Another study of school-aged women found that 14% of college students experienced period poverty in the past year.2
Furthermore, period poverty is not only a financial concern, but can also negatively impact women’s health. Some studies have associated period poverty with a heightened risk of depression and anxiety,2 perceived stigma,5 and urogenital infections.6 One study on college students showed that students who experienced monthly period poverty were significantly more likely to be moderately or severely depressed compared to students not experiencing period poverty.2
Period poverty may also exacerbate societal and economic inequalities.7 Women who are unable to manage their periods effectively may miss work or school,8 which can result in lost income, missed educational opportunities,8,9 and reduced chances for promotions or salary increases.
The results from these studies examining the risks of period poverty and associated outcomes emphasize the need for greater attention to period poverty and additional policy solutions to address critical determinants.
Call to Action
In 2022, the Utah legislature passed House Bill 162.10 The bill required Utah schools to provide free tampons, sanitary napkins, or similar products to students in female or unisex restrooms within elementary, middle, junior, and high school facilities. This legislation is part of a nationwide trend to address period poverty. Since 2017, more than 20 bills have been enacted to address period poverty nationwide.11
Though the passage of HB 162 is notable progress toward menstrual equity, there are additional policies that could make a dent in period poverty. Not all girls and women experiencing period poverty are able to obtain period products from school. When schools and community centers are closed, as they were during the COVID-19 pandemic, access to products becomes a major challenge. We propose several policies that could close these gaps.
Taxing period products, known as the “tampon tax,” refers to period products being taxed as luxury items rather than as necessities. Period products are as much of a necessity as toilet paper, which is provided free of charge in public restrooms. Today, period products are taxed at the standard rate in Utah. In 2019, after many years of advocacy, Utah legislators passed a tax reform bill to end the tampon tax state-wide.12 However, the tax reform bill was deemed controversial and repealed before implementation.12
Making period products eligible for purchase through the Special Supplemental Nutrition Program for Women, Infants, and Children (WIC) and Supplemental Nutrition Assistance (SNAP),13 could serve as a viable alternative to the tax reform bill. However, some limitations exist, such as the limited coverage of the program, strict eligibility criteria, and volatility.14 To mitigate these issues, it may be worthwhile to consider implementing measures such as expanding the scope of tax credits or providing voucher programs specific for period products.
Though Utahns experience lower rates of poverty than the nation (8.9% vs. 12.3%), more women live in poverty than men (9.6% vs. 8.2%).15 This disparity is even more pronounced in racial/ethnic minorities. For example, 36.8% of Black/African American women live in poverty compared to 21.3% of men.15 Gaps in higher educational attainment and wage earnings also contribute to this problem.15 Period poverty continues to be a significant issue locally, nationwide, and on a global scale. Many women and girls still suffer from access to affordable menstrual products and proper hygiene management. More research is needed to understand better the prevalence of period poverty across sociodemographic factors and the effect on women’s overall well-being.
References
1. Sebert Kuhlmann A, Peters Bergquist E, Danjoint D, Wall LL. Unmet Menstrual Hygiene Needs Among Low-Income Women. Obstet Gynecol. 2019 Feb;133(2):238–44.
2. Cardoso LF, Scolese AM, Hamidaddin A, Gupta J. Period poverty and mental health implications among college-aged women in the United States. BMC Womens Health. 2021 Jan 6;21(1):14.
3. Sommer M. Where the education system and women’s bodies collide: The social and health impact of girls’ experiences of menstruation and schooling in Tanzania. J Adolesc. 2010 Aug 1;33(4):521–9.
4. Sebert Kuhlmann A, Key R, Billingsley C, Shato T, Scroggins S, Teni MT. Students’ Menstrual Hygiene Needs and School Attendance in an Urban St. Louis, Missouri, District. J Adolesc Health Off Publ Soc Adolesc Med. 2020 Sep;67(3):444–6.
5. Brinkley J, Niebuhr N. Period Poverty and Life Strains: Efforts Made to Erase Stigma and to Expand Access to Menstrual Hygiene Products [Internet]. Rochester, NY: Social Science Research Network; 2022 Feb [cited 2022 May 2]. Report No.: 4042285. Available from: https://papers.ssrn.com/abstract=4042285
6. Das P, Baker KK, Dutta A, Swain T, Sahoo S, Das BS, et al. Menstrual Hygiene Practices, WASH Access and the Risk of Urogenital Infection in Women from Odisha, India. PLOS ONE. 2015 Jun 30;10(6):e0130777.
7. Rossouw L, Ross H. Understanding Period Poverty: Socio-Economic Inequalities in Menstrual Hygiene Management in Eight Low- and Middle-Income Countries. Int J Environ Res Public Health. 2021 Jan;18(5):2571.
8. Tegegne TK, Sisay MM. Menstrual hygiene management and school absenteeism among female adolescent students in Northeast Ethiopia. BMC Public Health. 2014 Oct 29;14:1118.
9. Tull K. Period Poverty Impact on the Economic Empowerment of Women. 2019 Jan 23 [cited 2023 Mar 7]; Available from: https://opendocs.ids.ac.uk/opendocs/handle/20.500.12413/14348
10. HB0162 [Internet]. [cited 2022 May 2]. Available from: https://le.utah.gov/~2022/bills/static/HB0162.html
11. Jamieson C, Kelley B. States Address Period Poverty With Free Menstrual Products in Schools [Internet]. 2022 [cited 2022 Nov 1]. Available from: https://ednote.ecs.org/states-address-period-poverty-with-free-menstrual-products-in-schools/
12. Winslow B. Why Utah lawmakers may not repeal the “tampon tax” [Internet]. FOX 13 News Utah (KSTU). 2021 [cited 2022 Oct 28]. Available from: https://www.fox13now.com/news/local-news/why-utah-lawmakers-may-not-repeal-the-tampon-tax
13. SNAP Eligibility [Internet]. United States Department of Agriculture; 2019. Available from: https://fns-prod.azureedge.us/sites/default/files/resource-files/2019%20FNS%20313%20SNAP%20English%20for%20508.pdf
14. Ettinger de Cuba S, Chilton M, Bovell-Ammon A, Knowles M, Coleman SM, Black MM, et al. Loss Of SNAP Is Associated With Food Insecurity And Poor Health In Working Families With Young Children. Health Aff (Millwood). 2019 May;38(5):765–73.
15. Wood DM, Darowski E, Madsen S, Knapp G. Poverty Among Utah Women: A 2022 Update [Internet]. 2022 [cited 2022 Oct 28]. Available from: https://www.usu.edu/uwlp/blog/2022/poverty-among-utah-women
Citation
Adediran E & Myrer R. (2023). Period Poverty. Utah Women’s Health Review. doi: 10.26054/0d-mq0v-8var.
