
Letter from the Editor, Karen Schliep, PhD MSPH, 2023-24
It is with great enthusiasm and deep appreciation that I present to you the 2023/2024 issue of the Utah Women’s Health Review. This issue is a testament to the power of interdisciplinary collaboration, community engagement, and a growing momentum in Utah and beyond to advance women’s health research across the lifespan.
This year’s Review includes a special section led by my esteemed colleagues Drs. Caren Frost and Lisa Gren, who have long championed equity and inclusion in research. Their 2024 Special Issue, featuring eight compelling essays and research articles, challenges us to reimagine what equitable and respectful health care looks like for women of diverse identities and experiences. From innovative community-based methodologies to policy-driven advocacy, this body of work underscores the importance of listening to women’s voices as we shape systems of care.
We also highlight the dynamic conversations and discoveries from three symposia held over the past year. The 2023 symposium Women, Disrupted invited us to consider the environmental, endocrine, emotional, economic, and equity-driven forces that converge to shape women’s health. The conversations that emerged were both sobering and empowering—reminding us that while disruption can signify breakdown, it can also signal opportunity for transformation.
Our 2024 Stillbirth Symposium brought together clinicians, researchers, and families to grapple with one of the most heartbreaking yet under-discussed aspects of reproductive health. The urgency of this work is reflected in the symposium’s call for standardized care pathways, expanded support for bereaved families, and investments in stillbirth prevention and surveillance.
The Women’s Health in the Cross Hairs symposium explored the intersection of politics, policy, and reproductive health, emphasizing the growing need for evidence-informed advocacy in a rapidly shifting national landscape. Panelists drew attention to the unintended consequences of restrictive reproductive health legislation and urged academic institutions to take an active role in protecting women’s bodily autonomy and access to care.
This issue also features a diverse set of original research articles utilizing data from the Utah Pregnancy Risk Assessment Monitoring System (PRAMS), as well as other state-level and institutional datasets. These studies offer critical insights into maternal mental health, pregnancy complications, occupational exposures, and sex-based differences in clinical care:
- One study examines the nuanced relationship between preconception polycystic ovary syndrome and gestational diabetes, exploring how co-occurring hypertension may influence this association.
- Another study investigates the link between prenatal depression and anxiety and the risk of hypertensive disorders of pregnancy—highlighting the growing need for integrated behavioral health screening during prenatal care.
- A third paper assesses whether maternal age modifies the relationship between gestational diabetes and primary C-section delivery, providing implications for age-specific prenatal counseling.
- The occupational health study on Utah nail technicians raises critical questions about workplace exposures and miscarriage risk—an area ripe for public health intervention.
- Additional articles shed light on the role of nurses and integrated behavioral health professionals in addressing rising rates of perinatal depression, and on disparities in pain management practices among college athletes by sex.
Rounding out the issue are three timely data snapshots designed to catalyze dialogue and action. These brief reports address the role of group singing in fostering youth social cohesion, trends in shared reading to support early childhood literacy, and the barriers that women of color in Utah face in maintaining healthy lifestyles. Each of these snapshots underscores the importance of upstream social determinants in shaping long-term health outcomes.
As Editor-in-Chief, I continue to be inspired by the breadth and depth of work being done across Utah to improve women’s health. This issue reflects our collective commitment to lifting up women’s experiences, challenging structural inequities, and advancing science that informs practice and policy. I extend my deepest gratitude to our editorial team, contributing authors, peer reviewers, and the many community partners whose dedication and insights make this work possible.
Thank you for joining us in this important conversation. I hope the articles in this issue spark new ideas, collaborations, and commitments to improving the health and well-being of all women in Utah and beyond.
Warmly,
Karen C. Schliep, PhD, MSPH
Editor-in-Chief, Utah Women’s Health Review
Does Maternal Age Modify the Association Between Gestational Diabetes and Primary C-section Delivery? A Cross-Sectional Study of Utah PRAMS Data
Abstract
Background: Gestational diabetes mellitus (GDM) is prevalent in expecting mothers and is associated with various adverse maternal and fetal outcomes. Previous studies suggest a relationship between GDM and cesarean section (CS). However, the results of these studies in the context of primary CS and mothers’ age are limited and inconsistent, when other factors are accounted for.
Objective: This study compared primary CS risk between younger (15-34 years) and older (35+) mothers with GDM in Utah.
Methods: We conducted a cross-sectional analysis using the Utah Pregnancy Risk Assessment Monitoring System (PRAMS) phase 8 (2016-2021) survey data. A total of 8,491 responses were available for analysis. We estimated the risk/prevalence ratio (PR) of primary CS in women with GDM using Poisson regression models.
Results: 18.44% of women with GDM also had a primary CS, compared to 10.95% with no GDM. Overall, GDM significantly increased primary CS risk (PR 1.39: 1.13, 1.72). Younger mothers (15-34) with GDM also had a stronger adjusted risk (PR 1.48: 1.15, 1.91), but not older mothers (PR 1.40: 0.95, 2.07).
Conclusion: This study found greater primary CS risk in younger mothers with GDM but not older mothers. Longitudinal studies and interventions focusing on modifiable risk factors in younger Utah mothers are warranted to enhance their health during pregnancy and childbirth. More research is also needed to better understand CS decisions among younger Utah mothers, in particular, those who develop comorbidities such as GDM.
Implications: Culturally and demographically tailored interventions are needed to reduce GDM and associated primary CS risk in this population.
Introduction
Gestational Diabetes mellitus (GDM) is a common complication during pregnancy, affecting more than 14% of pregnancies globally and 9% of pregnancies in the United States (US).1,2 In Utah, around 7.5% of pregnancies are affected by GDM.3 Some identified risk factors for GDM include advanced maternal age, obesity, and type 2 diabetes mellitus.4 Also, expecting mothers with GDM face an increased risk of preeclampsia, premature birth, cesarean section delivery (CS), and cardiovascular disease mortality.5,6
Among the various complications linked to GDM, a major concern is its strong association with CS. In the US, CS is among the most common major surgical procedures performed, accounting for 32.1% of births in 2022.7 In Utah, CS prevalence was 26.3% among low risk mothers with no prior births, in the same year.8 This is noteworthy as CS is also associated with adverse maternal outcomes such as endomyometritis, uterine rupture, and death.9,10
GDM is an independent predictor of CS in multiple previous studies.11–14 However, there are direct contradictions surrounding the context of maternal age in the association between GDM and CS, when other factors are accounted for.13,14 For example, one group found that the risk of CS was only increased in mothers aged 45 years or older.14 Other literature suggests a strong correlation of GDM and CS risk with increased age.13 Currently, there is no research investigating how maternal age may modify this association.
Generally, studies indicate age as a confounder, given that advanced maternal age has historically been linked to higher GDM and CS risks.13 However, recent reports suggest that younger mothers (under 35 years) may also face elevated risks of both conditions.7,15 Also, there are no studies assessing differences between younger and older mothers with GDM in the risk of a first or primary CS; most existing research has focused on total CS, history of CS, or repeat CS,11,13,16 requiring further investigation.
Moreover, to our knowledge, there has been no research examining age differences in primary CS risk within Utah mothers with GDM. To overcome these gaps, we utilized data from the Utah Pregnancy Risk Assessment Monitoring System (PRAMS) phase 8 survey data, which included 8,491 mothers. We analyzed the data by stratifying mothers with GDM into two groups: younger (15-34 years) and older (35+), to assess their risk of a primary CS.
Methods
Study Design and Population
This study utilized the Utah Pregnancy Risk Assessment Monitoring System (PRAMS) phase 8 (2016-2021) survey data for analysis. PRAMS is an ongoing population-based survey designed to collect information on maternal behaviors and experiences before, during, and immediately following pregnancy.17 Approximately 200 new mothers are randomly selected monthly for participation using Utah Birth Certificates. All responses are linked to the birth certificate record throughout the data collection process. Responses to the PRAMS survey are also weighted to accurately represent all women given birth in Utah.17 The dataset for the present study included 8,491 women, which reflected an extrapolated population size of 279,355 women in Utah (after weighing) using SAS analytical software package.
Exposure
The primary exposure was GDM, categorized as “Yes” or “No.” The information on GDM status was obtained from the PRAMS dataset which was linked to the infant’s birth certificate record.
Outcome
The outcome of interest was primary CS delivery categorized as “Yes” or “No.” The information on CS delivery was obtained from the PRAMS dataset which was linked to the infant’s birth certificate record.A “yes” for primary CS delivery indicates women with their first CS delivery reported in the birth certificate records, irrespective of the number of previous live births.
Covariates
Covariates used in the study included age (<20, 20-24, 25-34, and 35+ years of age), race (white or non-white), ethnicity (Hispanic or non-Hispanic), degree attained (associate’s degree or lower, bachelor’s degrees or higher, and unknown degree), region of residence (urban or rural), body mass index BMI (underweight: <18.5 kg/m2; healthy weight: 18.5-24.9 kg/m2; overweight: 25-29.9 kg/m2; and obese: >30 kg/m2),18 hypertension (yes or no), number of previous live births (0, 1-2, 3-4, and 5 or more), and infant birth weight (grams).
Statistical Analysis
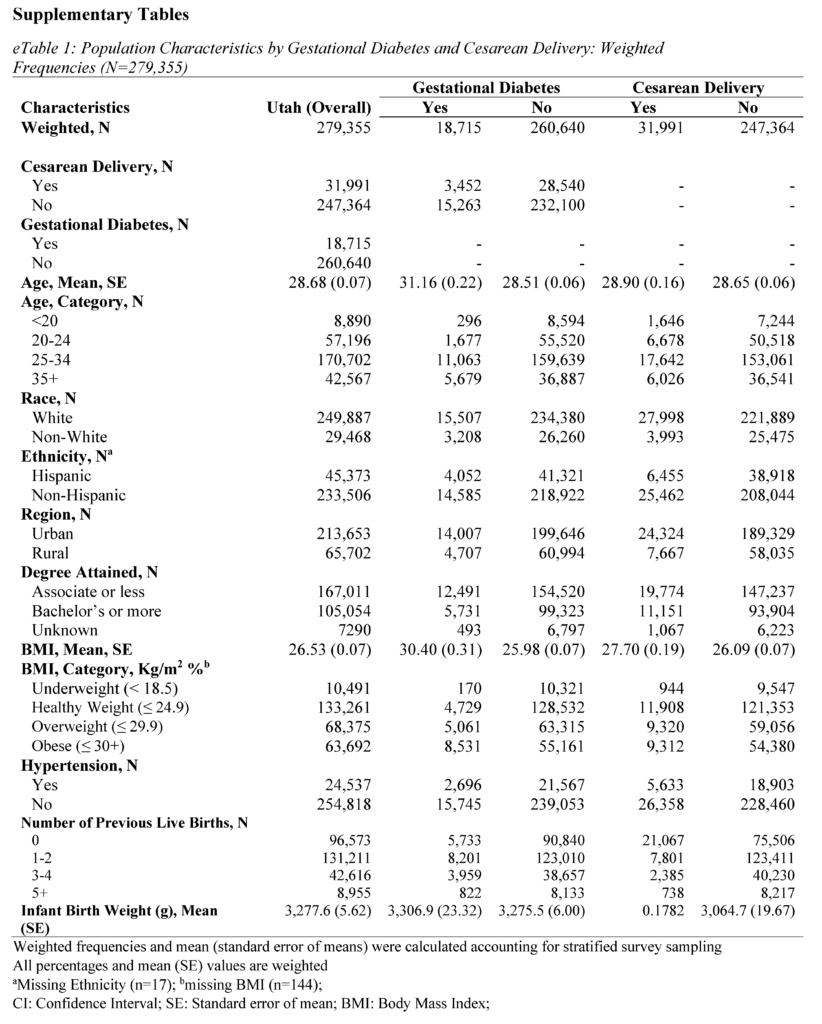
All analyses were conducted using SAS Studio (version 9.4). Sampling weights were applied to the analysis to obtain representative Utah population estimates. The PRAMS weighing methodology was provided by the CDC and Utah Department of Health and Human Services (UDHHS).19 Group differences for sample characteristics were calculated using chi-squared tests for categorical variables and student t-tests for continuous variables. The frequency distributions by GDM and primary CS are presented in Table 1 and eTables 1 and 2 (see Supplementary Materials).
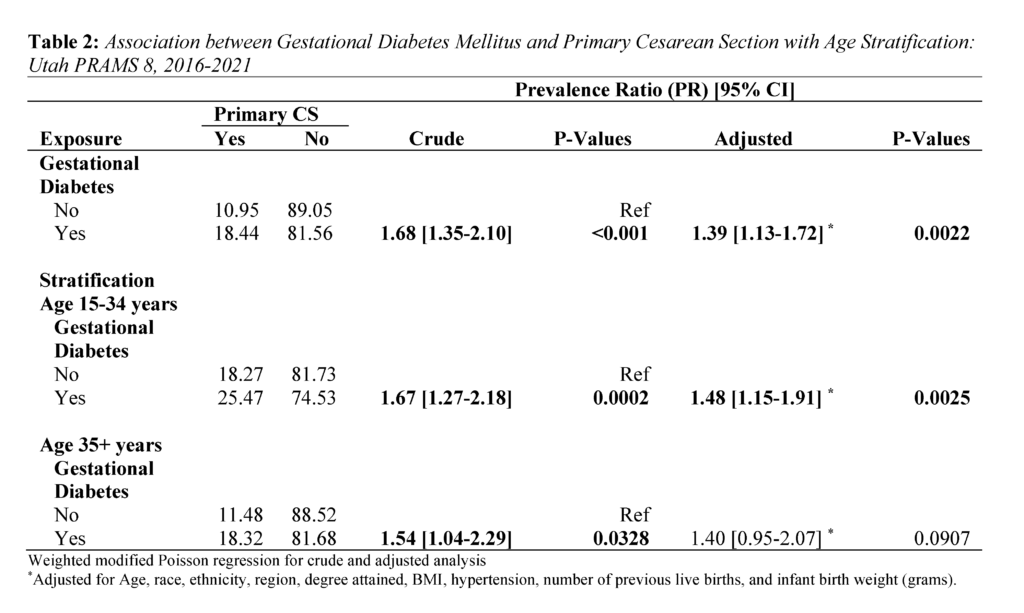
The modified Poisson regression was used to examine weighted crude and adjusted associations between GDM and CS.20 Prevalence Ratio (PR) estimates of the regression analysis are presented in Table 2. The Poisson regression was also used for age-stratified analysis of primary CS risk. Individual estimates for younger (15-34 years) and older mothers (35+) are also in Table 2. Age 35 and older was used as the cutoff point for stratification due to research suggesting 35 years as advanced maternal age.21
Ethics Approval
The collection of the data used in this study was approved by Utah Department of Health and Human Services (UDHHS) institutional review board.
Results
Population Characteristics
The study consisted of 8,491 respondents, reflecting 279,355 women giving birth in Utah after weighting. Mean (standard error) age was 28.68 (0.07) years, 89.45% identified as White race, and 83.73% identified as non-Hispanic ethnicity (Tables 1 and 2). In addition, 76.48% of women in the study lived in an urban setting, and 59.78% held an associate degree or lower.
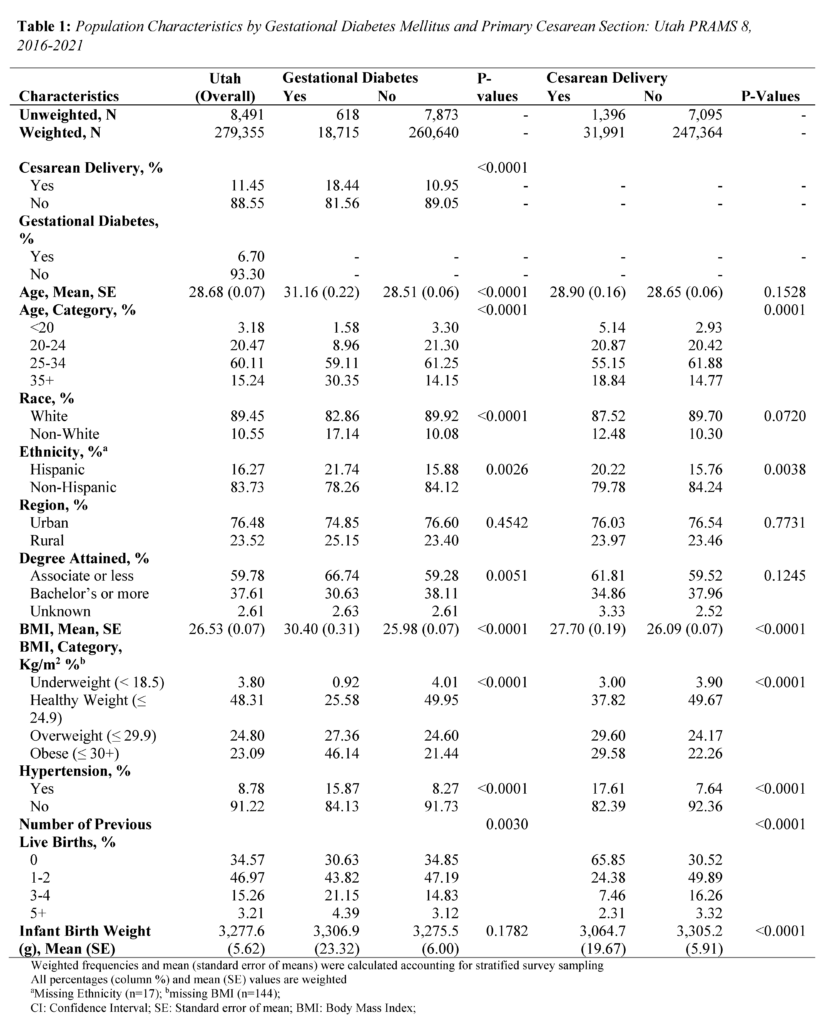
About 6.70% of mothers in the study were diagnosed with GDM, and 11.45% of mothers had a primary CS. Mothers with GDM were more often older, evidenced by a mean age of 31.16 (standard error; SE = 0.22) years compared to 28.51 (SE = 0.06) years among mothers without GDM (P<.0001) (Table 1). Differences were observed between mothers with GDM and those without GDM in terms of race (P<.0001), ethnicity (P=0.0026), degree attainment (P=0.0051), BMI (P<.0001), comorbidity of hypertension (P<.0001), and number of previous live births (P=0.0030). (Table 1). Mothers with primary CS were more often Hispanic ethnicity (P=0.0038), had a higher BMI (P<.0001), comorbidity of hypertension (P<.0001), no previous live births (P<.0001), and lower infant birth weight (P<.0001).
Regarding the distribution of primary CS by GDM, 18.44% of mothers with GDM had primary CS, while 10.95% of mothers without GDM had a primary CS (P<.0001) (Table 1). Further, among younger mothers (15-34 years) with GDM, 25.47% had a primary CS. In contrast, among older mothers (35+) with GDM, 18.32% had a primary CS (Table 2).
Association between GDM and Primary CS delivery
Overall, GDM was strongly associated with primary CS (Table 2). Mothers with GDM had a 1.39 times higher adjusted risk of primary CS compared to those without GDM (PR 1.39: 1.13, 1.72). In the age stratified analysis, the adjusted risk of primary CS was 1.48 times significantly higher for mothers aged 15-34 (PR 1.48: 1.15, 1.91). In contrast, the adjusted risk for mothers aged 35+ years was (PR 1.40: 0.95, 2.07).
Discussion
Principal Findings
The present study provides a first look at primary CS risk in Utah mothers with GDM. It is unique in that it investigated differences between younger (15-34 years) and older (35+) mothers. We found that Utah mothers with GDM had a significantly higher risk of primary CS, and observed a stronger association in younger mothers (15-34 years).
Interpretation
Our first major finding regarding a higher risk of primary CS in mothers with GDM is consistent with other research.23 For example, the 2024 study by Fresch et al.23 found a 1.34 times higher adjusted risk of primary CS in mothers with GDM (PR 1.34: 1.31, 1.36). Medical conditions like suspected macrosomia, labor arrest, and indeterminate fetal heart rate tracing may make vaginal birth difficult and unsafe, requiring a CS.16,24 Importantly, GDM is a known independent risk factor which can exacerbate the occurrence of these conditions.24–26
In our second major finding, the risk of primary CS in mothers with GDM was higher across age groups but only significant for younger mothers ages 15-34. The estimates for this age group (PR 1.48: 1.15, 1.91) were higher than those of the overall population (PR 1.39: 1.13, 1.72). This result is surprising given that research generally indicates greater GDM and primary CS risk in advanced or older maternal age only.27 It is important to note that existing research has not specifically examined the associations in younger mothers. Instead, these studies have only used younger age as a comparison or reference group in their analyses.23,27 A recent US-based study, however, comparing primary CS prevalence between 2021 and 2022 showed increases for mothers ages 25-29 (21.0% vs 21.1%), 30-34 (33.8% vs 33.9%), 35-39 (26.1% vs 26.4%), and 40+ (33.7% vs 34.0%).7,28 The upward trend in younger mothers is noteworthy and highlights two key considerations. First, the risk of pregnancy complications in this age group may be higher than current estimates indicate. Second, younger expecting mothers may be underrepresented in maternity health research.
Several factors may be contributing to the rising CS rates among younger mothers. Common reasons include fear of labor pain (as a first time mother or following a previous birth), concerns about bodily changes and damage, concerns about their baby’s health, and convenience of scheduling a CS birth.29,30 In Utah, a 2013 PRAMS data report revealed labor challenges indicated by fetal monitor, prolonged labor, and failed labor induction as reasons for CS in mothers reporting a primary CS.31 Given that GDM is associated with many, if not all, of these complications, it is possible that a diagnosis of the condition may heighten fear of a vaginal delivery, particularly among younger expecting mothers, which may result in preference for a CS. We recommend further research be performed to confirm this relationship.
Health Implications
CS intersects with various domains of health. In terms of physical health, CS has associated complications for both the mother and child. CS is a risk factor for common gynecological conditions, including the development of urinary tract infections, gastrointestinal problems, adhesions, pain, infertility, painful menses, and endometriosis in the mother.9,32 Additionally, children born via CS are at increased risk for respiratory tract infections, asthma, and obesity.33
The economic health domain is also impacted. On average, CS is more costly for the patient and for the hospital than vaginal delivery. Across Utah, total CS costs are reported as $8,952.52 for those with insurance and $14,252.80 for those without insurance while vaginal births are reported as $5,951.76 and $10,199.52 with and without insurance, respectively.34 Much of this cost is taken care of by insurance companies. However, these costs do not consider any complications stemming from delivery or care for mother or child. For the social health domain, CS can impact family planning and relationships due to potential complications such as painful intercourse and infertility.9,32,35 In mental and behavioral health, the increased risk of complications and the recovery process resulting from CS can lead to stress, anxiety, and even delayed initiation of breastfeeding.36,37
In 2023, Utah’s CS rate (19.4%) was lower than the average rate across the United States (US, 26.3%) for low-risk women without prior births.8 This trend has remained consistent over time (2013-2023).8 Additionally, Utah has a lower rate of GDM (7.5%) compared to the US (9%), although this difference is small.3 One explanation for this difference is the younger age of mothers at their first birth in Utah compared to the US (25.9 in Utah versus 27.1 years overall in 2020).38
It is critical that the aforementioned issues are addressed to improve maternal and child health outcomes. We recommend the following actions for health systems and population health researchers in Utah. First, the necessity of CS should be carefully considered in the context of each expecting mother. It is equally important that cases of CS in young expecting mothers with GDM are closely reviewed to ensure that decisions for CS follow appropriate clinical guidelines. Second, health systems should provide interdisciplinary team-based care to support young mothers who develop comorbidities (such as GDM) to mitigate fear and worry about their pregnancy. Third, significant outreach is needed to increase awareness about comorbidities during pregnancy and how expecting mothers can protect their health and the health of their baby. Lastly, more work is needed in Utah to ensure that new and expecting younger mothers are represented in maternity health research.
Conclusions
In summary, this study contributes valuable insights into the association between GDM and primary CS in Utah, highlighting the importance of early detection and management of GDM to optimize maternal and infant health outcomes. Longitudinal studies and interventions focusing on modifiable risk factors in younger Utah mothers are warranted to enhance their health during pregnancy and childbirth. More research is also needed to better understand CS decisions among younger Utah mothers, in particular, those who develop comorbidities such as GDM.
Strengths & Limitations
This study had several strengths and limitations. First, our weighted sample was representative of the Utah population (279,355). This enabled more precise estimates and comprehensive evaluation of overall findings. Second, this study was unique as it is the first to examine GDM and the risk of CS within the Utah population. Concerning limitations, since the study utilized Utah population data, the findings may not be generalizable to other areas. Further, the study design was cross-sectional, which introduces temporal ambiguity. As this analysis was done at one point, it cannot establish a cause-and-effect relationship.
Acknowledgements
Data was provided by the Utah Pregnancy Risk Assessment and Monitoring System (PRAMS), a project of the UDHHS, Office of Maternal and Child Health (MCH). No funding was provided for the project. This information or content and conclusions are those of the author and should not be construed as the official position or policy of, nor should any endorsements be inferred by UDHHS MCH.
References
1. Wang H, Li N, Chivese T, et al. IDF Diabetes Atlas: Estimation of Global and Regional Gestational Diabetes Mellitus Prevalence for 2021 by International Association of Diabetes in Pregnancy Study Group’s Criteria. Diabetes Res Clin Pract. 2022;183:109050. doi:10.1016/j.diabres.2021.109050
2. Center for Disease Control and Prevention. About Gestational Diabetes. Diabetes. Published May 31, 2024. Accessed July 25, 2024. https://www.cdc.gov/diabetes/about/gestational-diabetes.html
3. Utah Department of Health and Human Services. IBIS-PH – Health Indicator Report – Diabetes: gestational diabetes. Accessed July 24, 2024. https://ibis.utah.gov/ibisph-view/indicator/view/DiabGestDiab.html
4. Casagrande SS, Linder B, Cowie CC. Prevalence of gestational diabetes and subsequent Type 2 diabetes among U.S. women. Diabetes Res Clin Pract. 2018;141:200-208. doi:10.1016/j.diabres.2018.05.010
5. Preda A, Pădureanu V, Moța M, et al. Analysis of Maternal and Neonatal Complications in a Group of Patients with Gestational Diabetes Mellitus. Medicina (Kaunas). 2021;57(11):1170. doi:10.3390/medicina57111170
6. Wang YX, Mitsunami M, Manson JE, et al. Association of Gestational Diabetes With Subsequent Long-Term Risk of Mortality. JAMA Internal Medicine. 2023;183(11):1204-1213. doi:10.1001/jamainternmed.2023.4401
7. Osterman M, Hamilton B, Martin J, Driscoll A. National Vital Statistics Reports Volume 73, Number 2, April 4, 2024. Published online April 4, 2024.
8. Utah Department of Health and Human Services. IBIS-PH – Health Indicator Report – Cesarean delivery among low risk women with no prior births. Accessed July 24, 2024. https://ibis.utah.gov/ibisph-view/indicator/view/CesDel.UT_US.html
9. Quinlan JD, Murphy NJ. Cesarean Delivery: Counseling Issues and Complication Management. afp. 2015;91(3):178-184.
10. Boyle A, Reddy UM, Landy HJ, Huang CC, Driggers RW, Laughon SK. Primary Cesarean Delivery in the United States. Obstet Gynecol. 2013;122(1):33-40. doi:10.1097/AOG.0b013e3182952242
11. Gorgal R, Gonçalves E, Barros M, et al. Gestational diabetes mellitus: A risk factor for non-elective cesarean section. Journal of Obstetrics and Gynaecology Research. 2012;38(1):154-159. doi:10.1111/j.1447-0756.2011.01659.x
12. Song J, Cai R. Interaction between smoking during pregnancy and gestational diabetes mellitus and the risk of cesarean delivery: evidence from the National Vital Statistics System 2019. The Journal of Maternal-Fetal & Neonatal Medicine. 2023;36(2):2259048. doi:10.1080/14767058.2023.2259048
13. Akinyemi OA, Weldeslase TA, Odusanya E, et al. Profiles and Outcomes of Women with Gestational Diabetes Mellitus in the United States. Cureus. 2023;15(7):e41360. doi:10.7759/cureus.41360
14. Claramonte Nieto M, Meler Barrabes E, Garcia Martínez S, Gutiérrez Prat M, Serra Zantop B. Impact of aging on obstetric outcomes: defining advanced maternal age in Barcelona. BMC Pregnancy and Childbirth. 2019;19(1):342. doi:10.1186/s12884-019-2415-3
15. Shah NS, Wang MC, Freaney PM, et al. Trends in Gestational Diabetes at First Live Birth by Race and Ethnicity in the US, 2011-2019. JAMA. 2021;326(7):660-669. doi:10.1001/jama.2021.7217
16. Caughey AB, Cahill AG, Guise JM, Rouse DJ. Safe prevention of the primary cesarean delivery. American Journal of Obstetrics & Gynecology. 2014;210(3):179-193. doi:10.1016/j.ajog.2014.01.026
17. Utah Department of Health and Human Services. Utah PRAMS | Maternal and Infant Health Program. Accessed July 25, 2024. https://mihp.utah.gov/pregnancy-and-risk-assessment
18. CDC. Defining Adult Overweight and Obesity. Centers for Disease Control and Prevention. Published June 3, 2022. Accessed September 28, 2022. https://www.cdc.gov/obesity/basics/adult-defining.html
19. Center for Disease Control and Prevention. Data Methodology. Pregnancy Risk Assessment Monitoring System (PRAMS). Published May 20, 2024. Accessed July 25, 2024. https://www.cdc.gov/prams/php/methodology/index.html
20. Lindquist K. How can I estimate relative risk in SAS using proc genmod for common outcomes in cohort studies? | SAS FAQ. Accessed January 17, 2024. https://stats.oarc.ucla.edu/sas/faq/how-can-i-estimate-relative-risk-in-sas-using-proc-genmod-for-common-outcomes-in-cohort-studies/
21. American College of Obstetricians and Gynecologists (ACOG). Pregnancy at Age 35 Years or Older: ACOG Obstetric Care Consensus No. 11. Obstetrics & Gynecology. 2022;140(2):348. doi:10.1097/AOG.0000000000004873
22. Marshall SW. Power for tests of interaction: effect of raising the Type I error rate. Epidemiol Perspect Innov. 2007;4:4. doi:10.1186/1742-5573-4-4
23. Fresch R, Stephens K, DeFranco E. The Combined Influence of Maternal Medical Conditions on the Risk of Primary Cesarean Delivery. AJP Rep. 2024;14(1):e51-e56. doi:10.1055/s-0043-1777996
24. Kc K, Shakya S, Zhang H. Gestational diabetes mellitus and macrosomia: a literature review. Ann Nutr Metab. 2015;66 Suppl 2:14-20. doi:10.1159/000371628
25. Gill P, Henning JM, Carlson K, Van Hook JW. Abnormal Labor. In: StatPearls. StatPearls Publishing; 2024. Accessed July 26, 2024. http://www.ncbi.nlm.nih.gov/books/NBK459260/
26. Depla AL, De Wit L, Steenhuis TJ, et al. Effect of maternal diabetes on fetal heart function on echocardiography: systematic review and meta‐analysis. Ultrasound Obstet Gynecol. 2021;57(4):539-550. doi:10.1002/uog.22163
27. Richards MK, Flanagan MR, Littman AJ, Burke AK, Callegari LS. Primary cesarean section and adverse delivery outcomes among women of very advanced maternal age. J Perinatol. 2016;36(4):272-277. doi:10.1038/jp.2015.204
28. Osterman MJK, Hamilton BE, Martin JA, Driscoll AK, Valenzuela CP. Births: Final Data for 2021. Natl Vital Stat Rep. 2023;72(1):1-53.
29. Stoll KH, Hauck YL, Downe S, Payne D, Hall WA. Preference for cesarean section in young nulligravid women in eight OECD countries and implications for reproductive health education. Reprod Health. 2017;14:116. doi:10.1186/s12978-017-0354-x
30. Stoll K, Edmonds JK, Hall WA. Fear of Childbirth and Preference for Cesarean Delivery Among Young American Women Before Childbirth: A Survey Study. Birth. 2015;42(3):270-276. doi:10.1111/birt.12178
31. Utah Department of Health and Human Services. Utah Health Status Update: Primary Cesarean Delivery. Published June 2013. Accessed July 26, 2024. https://ibis.utah.gov/ibisph-view/pdf/opha/publication/hsu/2013/1306_CSection.pdf
32. Antoine C, Young BK. Cesarean section one hundred years 1920-2020: the Good, the Bad and the Ugly. J Perinat Med. 2020;49(1):5-16. doi:10.1515/jpm-2020-0305
33. Słabuszewska-Jóźwiak A, Szymański JK, Ciebiera M, Sarecka-Hujar B, Jakiel G. Pediatrics Consequences of Caesarean Section-A Systematic Review and Meta-Analysis. Int J Environ Res Public Health. 2020;17(21):8031. doi:10.3390/ijerph17218031
34. Peter K. Costs of Childbirth by State. PolicyScout. August 17, 2022. Accessed August 15, 2024. https://policyscout.com/health-insurance/learn/costs-childbirth-by-state#
35. Kainu JP, Sarvela J, Tiippana E, Halmesmäki E, Korttila KT. Persistent pain after caesarean section and vaginal birth: a cohort study. Int J Obstet Anesth. 2010;19(1):4-9. doi:10.1016/j.ijoa.2009.03.013
36. Skov SK, Hjorth S, Kirkegaard H, Olsen J, Nohr EA. Mode of delivery and short-term maternal mental health: A follow-up study in the Danish National Birth Cohort. Int J Gynaecol Obstet. 2022;159(2):457-465. doi:10.1002/ijgo.14155
37. Hosaini S, Yazdkhasti M, Moafi Ghafari F, Mohamadi F, Kamran Rad SHR, Mahmoodi Z. The relationships of spiritual health, pregnancy worries and stress and perceived social support with childbirth fear and experience: A path analysis. PLoS One. 2023;18(12):e0294910. doi:10.1371/journal.pone.0294910
38. Pieper K, Seager M, Blackburn R. Utah Women and Fertility: Trends and Changes from 1970–2021. Published online April 4, 2023.
Supplementary Materials

Citation
Adediran E, Duffy HR, & Asay KM. (2024). Does Maternal Age Modify the Association Between Gestational Diabetes and Primary C-section Delivery? A Cross-Sectional Study of Utah PRAMS Data. Utah Women’s Health Review. doi: 10.26054/d-yx18-mp3d
Prenatal Depression and Anxiety and Risk of Hypertensive Disorders of Pregnancy: Findings from the Utah Pregnancy Risk Assessment Monitoring Survey (2016–2020)
Abstract
Objectives: Depression during pregnancy has recently been found to affect the risk of hypertensive pregnancy disorders. However, few studies have looked at the effect of having depression or anxiety prior to pregnancy and its effects on hypertensive pregnancy disorders (HDP). This study aims to analyze a population-based sample of at-risk pregnant women in Utah using the Utah Pregnancy Risk Assessment Monitoring System (UT-PRAMS) to discover whether there is an association between pre-pregnancy depression/anxiety and HDP.
Methods: The study analyzed responses from the Utah Pregnancy Risk Assessment Monitoring System (UT-PRAMS) Phase 8 questionnaire between 2016 and 2020 using descriptive statistics and robust Poisson distribution models.
Results: Women who reported pre-pregnancy depression and/or anxiety, compared to those who did not, had a 3–5% higher risk of having an HDP after adjusting for important sociodemographic, reproductive history, and lifestyle factors. The risk increased to 30–49% when using our more severe HDP definition, as used in prior studies, which combined self-report of HDP and birth-certificate verified preterm births.
Conclusions and Implications: These results slightly differ from the observations made in the Pregnancy Outcomes and Community Health (POUCH) study. While our study did not take into account the length of depression or anxiety symptoms or subcategorize HDP types (i.e., preeclampsia), this study made similar adjustments to maternal sociodemographic factors and found a more significant association with pre-pregnancy anxiety than depression.
Introduction
Depression during pregnancy is thought to impact 10–20% of US women. 1 It is a common concern that has been associated with several adverse pregnancy complications, including hypertensive disorders of pregnancy (HDP).2 HDP, such as preeclampsia, eclampsia, and gestational hypertension, affect approximately one in seven delivery hospitalizations and are conditions that can cause serious health problems for both the mother and the baby across the lifespan.3
Cardiovascular and metabolic risk factors, including inflammation, oxidative stress, and endothelial dysfunction, are expected to affect both depression and HDP, supporting common contributing mechanisms for both conditions.4 Despite the growing evidence of the relationship between depression during pregnancy and the risk of HDP, limited research has considered pre-pregnancy depression and the risk of HDP, especially among population-based samples.2 Additionally, taking into account pre-pregnancy anxiety, in addition to depression, is essential since they are highly comorbid with one another, especially among reproductive-aged women where the prevalence of depression and anxiety is thought to be double that of men of similar age.5
A prior community-based study in Michigan, called the Pregnancy Outcomes and Community Health (POUCH) study, revealed that women’s experiences of depression and/or anxiety before pregnancy, lifetime, or within the past year are associated with HDP, especially chronic hypertension and more severe HDP accompanied by preterm delivery.2 Our objective in this study was to discover if a population-based sample of at-risk women in Utah shows similar associations between pre-pregnancy depression and/or anxiety and HDP.
Methods
Study Participants and Questionnaire
The study population of interest was comprised of women who completed the Utah Pregnancy Risk Assessment Monitoring System (UT-PRAMS) Phase 8 questionnaire between 2016 and 2020. The PRAMS is a surveillance project conducted with the Centers for Disease Control and Prevention (CDC) and local health departments.6 The Utah PRAMS takes a random sample of approximately 200 new mothers monthly through statewide mailings and continuous telephone follow-ups for women who do not return the survey. The questionnaire is available in both English and Spanish. PRAMS utilizes state-specific stratified systematic sampling so that subpopulations of public health interest can be oversampled, such as mothers of low-birth-weight infants, those living in high-risk geographic areas, and racial/ethnic minority groups. Utah PRAMS stratifies by maternal educational status and birth weight. The expected response rate, according to the CDC, is 50% nationwide; the most recent weighted response rates for UT-PRAMS were 65%, 66%, 62%, 73%, and 67% for 2016, 2017, 2018, 2019, and 2020, respectively.
Exposure
The exposure variable of interest is the presence of anxiety and depression before pregnancy. The presence of anxiety and depression was assessed based on the Phase 8 PRAMS self-report questionnaire. Women were asked, “During the 3 months before you got pregnant with your new baby, did you have any of the following conditions?” including “Depression” and “Anxiety,” requiring a yes/no answer. The exposure variable was assessed on four different levels: mothers who reported depression, anxiety, depression or anxiety, and depression and anxiety.
Outcome
This study’s primary outcome of interest was HDP, which was gathered via the Phase 8 PRAMS self-report questionnaire. Women were asked, “During your most recent pregnancy, did you have any of the following conditions,” including “high blood pressure (that started during this pregnancy), preeclampsia, or eclampsia?” requiring a yes/no answer. HDP was categorized as a dichotomous variable. While HDP was the primary outcome, we also evaluated a more severe HDP phenotype by combining self-report of HDP with preterm birth. Preterm birth, a continuous variable, was obtained from the birth certificate and was defined as <37 weeks gestational age.
Covariates
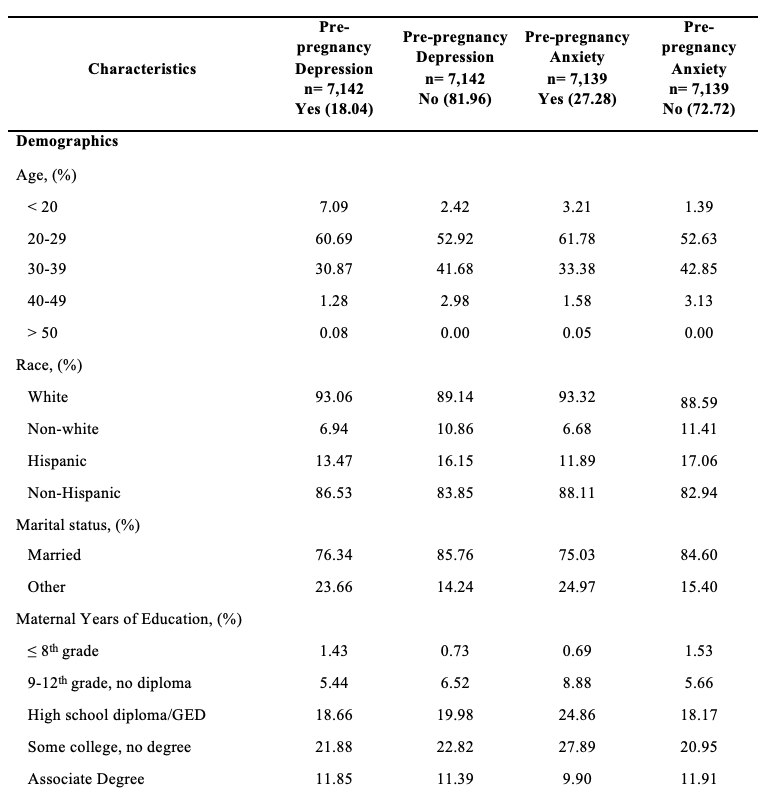
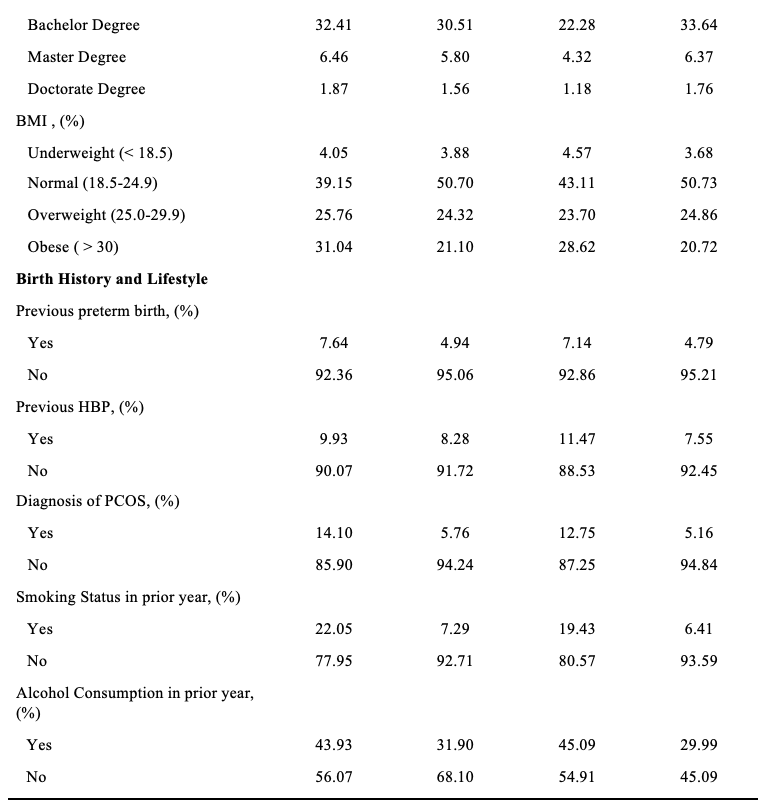
Covariates included age, race, marital status, years of education, and BMI. Data on these variables was collected from the linked birth certificates. Maternal age was categorized into five categories: <20, 20–29, 30–39, 40–49, and 50+. Maternal race was categorized as Hispanic or not Hispanic and white or not white. Marriage was categorized by having ever been married or having never been married. Years of education were categorized by highest degree received (<8th grade, 9–12 grade no diploma, high school grad/ GED, some college no degree, associate degree, bachelors degree, masters degree, or doctorate). Pre-pregnancy BMI was categorized into four categories: below 18.5, normal (18.5–24.9), overweight (25.0–29.9, and obese (30+).
Covariates available from the PRAMS questionnaire included smoking status determined by the question “Have you smoked any cigarettes in the past 2 years?” (yes/no) and alcohol use determined by the question “Have you had any alcoholic drinks in the past 2 years? A drink is 1 glass of wine, wine cooler, can or bottle of beer, shot of liquor, or mixed drink” (yes/no). A previous diagnosis of PCOS was determined by asking, “Have you ever been told that you have Polycystic Ovarian Syndrome or PCOS by a doctor, nurse, or other health care worker?” (yes/no) and “During the 3 months before you got pregnant with your new baby, did you have any of the following health conditions?” including PCOS requiring a yes/no answer. Previous high blood pressure was also listed under the question, “During the 3 months before you got pregnant with your new baby, did you have any of the following health conditions?” (yes/no). Previous preterm birth was determined through the question, “Was the baby just before your new one born earlier than 3 weeks before his or her due date?” (yes/no).
Statistical Analysis
Descriptive analyses were used to explore the characteristics of the study population by pre-pregnancy depression and anxiety status. Relationships between pre-pregnancy depression and/or anxiety and HDP were assessed using robust Poisson distribution models to generate prevalence ratios (PRs) and 95% confidence intervals (CIs). We reported unadjusted and adjusted models. Key confounders were selected on the basis of previous knowledge as documented in the literature, including maternal age, race, Hispanic ethnicity, maternal education, pre-pregnancy BMI, drinking and smoking status in the last two years, and prior history of PCOS, preterm birth, or hypertension. Effect modification by pregnancy year and Hispanic ethnicity were tested using interaction terms within Poisson models (with Wald chi-square test for significance), with stratified results presented. Stata (version 17.0; StataCorp, College Station, TX) was used for the analyses.
Results
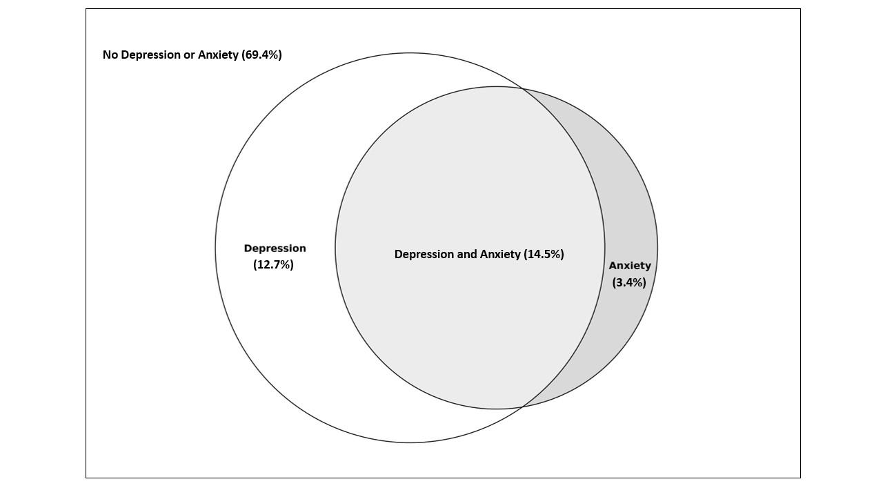
Of the women who participated in the 2016–2020 PRAMS questionnaire, 69.4% reported having no pre-pregnancy depression or anxiety, 14.5% had both pre-pregnancy depression and anxiety, 12.7% had anxiety, but no depression and 3.4% reported having depression but no anxiety (Figure 1). Women who experienced depression were more likely to be younger, white, have a previous preterm birth, smoke, drink, be obese, be less likely to be married, and have PCOS compared to those who do not experience depression (Table 1). There appeared to be no difference in the prevalence of previous high blood pressure (HBP) between women who reported depression and those who did not report depression. Women who reported having pre-pregnancy anxiety were more likely to be younger, white, have a previous preterm birth, smoke, drink, have PCOS, be obese, less likely to be married, and have previous HBP.
Women who reported pre-pregnancy depression and/or anxiety, compared to those who did not, had a 3–5% higher risk of having a hypertensive pregnancy after adjusting for maternal age, race, ethnicity, previous preterm birth, smoking status, prior alcohol consumption in the past two years, marital status, and pre-pregnancy BMI (Table 2). The prevalence increased to 30 to 49% when considering our defined “severe hypertensive pregnancy” that was accompanied by the preterm birth variable. Pre-pregnancy anxiety versus depression showed a greater association with having a severe hypertensive pregnancy, with an adjusted prevalence ratio of 1.49 (95% CI: 1.10, 2.01) for anxiety and 1.30 (95% CI: 0.95, 1.79) for depression. We found no evidence for effect modification by pregnancy year or Hispanic ethnicity (P=0.62 and 0.66 respectively).
Table 2: Unadjusted and adjusted prevalence ratios of HDP by self-reported hypertension during pregnancy and combined outcome of self-reported hypertension during pregnancy with preterm birth on birth record in Utah PRAMS (2016-2020), n=7,142 reflecting an estimated population of 231,242
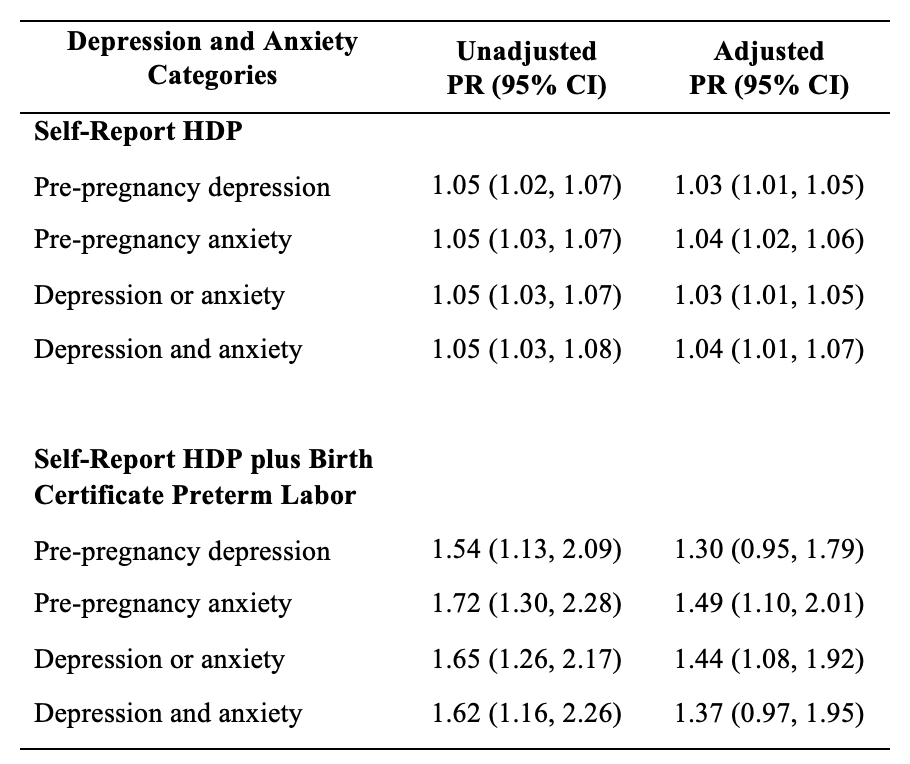
Adjusted for maternal age, race, ethnicity, previous preterm birth, smoking status, prior alcohol consumption in the past two years, marital status, and BMI.
Discussion
In our study among Utah women participating in the PRAMs 2016–2020, we found that pre-pregnancy anxiety had a bigger effect on HDP than pre-pregnancy depression, with a nearly 50% increase in severe HDP among mothers who reported pre-pregnancy anxiety compared to those who did not have pre-pregnancy anxiety. These results slightly differed from observations made in the Michigan POUCH study, which found associations between both maternal chronic hypertension and pre-pregnancy depression/anxiety. While our study did not take into account the length of depression or anxiety symptoms or subcategorize HDP types (i.e., preeclampsia), the Michigan POUCH study made similar adjustments to maternal sociodemographic factors and found a larger association with pre-pregnancy anxiety than depression. Additional research is needed to differentiate risk between geographical areas.
Depression and HDP are thought to share a number of the same biological mechanisms.4 HDP is frequently linked to increased arterial stress and resistance in pregnant individuals.7 Research has demonstrated that individuals with depression also tend to exhibit increased arterial stiffness, which could potentially heighten their risk of developing HDP.4 Additionally, factors such as inflammation and oxidative stress have been shown to be associated with both depression and HDP, possibly creating a positive feedback loop between the two. 4 It is also important to note that some studies have shown that antidepressant and anxiolytic use in early pregnancy can contribute to HDP disorders and therefore must be considered when evaluating the association between depression and HDP.8
The strengths of this study include using a population-based sample that purposively includes at-risk mothers and a high response rate for sampling design. This study had several limitations as well. The cross-sectional study design limits our ability to infer causality between HDP and pre-depression and anxiety. In addition, while preterm birth does not necessarily mean the mother had HDP, the only cure for HDP is pregnancy or inducing the mother. It should be noted that we cannot be clear that the preterm birth was because of HDP.
There are multiple factors associated with HDP; this study supports that pre-pregnancy anxiety is a risk factor for HDP. The serious health problems caused by HDP affect both the mother and the baby across their lifespans. In order to reduce rates of HDP, the risk factors must be reduced. However, not all the associated factors are easy to address. Among the multiple factors associated with HDP, pre-pregnancy anxiety, and depression are factors that we can treat and intervene to reduce risk. This knowledge can lead to the development of programs and treatments focusing on pre-pregnancy anxiety and depression and could have implications for future treatments.
Disclosure Statement
The authors declare that they have no conflict of interest.
Acknowledgments
Data were provided by the Utah Pregnancy Risk Assessment Monitoring System (PRAMS), a project of the Utah Department of Health (UDOH), the Office of Vital Records and Health Statistics of the UDOH, and the Center for Disease Control and Prevention (CDC) of the United States Health and Human Services Department. This report does not represent the official views of the CDC, Utah Department of Health, or the NIH.
The authors would like to acknowledge and thank the contributions of Dr. Karen Schliep, Will Burnett, and Yunah Cho.
References
- Pearlstein T. Depression during Pregnancy. Best Pract Res Clin Obstet Gynaecol. Jul 2015;29(5):754-64. doi:10.1016/j.bpobgyn.2015.04.004
- Thombre MK, Talge NM, Holzman C. Association between pre-pregnancy depression/anxiety symptoms and hypertensive disorders of pregnancy. J Womens Health (Larchmt). Mar 2015;24(3):228-36. doi:10.1089/jwh.2014.4902
- Ford ND, Cox S, Ko JY, et al. Hypertensive disorders in pregnancy and mortality at delivery hospitalization—United States, 2017–2019. Morbidity and Mortality Weekly Report. 2022;71(17):585.
- Yuan M, Bedell S, de Vrijer B, Eastabrook G, Frisbee JC, Frisbee SJ. Highlighting the Mechanistic Relationship Between Perinatal Depression and Preeclampsia: A Scoping Review. Womens Health Rep (New Rochelle). 2022;3(1):850-866. doi:10.1089/whr.2022.0062
- Kalin NH. The Critical Relationship Between Anxiety and Depression. Am J Psychiatry. May 1 2020;177(5):365-367. doi:10.1176/app.ajp.2020.20030305
- Shulman HB, D’Angelo DV, Harrison L, Smith RA, Warner L. The Pregnancy Risk Assessment Monitoring System (PRAMS): Overview of Design and Methodology. Am J Public Health. Oct 2018;108(10):1305-1313. doi:10.2105/AJPH.2018.304563
- Estensen, M.-E., Remme, E. W., Grindheim, G., Smiseth, O. A., Segers, P., Henriksen, T., & Aakhus, S. (2013, April). Increased arterial stiffness in pre-eclamptic pregnancy at term and early and late postpartum: A combined echnocardiographic and tonometric study. American Journal of Hypertension, 26(4), 549-556. DOI: 10.1093/ajh/hps067
- Bernard, N., Forest, J.-C., Tarabulsy, G. M., Bujold, E., Bouvier, D., & Giguere, Y. (2019). Use of antidepressants and anxiolytics in early pregnancy and the risk of preeclampsia and gestational hypertension: a prospective study. BMC Pregnancy and Childbirth, 19(146). DOI: 10.1186/s12884-019-2285-8
Citation
Lee J, Codd N, and Morgan H. (2024). Prenatal Depression and Anxiety and Risk of Hypertensive Disorders of Pregnancy: Findings from the Utah Pregnancy Risk Assessment Monitoring Survey (2016–2020). Utah Women’s Health Review. doi: 10.26054/d-b4jk-797f
Understanding trends in shared reading to inform targeted literacy interventions in early childhood: A data snapshot
Background
Evidence linking arts and health has been mounting, and the World Health Organization (WHO) compiled this evidence in a 2019 report.1 The report explains how the arts combine health-promoting factors (e.g., cognitive stimulation) with an intrinsic desire to experience beauty or creativity. Literature is one artistic medium that can support health and well-being. For example, reading a good book evokes empathy, reduces stress, and makes the brain work hard to understand language, recall information, and imagine written descriptions. Readers may also encounter and engage with themes of health.1
Engaging with literature is especially important during early childhood. Early childhood literacy (ECL) is vital in strengthening future intellectual health – not just academic or health-related knowledge but creativity, curiosity, critical thinking, and problem-solving.2 Shared reading is one example of an ECL-promoting activity. The American Academy of Pediatrics (AAP) encourages families to read with their children as often as possible during the first three years of life as an effective way to strengthen the parent-child relationship and promote brain development around language and reasoning.3 The AAP recommends shared reading up to age three because this is the most intensive period of brain development. Additionally, continued shared reading up to age five is important for school readiness and future educational attainment; children who have consistent shared reading experiences from ages 2 to 5 are more likely to succeed in grade school.4
Further, educational attainment is strongly associated with future health at the population-level.5 The cognitive skills and background knowledge developed during school years help adults choose, for example, healthy lifestyles or understand medication regimens. Individuals who did not finish high school are also less likely to have health insurance.6 Further, education is influenced by other social determinants of health, including income. A study exploring how time in poverty influences high school graduation explained that proficient readers from poor backgrounds are less likely to finish high school than their less proficient counterparts who have never experienced poverty. Additionally, single-parent households – the majority of which are headed by single mothers – are more likely to live in poverty relative to married households (27 vs 8 percent), as well have reduced access to social or economic resources.7,8 However, one study showed that the benefits of shared reading were more strongly associated with educational outcomes (e.g., vocabulary knowledge, future educational success) in low- and middle-income households compared to high-income households.4
Recognizing the importance of reading in early childhood on social determinants of health like education, the Centers for Disease Control and Prevention (CDC) established Healthy People (HP) 2020 and 2030 goals to increase the number of children aged 0-5 whose families read to them frequently. The 2020 goal is the more rigorous of the two, aiming to increase the percentage of families reading with their young child every day to a target of 52.6% of (about 11.8 million) children.9
By understanding how trends in shared reading frequency have changed over time, those invested in early childhood development can make more informed decisions about strategy or resource allocation to reach families who need the most support. This data snapshot reports on the percentage of families in the US who met the HP 2020 target for shared reading, stratifies trends by income and household composition, and discusses recommendations for interventions that increase frequent engagement with literature through shared reading.
Data Snapshot
Data
The Health Services and Resources Administration (HRSA) directs the National Survey of Children’s Health (NSCH), and single- and multi-year data from 2016 to 2022 are publicly available in a searchable online database.10 Single-year survey data for the NSCH question “During the past week, how many days did you or a family member read to this child, age 0-5 years?” informs the HP 2020 goal for shared reading. Income strata are the upper (greater than or equal to 400%) and lower (less than 100%) household Federal Poverty Levels (FPL). Household composition strata are single-parent households (not differentiated by parent sex after 2016) and married households. The error bars show the margin of error for each year’s sample. Sample sizes for each year are in Table 1.
| Table 1. Sample Sizes | |||||
| Year | Total sample | <100% FPL | >400% FPL | Single parent | Married |
| 2016 | 6623 | 491 | 3330 | 403 | 5588 |
| 2017 | 2904 | 288 | 1366 | 219 | 2401 |
| 2018 | 3719 | 316 | 1883 | 451 | 2938 |
| 2019 | 3532 | 276 | 1778 | 342 | 2860 |
| 2020 | 5484 | 453 | 2795 | 548 | 4472 |
| 2021 | 9940 | 757 | 5198 | 939 | 8160 |
| 2022 | 9526 | 708 | 5147 | 918 | 7765 |
Results

Figure 1a shows the percentage of families reading to their children daily, stratified by the lowest and highest income groups. Compared to the benchmark, parents in the highest income category met the target percentage (52.6%) around 2019 and continued to improve until 2022. Among the lowest income group, the percentage of families reading daily to their children was lower than the average across all years and decreased from around 30% in 2016 to around 25% in 2022. The average disparity between high- and low-income families was 26%.
Figure 1b shows the percentage of families reading to their children daily, stratified by household composition. Neither type of household met the benchmark for daily shared reading. Married households increased shared reading from around 40% in 2016 to about 45% in 2022. Meanwhile, shared reading frequency among single-parent households decreased over time, from over 30% in 2016 to around 27% in 2022. The average disparity between married and single-parent households was 15%.
Overall, low-income households, which are also more likely to be single-parent and specifically single-mother homes, have lower frequencies of daily shared reading compared to higher income or married households, and this disparity has been stable over time. Trends for low-income compared to single-parent households over time are almost identical, highlighting the overlap between low-income and single-parent families. Low-income and single-parent families should have the same opportunities to support early childhood literacy as wealthier families. Given the strong influence of education on future health, these trends underscore a need for innovative shared reading interventions that consider factors like income and household composition.
Evidence-based shared reading interventions
A popular intervention to increase shared reading is book gifting, where families receive age-appropriate reading materials and sometimes educational materials for parents on the benefits of reading in early childhood. One of the largest book gifting programs is Reach Out and Read (ROR) – providing over 4.4 million children with reading materials through well-child visits each year.11 Nationally, ROR reaches a large population of low-income families. However, using a social-ecological approach might reach more families.11,12(p1) Table 2 summarizes book gifting interventions situated in multiple settings that positively affected shared reading and longer-term outcomes like school readiness.

Recommendations to promote shared reading in Utah
Utah has a higher percentage of children under 5 in the population (6.9%) compared to the national average (5.6%).16,17 To reach more children from low-income households, state and local policymakers could allocate both political and financial resources to develop or enhance shared reading programs in settings beyond the clinic. To increase access to materials for shared reading for single-mothers, developing or enhancing a program modeled after Little by Little (Table 1) could improve school readiness for some of the 20,000+ children participating in WIC across Utah.18 This option may be particularly well-suited to reach single-mother households who attend WIC programming. Additionally, an intervention like Tender Shoots (Table 1) could teach parents how to improve their shared reading skills and be involved in their child’s learning; Utah already has local infrastructure to support similar community-based programs, namely public libraries and Early Head Start preschools.
Currently, Utah does not monitor data on shared reading. To better understand the unique contexts of Utah families, the NCHS question that informs HP 2020 could be administered through the Behavioral Risk Factor Surveillance System survey. This phone-based survey administered through the Department of Health and Human Services – Health Survey Office collects data on many behavioral, social, and demographic variables.19 Participants who indicate they live with children between 0-5 could be asked how often they or another family member read with the child.
Conclusion
Utilizing the arts as an enjoyable pathway to improved health outcomes can begin in early childhood through ECL-promoting activities like shared reading. Shared reading strengthens intellectual health and helps build a foundation for continued educational attainment. However, data on shared reading frequency show that low-income and single-parent households participate in shared reading less frequently than higher-income or married households. More, this disparity persists over time. These trends underscore a need for shared reading interventions that consider environmental and social factors. Local and state policymakers can advocate for and direct financial resources toward ECL-promoting programs that set young children up for future educational attainment and better health.
References
1. Daisy Fancourt, Saoirse Finn. What Is the Evidence on the Role of the Arts in Improving Health and Wellbeing? A Scoping Review. World Health Organization Regional Office for Europe; 2019:9-28.
2. Harvard University Center for Wellness and Health Promotion. Intellectual. Your Wellbeing. Published 2024. Accessed March 11, 2024. https://wellness.huhs.harvard.edu/intellectual
3. Early Literacy. Accessed February 11, 2024. https://www.aap.org/en/patient-care/early-childhood/early-childhood-health-and-development/early-literacy/
4. Shahaeian A, Wang C, Tucker-Drob E, Geiger V, Bus AG, Harrison LJ. Early Shared Reading, Socioeconomic Status, and Children’s Cognitive and School Competencies: Six Years of Longitudinal Evidence. Sci Stud Read. 2018;22(6):485-502. doi:10.1080/10888438.2018.1482901
5. Marmot MG. Understanding Social Inequalities in Health. Perspect Biol Med. 2003;46(3):S9-S23.
6. US Census Bureau. Differences in Uninsured Rates by Race and Ethnicity Persist Even Among Those With Higher Educational Attainment. Census.gov. Published March 8, 2023. Accessed June 28, 2024. https://www.census.gov/library/stories/2023/03/education-and-racial-disparities-in-health-insurance-coverage.html
7. Hernandez DJ. Double Jeopardy: How Third-Grade Reading Skills and Poverty Influence High School Graduation. Annie E; 2011. Accessed February 11, 2024. https://eric.ed.gov/?id=ED518818
8. Livingston G. The Changing Profile of Unmarried Parents. Pew Research Center. Published April 25, 2018. Accessed June 28, 2024. https://www.pewresearch.org/social-trends/2018/04/25/the-changing-profile-of-unmarried-parents/
9. US Department of Health and Human Services. Increase the proportion of parents who read to their child every day. Search the Data – Healthy People 2020. Published 2021. Accessed February 25, 2024. https://wayback.archive-it.org/5774/20220414213024/https://www.healthypeople.gov/2020/data-search/Search-the-Data?nid=4363
10. Data Resource Center for Child and Adolescent Health. NSCH Interactive Data Query (2016 – present). Explore the data. Published 2022. Accessed February 25, 2024. https://www.childhealthdata.org/browse/survey#52_1_3028
11. Reach Out and Read. Our Impact. Why We Matter. Published 2023. Accessed March 11, 2024. https://reachoutandread.org/why-we-matter/our-impact/
12. Donna McCloskey, Sergio Aguilar-Gaxiola. Chapter 1: Models and Frameworks for the Practice of Community Engagement – The Social Ecological Model of Health.; 2018:20-23. Accessed March 21, 2024. https://www.atsdr.cdc.gov/communityengagement/pce_models.html
13. Connor Garbe M, Bond SL, Boulware C, et al. The Effect of Exposure to Reach Out and Read on Shared Reading Behaviors. Acad Pediatr. 2023;23(8):1598-1604. doi:10.1016/j.acap.2023.06.030
14. Whaley SE, Jiang L, Gomez J, Jenks E. Literacy Promotion for Families Participating in the Women, Infants and Children Program. Pediatrics. 2011;127(3):454-461. doi:10.1542/peds.2009-3572
15. Timperley S, Schaughency E, Riordan J, Carroll J, Das S, Reese E. Tender Shoots: Effects of a Preschool Shared Book Reading Preventive Intervention on Parent–Child Reading and Parents’ Involvement in the First Year of School. School Ment Health. 2022;14(2):238-253. doi:10.1007/s12310-022-09505-6
16. U.S. Census Bureau QuickFacts: Utah. Accessed March 18, 2024. https://www.census.gov/quickfacts/fact/table/UT/PST045223
17. U.S. Census Bureau QuickFacts: United States. Accessed March 18, 2024. https://www.census.gov/quickfacts/fact/table/US/PST045222
18. WIC Data Table. Food and Nutrition Service. Published 2022. Accessed March 21, 2024. https://www.fns.usda.gov/pd/wic-program 19. Utah Department of Health and Human Services. Health Survey Program | Office of Public Health Assessment. Utah Department of Health and Human Services. Accessed March 21, 2024. https://healthassessment.utah.gov/health-survey-program
Citation
Gardner E. (2024). Understanding trends in shared reading to inform targeted literacy interventions in early childhood: A data snapshot. Utah Women’s Health Review. doi: 10.26054/d-0fnw-k39a
Characteristics Associated with Miscarriages in Utah Nail Technicians
Abstract
Objective: Previous studies suggest possible worker over-exposure to hazardous chemicals in nail salons. The purpose of this study was to identify exposure characteristics among nail technicians that might be associated with adverse reproductive health outcomes.
Methods: Using a cross-sectional design, 937 nail technicians licensed in Utah were invited to complete an online questionnaire regarding general and reproductive health, working career, and common health and safety practices. The relationship between nail technicians who had been pregnant and experienced at least one miscarriage was compared to nail technicians with a history of pregnancy but no miscarriages to identify potentially relevant characteristics.
Results: Ninety (90) nail technicians participated in the survey. Of those who reported ever having been pregnant, 36% (17/47) reported having had at least one miscarriage. Those who had experienced a miscarriage were significantly younger (mean ~10 years) than those who had been pregnant but did not report a history of miscarriage. Although those who had a history of miscarriage were less likely to use exposure control equipment, that difference was not statistically significant.
Conclusion: High miscarriage rates in participants indicate that further study is needed. Since selection bias may have affected who chose to complete the survey, a larger sample size and additional community engagement is needed.
Implications: Future research should seek to obtain a higher participation rate, quantify chemical exposures directly, examine health symptoms, and understand what exposure control measures are most effective. With continued research, the hope is that technicians can see improved health and safety over their working careers.
Introduction
Occupational exposures experienced by cosmetologists are associated with a significantly increased risk of adverse reproductive health effects, including infertility, reductions in fetal growth, fetal death, and preterm delivery.1-4 Specifically, chemicals found in nail products (e.g., formaldehyde, toluene, dibutyl phthalate, etc) have been shown to result in increases in fertility problems or pregnancy loss,5,6 congenital birth defects,7 effects similar to Fetal Alcohol Syndrome,8,9 and possible epigenetic risks transmitted to later generations.10 Most cosmetologists are reproductive-age women, with nail technicians being an especially vulnerable population. A large percentage of nail technicians are racial/ethnic minorities, with one estimate for the US indicating 72% are Vietnamese,11 and many experience inadequate pay and personal protections.12 With approximately 163,600 manicurists and pedicurists employed today, and a projected growth of 22% by 2031, additional research is needed to determine what associations, if any, exist between hazardous chemical exposure and adverse reproductive health outcomes among nail technicians.13
Previous studies examining workplace exposures in nail salons are limited, but literature that is available points to a concerning trend towards overexposure to hazardous chemicals, including acetone, butyl acetate, ethyl acetate, ethyl methacrylate (EMA), formaldehyde, isopropyl acetate, methacrylic acid, methyl methacrylate (MMA), and phthalates.14-19 Air monitoring of nail salons within the state of Utah found formaldehyde concentrations were above the National Institute for Occupational Safety and Health (NIOSH) Recommended Exposure Limit (REL) in 58% of establishments studied, with MMA (banned in Utah) found in a majority of establishments as well.17 Exposure controls (engineering, administrative practices, and personal protective equipment) are a key to reducing/preventing exposure, but their use in practice appears to be lacking.20,21 It is well understood that some exposure controls that remove a chemical before it can reach workers (e.g., local ventilation) are more effective than controls that rely on workers to use them properly (e.g., masks).5 Therefore, this study sought to investigate the protective practices for exposure, and reproductive health outcomes of nail technicians.
Methods
This cross-sectional study surveyed nail technicians who are currently or formerly licensed in the state of Utah via an online questionnaire regarding general and reproductive health, working career, as well as common health and safety practices. The study was reviewed by the University of Utah Institutional Review Board (IRB) and considered exempt.
Participants
The list of all nail technicians who are currently or formerly licensed in Utah (as of October 2020) was obtained from the Utah Department of Occupational and Professional Licensing (DOPL) (n=10,109). The information obtained included the following: full name, address, date of license, date of license expiration, phone number, and email address (optional). The study included nail technicians with both active and expired licenses to reduce the risk of bias linked to the healthy worker effect; i.e. this method included nail technicians who have potentially retired, quit working due to health complications, or left the industry.
Out of all 10,109 nail technicians formerly or currently licensed with the state, a computerized random number generator was used to randomly select a subset of 1,000 to invite to complete the questionnaire. The questionnaire was then distributed via two means: first, a postcard listing the URL of the survey was sent to the mailing address of each participant. For those participants with email addresses on file (n=710), a total of three email reminders with the survey address were also sent. Potential participants were incentivized to complete the survey by an entry into a gift card drawing.
Questionnaire
The questionnaire was administered using SurveyMonkey, a mobile-friendly platform that was easily accessible on either a computer or a smartphone. SurveyMonkey was also selected due to the ability to offer participants their choice of preferred language between Vietnamese and English. The survey was translated into Vietnamese by a certified translator and verified by a native-speaker who works in healthcare. The survey was conducted between November 2020 and January 2021.
The questionnaire was designed to be completed in approximately 20 minutes and is a modified version of a previously used tool for assessing lifetime reproductive outcomes.22 The survey consisted of questions regarding general health, menstrual history, sexual history, becoming pregnant/conceiving, pregnancy outcomes, fertility, fertility treatment, and demographic information. The survey also contained questions regarding work history and the use of exposure controls such as local ventilation or personal protective equipment (PPE) during work. A question was also included asking participants to comment and evaluate the survey with the aim of improving future iterations.
If participants did not wish to answer any one question, they could do either by skipping the question or answering with “Prefer not to answer.” To prevent unnecessary confusion, the online survey was designed with skip logic; for example, if a participant answered “Never” to the question “How many times have you been pregnant?” the survey would automatically skip them from answering questions pertaining to pregnancies and live births. Therefore, the number eligible to respond varied for each question. If participants failed to answer any of the questions pertaining to the variables included in the statistical analysis (number of miscarriages, years worked, hours worked per week, smoking status, drinking status, age, race, and household income), they were excluded from further analysis (i.e., complete case analysis).
Responses were submitted without personally identifiable information. IP address tracking was also turned off to further remove any identifying information. Responses from the questionnaire were stored and maintained in Excel (Microsoft, Redmond, Washington) and statistical analysis was performed using SAS statistical software (SAS Institute, Cary, NC).
Data Analysis
Respondents were grouped based on their history of pregnancy and/or miscarriage, including (1) never been pregnant, (2) prior pregnancy but no miscarriages, and (3) at least one miscarriage, i.e., analysis by outcome group (case control). Due to the small sample size, fisher’s exact test was used to compare the groups with prior pregnancy (with and without miscarriage) across the various categories of interest. For continuous variables a t-test was used to compare group means between the miscarriage vs non-miscarriage groups. When there were unequal variances, a Welch test was performed. Statistical analyses were performed using SAS statistical software.
There is limited research in the area of nail salon exposure controls, so a novel approach to analyzing those data is presented here. For this, a protective equipment usage score was developed specially for this work and was calculated for each respondent, as shown in Figure 1. For each type of control equipment used, a different value was given to each, based on the potential control it provided, including: a score of 2 for a loose mask (e.g., surgical mask) and/or a large fan (i.e., room fan), a score of 3 for gloves and/or a small fan (i.e., personal/table fan), a score of 4 for a snug mask (e.g., N95) and/or a ventilated table, and a score of 5 for a cartridge respirator and/or a local exhaust ventilation hood. These scores were based on the hierarchy of controls, such that more protective engineering controls (e.g., ventilation) were given higher priority than personal protective equipment (e.g., loose mask).5 As an additional variable, the frequency of use for each piece of equipment was incorporated into a “weighted score”. In this case, “Never” = 0, “Several clients per year” = 0.1, “Several clients per month” = 1.2, “Several clients per week” = 4.8, and “Every client” = 10. For example, somebody who used a loose mask for every client would get 20 pts, and if that person also used a ventilated table for several clients per week, they would get an additional 19.2 pts for a total of 39.2 pts.

Results
Overall Respondent Characteristics
Out of the 1,000 randomly chosen participants who were mailed a postcard, 101 were returned as undeliverable. Out of the 710 emails sent, 38 emails were bounced back on all three attempts. Ultimately, 63 participants either did not have emails on file, had incorrect emails, or had undeliverable postcards; a total of 937 participants either received an email or a postcard inviting them to participate (Figure 2).

After 2 months, 90 nail technicians responded to the survey (response rate of 9.6%). The mean proportion of the survey that was completed for each participant was 82%, with a mean completion time of approximately 12 minutes. A total of 85 (94%) participants submitted the survey in English and 5 (6%) submitted the survey in Vietnamese. However, only 68 people had usable information regarding the birth related outcomes. Nine (9) respondents did not answer those questions. A further thirteen (13) provided conflicting answers, for example the number of miscarriages was greater than the number of pregnancies. In those cases where the answers did not match, the data were not included in the analysis. The primary analysis included here is for those with a history of pregnancy, broken out by those with (n=17) and without (n=30) a history of miscarriage. Summary data for all respondents and those who had never been pregnant are provided in supplemental material (Table S1 and S2).
The mean age of registered nail technicians who responded was 33.6 years old. Participants were predominantly White (63.3%) and Vietnamese (13.3%). The mean number of years worked as a nail technician was 7.8 years with a median of 5 years. The mean number of hours worked per week for nail technicians was 25.5 hours. 36% (n=17) of participants who had been pregnant (n=47) experienced at least one miscarriage in their life. About half, 48.9% (n=44) of nail technicians reported having received training on how to reduce their exposures to chemicals at work. It was found that 65.6% of nail technicians who responded reported having a monthly period, 28.9% reported adult acne, 10% reported thyroid disease, 11.1% reported high blood pressure, and 3.3% reported a cancer diagnosis. Participants indicated relatively healthy habits: 81% of the participants were non-smokers and 71% do not drink any alcohol regularly (see Table S1). The overall health of the study population may be reflected in Utah’s wider population, as Utah was ranked the seventh healthiest state by the United Health Foundation in 2022, and has very low rates for use of tobacco or alcohol.23
Comparison of Respondents with and without Miscarriages
Respondents who reported having at least one miscarriage were on average younger by approximately 10 years (p=0.004) (see Table 1). They were also more likely to be single compared to the non-miscarriage and never pregnant groups (25% vs 11.5%), although that difference was not statistically significant (p=0.128). The miscarriage group was more likely to have a BMI >30 (52.9%) compared to the non-miscarriage group (30%), but that relationship was also not statistically significant.


In terms of their work, the miscarriage group had less experience than the non-miscarriage group (median of 2 years vs 9 years; p=0.017) and saw fewer clients per day (median = 2 vs 4; p=0.03). The miscarriage group was also more likely to work <20 hours per week compared to the non-miscarriage group (81.3% vs 44.8%), which was not quite a significant difference (p=0.063). These variables are likely related to the fact that the miscarriage group was much younger on average than the non-miscarriage group.
The clinical characteristics for the miscarriage and non-miscarriage groups are shown in Table 2. The non-miscarriage group reported a median number of live births of 2 compared to the miscarriage group, with a median of 1. Again, this could be explained by the age difference between these groups. It is also interesting to note that the miscarriage group reported 13.3% rate of low birth weight babies, compared to 7.1% in the non-miscarriage group. Overall, there were no statistically significant differences between the miscarriage group and the non-miscarriage group for the clinical characteristics of interest.


The calculated protective equipment scores and the frequency of use for different control methods are shown in Table 3. The median weighted protective equipment usage score for nail technicians with no history of miscarriage was 43.5, compared to a median of 26.2 for those with at least one miscarriage. This corresponds to fewer types of protective equipment used and/or less frequent use of any such equipment for those with a miscarriage, although this difference was not statistically significant (p=0.837). Nail technicians, on average, used ventilated downdraft tables the most (34.5% in the non-miscarriage group and 25% in the miscarriage group used them for every client), followed by a loose mask (30% use for every client, n=27). The least used control method was half-face cartridge respirators, with 100% of respondents with a history of pregnancy having never used one. In both groups, more than half of respondents (62.1% of non-miscarriage group and 68.8% of the miscarriage group) reported never using gloves when performing their work.


Discussion
This study offers fresh insight into an understudied and potentially vulnerable occupational population. Based on the limited use of protective equipment, there exists a potential for high chemical exposures and thereby pregnancy complications. It also provides insight into contacting nail technicians and overcoming barriers associated with the typical nail-salon (i.e., smaller, family-run, non-English speakers), as well as a novel way to quantify the use of exposure control strategies.
The small sample size prevents definitive conclusions, and limits reliance on statistical significance, but there are several findings that may inform future research. One finding of concern was that 36% of respondents who had been pregnant reported having experienced at least one miscarriage, a number that seems high compared to the ~10-20% of all known pregnancies in the general population that end in miscarriage24; about 25% of women experience a miscarriage in their lifetime.25 The percentage found here is also higher than a previous study of nail technicians on the East Coast of the United States which found 15.6% of nail technicians who have been pregnant experienced at least one miscarriage.26 It is possible that selection bias, such that the respondents do not reflect the overall population of interest based on self-selection into the study, may over-estimate the miscarriage rate. Additionally, the <10% response rate may also affect interpretation of this finding, but additional research is still warranted. A higher response rate may help confirm if miscarriages are in fact more prevalent in this population and whether the variables that were found to be significant here remain important. The known reproductive toxicity of many of the chemicals in nail products5-10 also supports this association, but further epidemiological research is clearly warranted in this area.
Of concern, ~34% (n=31) of all respondents indicated that they had not received training on how to reduce their exposure to chemicals at work, and ~17% (n=15) were unsure of whether they had received such training. This represents an important target for outreach related to occupational health and safety in this population. In the hierarchy of controls, training is considered a critical administrative control that helps ensure workers understand their potential exposure and how to properly use available control methods.5 However, barriers to reaching nail technicians have not yet been resolved. Results from this study indicate that a response rate of 10% could be expected for simple email/postcard recruitment. Additional recruitment strategies, including community engagement, would help increase participation, especially in non-English speaking technicians and other demographics that may have been under-represented among these respondents. For example, connecting with community and/or religious groups to build trust around participation in such research activities is recommended for future work with this population.
Additionally, variables such as obesity,27-31 uncontrolled diabetes,32 uncontrolled thyroid disease,33,34 and alcohol consumption31,35 have been shown to be associated with miscarriage. Future studies should account for these additional risk factors in this population.
Limitations
The use of a voluntary questionnaire can have certain biases, particularly selection or volunteer bias. A nail technician who has experienced reproductive issues that they attribute to work as a nail technician may be more likely to fill out the survey compared to someone who does not have known reproductive issues. Alternatively, nail technicians who have had miscarriages may not want to fill out the questionnaire due to past trauma from pregnancy loss. The end of the survey contained an area for participants to provide feedback about the survey. Responses from participants included statements such as “don’t ask such personal questions” and “you are asking a lot of personal questions”. These statements suggest that it is possible that participants with more reproductive health issues may have declined to answer some questions. Future work needs to help participants understand the importance of information about reproductive health.
Sex was inadvertently left out as a demographic question, so there is the possibility that male technicians were invited to participate but ended up skipping most of the questions since they asked about female reproductive health. The percentage of registered nail technicians who are male in the state of Utah would be something to consider in the future, but the estimate nationally is approximately 2%.11 The effect on these results is expected to be minimal, especially as the primary analysis was only conducted on those respondents who reported a history of pregnancy. The questionnaire also did not capture the timing of when the miscarriages occurred, although the young age of when the respondents began work as a nail technician (21-22 years old) suggests most miscarriage likely occurred after they began work.
Another limitation of this study was that the actual chemical exposures of the participants were not measured directly. It was assumed that the years worked as a nail technician, the hours worked per week, and the use of an exposure control was related to the total chemical exposure a nail technician would have experienced. However, a nail technician who may have received high chemical exposures at work may have quit being a nail technician early on due to suffering adverse health symptoms. In that case, the nail technician may have received significant chemical exposure but only worked for a few years. Similarly, nail technicians who work for many years or decades and have a lower chemical exposure may be more likely to stay employed in that industry. In that scenario, the prevalence of miscarriages may be decreased even though the number of years worked was high.
Health Implications
The population of nail technicians is understudied in terms of chemical exposures and their resulting health. The goal of this study was to better characterize the nail technician population in Utah, their use of common controls against exposure to VOCs, and understand their reproductive health outcomes. Although no statistically significant association between use of protective equipment and miscarriages was found, a high overall rate of miscarriage was reported for this population. The number of nail technicians who have not received any training on how to limit their exposures to chemicals at work is also concerning. This study could help inform future studies that include a larger and more representative population of nail technicians. It could also justify an education and training initiative to help educate nail technicians on the hazards present in their workplace. Another goal of this study was to inform future efforts to engage this occupational population, which has been historically difficult to reach due to language and other communication barriers. Research in the future that quantifies the chemical exposure, examines health symptoms, and understands what exposure control measures are being used could help address some of the limitations of the current work. With continued research, the hope is that the population of nail technicians can see improved health and safety over their working careers.
Funding Sources
Funding for this work was made possible by the University of Utah Department of Family and Preventive Medicine’s Health Studies Fund as well as a National Institute for Occupational Safety and Health Education and Research Center training grant (5T42OH008414).
Conflict of Interest
This work was funded by the University of Utah Department of Family and Preventive Medicine and the National Institute for Occupational Safety and Health. DS has also received money for other research from the National Institutes of Health (NIH) and the US Department of Defense (DOD). The authors declare no conflicts of interest.
Acknowledgements
Funding for this work was made possible by the University of Utah Department of Family and Preventive Medicine’s Health Studies Fund as well as a National Institute for Occupational Safety and Health Education and Research Center grant (T42OH008414). Author contributions include: study design (AT, BM, SS, EM, JS, DS), data collection (AT, DS), data analysis (AT, BM, SS, EM, JS, DS), initial manuscript (AT), manuscript writing/editing (AT, BM, SS, EM, JS, DS). Data are available upon request.
Disclosures
All study procedures were reviewed and approved by the University of Utah Institutional Review Board. Informed consent was obtained from each participant before data collection. No financial interest or benefit has arisen from the direct application of this research.
References
- Baste V, Moen BE, Riise T, Hollund BE, Oyen N. Infertility and Spontaneous Abortion Among Female Hairdressers: The Hordaland Health Study. J Occup Environ Med. 2008;50(12):1371–1377.
- Kim D, Kang M-Y, Choi S, Park J, Lee H-J, Kim E-A. Reproductive Disorders among Cosmetologists and Hairdressers: A Meta-Analysis. Int Arch Occup Environ Health. 2016;89(5):739–753.
- Pak V, Powers M, Liu J. Occupational Chemical Exposures Among Cosmetologists: Risk of Reproductive Disorders. Workplace Health Saf. 2013;61(12):522–528.
- Halliday-Bell JA, Gissler M, Jaakkola JJ. Work as a Hairdresser and Cosmetologist and Adverse Pregnancy Outcomes. Occup Med. 2009;59(3):180–184.
- National Institute for Occupational Safety and Health (NIOSH), Centers for Disease Control and Prevention (CDC). About Hierarchy of Controls. April 10, 2024. Available at: https://www.cdc.gov/niosh/hierarchy-of-controls/about/index.html. Accessed August 6, 2024.
- Xu W, Zhang W, Zhang X, Dong T, Zeng H, Fan Q. Association between Formaldehyde Exposure and Miscarriage in Chinese Women. Medicine (Baltimore). 2017;96(26):e7146.
- McDonald JC, Lavoie J, Cote R, McDonald AD. Chemical Exposures at Work in Early Pregnancy and Congenital Defect: a Case-Referent Study. Br J Ind Med. 1987;44(8):527–533.
- Bowen SE, Hannigan JH. Developmental Toxicity of Prenatal Exposure to Toluene. AAPS J. 2006;8(2):E419-E424.
- Hannigan JH, Bowen SE. Reproductive Toxicology and Teratology of Abused Toluene. Syst Biol in Reprod Med. 2010;56(2):184–200.
- Wine RN, Li LH, Barnes LH, Gulati DK, Chapin RE. Reproductive Toxicity of Di-n-Butylphthalate in a Continuous Breeding Protocol in Sprague-Dawley Rats. Environ Health Perspect. 1997;105(1):102–107.
- Nails Magazine. Industry Statistics. 2018-2019 The Big Book. Available at: https://lsc-pagepro.mydigitalpublication.com/publication/?m=61302&i=612248&p=1&pre=1&ver=html5. Accessed July 27, 2023.
- National Institute for Occupational Safety and Health (NIOSH), Centers for Disease Control and Prevention (CDC). Workplace Safety and Health Topic: Nail Technicians’ Health and Workplace Exposure Control. February 7, 2018. Available at: http://www.cdc.gov/niosh/topics/manicure/default.html. Accessed July 27, 2023.
- Bureau of Labor Statistics (BLS), US Department of Labor. Occupational Outlook Handbook: Manicurists and Pedicurists. October 4, 2022. Available at: http://www.bls.gov/ooh/personal-care-and-service/manicurists-and-pedicurists.htm. Accessed July 27, 2023.
- Occupational Safety and Health Administration (OSHA), US Department of Labor. Safety and Health Topics: Health Hazards in Nail Salons. Available at: https://www.osha.gov/nail-salons. Accessed July 28, 2023.
- Park S, Gwak S, Choi S. Assessment of Occupational Symptoms and Chemical Exposures for Nail Salon Technicians in Daegu City, Korea. J Prev Med Pub Health. 2014;47(3):169–176.
- Lamplugh A, Harries M, Xiang F, Trinh J, Hecobian A, Montoya LD. Occupational Exposure to Volatile Organic Compounds and Health Risks in Colorado Nail Salons. Environ Pollut. 2019;249:518–526.
- Alaves VM, Sleeth DK, Thiese MS, Larson RR. Characterization of Indoor Air Contaminants in a Randomly Selected Set of Commercial Nail Salons in Salt Lake County, Utah, USA. Int J Environ Health Res. 2013;23(5):419–433.
- Nguyen LV, Diamond ML, Kalenge S, Kirkham TL, Holness DL, Arrandale VH. Occupational Exposure of Canadian Nail Salon Workers to Plasticizers Including Phthalates and Organophosphate Esters. Environ Sci Tech. 2022;56:3193-3203.
- Varshavsky JR, Morello-Frosch R, Harwani S, Snider M, Petropoulou S-SE, Park J-S et al. A Pilot Biomonitoring Study of Cumulative Phthalates Exposure among Vietnamese American Nail Salon Workers. Int J Environ Res Pub Health. 2020;17:325.
- Roelofs C, Do T. Exposure Assessment in Nail Salons: An Indoor Air Approach. ISRN Public Health. 2012;962014:1-7.
- Harrichandra A, Roelofs C, Pavilonis B. Occupational Exposure and Ventilation Assessment in New York City Nail Salons. Ann Work Exp Health. 2020;64(5):468-478.
- Thomas FS, Stanford JB, Sanders JN, et al. Development and Initial Validation of a Fertility Experiences Questionnaire. Reprod Health. 2015;12(1):62.
- United Health Foundation. America’s Health Rankings: 2022 Annual Report. Available at: https://www.americashealthrankings.org/learn/reports/2022-annual-report. Accessed July 27, 2023.
- Mayo Foundation for Medical Education and Research (MFMER). Miscarriage. October 16, 2021. Available at: http://www.mayoclinic.org/diseases-conditions/pregnancy-loss-miscarriage/symptoms-causes/syc-20354298. Accessed July 27, 2023.
- Cochrane Pregnancy and Childbirth Group, Ghosh J, Papadopoulou A, Devall AJ, Jeffery HC, Beeson LE, et al. Methods for managing miscarriage: a network meta‐analysis. Cochrane Database Syst Rev. 2021;2021(6): CD012602.
- Ma GX, Wei Z, Husni R, et al. Characterizing Occupational Health Risks and Chemical Exposures Among Asian Nail Salon Workers on the East Coast of the United States. J Community Health. 2019;44(6):1168-1179.
- Lee JC, Bernardi LA, and Boots CE. 2020. “The Association of Euploid Miscarriage with Obesity.” F&S Reports 1 (2): 142–48. https://doi.org/10.1016/j.xfre.2020.05.011.
- Malasevskaia, Iana, Salma Sultana, Aiman Hassan, Azza A Hafez, Fethi Onal, Handenur Ilgun, and Stacey E Heindl. 2021. “A 21st Century Epidemy-Obesity: And Its Impact on Pregnancy Loss.” Cureus, January. https://doi.org/10.7759/cureus.12417.
- Cavalcante, Marcelo Borges, Manoel Sarno, Alberto Borges Peixoto, Edward Araujo Júnior, and Ricardo Barini. 2018. “Obesity and Recurrent Miscarriage: A Systematic Review and Meta‐analysis.” Journal of Obstetrics and Gynaecology Research 45 (1): 30–38. https://doi.org/10.1111/jog.13799.
- Potdar, Neelam, and Cecilia Iyasere. 2023. “Early Pregnancy Complications Including Recurrent Pregnancy Loss and Obesity.” Best Practice & Research in Clinical Obstetrics & Gynaecology 90 (August): 102372. https://doi.org/10.1016/j.bpobgyn.2023.102372
- Nilsson, Sandra Feodor, Pk Andersen, Katrine Strandberg‐Larsen, and Anne‐Marie Nybo Andersen. 2014. “Risk Factors for Miscarriage from a Prevention Perspective: A Nationwide Follow‐up Study.” BJOG: An International Journal of Obstetrics and Gynaecology 121 (11): 1375–85. https://doi.org/10.1111/1471-0528.12694.
- Negrato, Carlos Antônio, Rosiane Mattar, and Marı́Lia B. Gomes. 2012. “Adverse Pregnancy Outcomes in Women with Diabetes.” Diabetology & Metabolic Syndrome 4 (1). https://doi.org/10.1186/1758-5996-4-41.
- Carney, Leo A. 2014. “Thyroid Disease in Pregnancy.” AAFP. February 15, 2014. https://www.aafp.org/pubs/afp/issues/2014/0215/p273.html.
- Koyyada, Arun, and Prabhakar Orsu. 2020. “Role of Hypothyroidism and Associated Pathways in Pregnancy and Infertility: Clinical Insights.” Tzu Chi Medical Journal 32 (4): 312. https://doi.org/10.4103/tcmj.tcmj_255_19.
- Sundermann, A, Sifang Kathy Zhao, Chantay L Young, LeAnn Lam, Sara Jones, Digna R. Velez Edwards, and Katherine E. Hartmann. 2019. “Alcohol Use in Pregnancy and Miscarriage: A Systematic Review and Meta‐Analysis.” Alcohol: Clinical & Experimental Research 43 (8): 1606–16. https://doi.org/10.1111/acer.14124.
Supplemental Tables


Citation
Trollan A, Mark B, Spiess S, Moreno LE, Stanford JB, & Sleeth DK. (2024). Characteristics Associated with Miscarriages in Utah Nail Technicians. Utah Women’s Health Review. doi: 10.26054/d-0ks3-wdbm
The association between preconception polycystic ovary syndrome and gestational diabetes mellitus among women with and without pre-pregnancy hypertension: a cross-sectional study from Utah’s Pregnancy Risk Assessment Monitoring System Survey (2016-2021)
Abstract
Objectives: The objective of this study is to test the association between preconception polycystic ovary syndrome (PCOS) and gestational diabetes mellitus (GDM) using Utah’s Pregnancy Risk Assessment Monitoring System (2016-2021). In addition, pre-pregnancy hypertension will be tested as a potential effect moderator.
Methods: This cross-sectional study utilizes data from Phase 8 of the Utah Pregnancy Risk Assessment Monitoring System (PRAMS) survey (2016-2021). The association between PCOS and GDM was tested using Poisson regression to generate adjusted prevalence ratios and 95% confidence intervals.
Results: PCOS was associated with higher prevalence of GDM in all models, regardless of whether the outcome data (GDM) came from the infant’s birth certificate, the PRAMS survey, or the combined measure. When adjusting for sociodemographic characteristics, lifestyle factors, reproductive history, and comorbidities, women with PCOS were 1.50 (1.16-1.95) times as likely to have GDM (reported on birth certificate and/or survey) compared to women without PCOS. Pre-pregnancy hypertension was not found to be a statistically significant effect moderator.
Conclusion: The findings from this study were consistent with the majority of research indicating that women with PCOS have increased risk for GDM. This is also the first known study to test pre-pregnancy hypertension as an effect moderator between PCOS and GDM. More research is needed on the role of comorbidities such as chronic hypertension as effect modifiers between PCOS and GDM.
Implications: These findings show that women with PCOS are at high risk for GDM, among a population-based sample of mothers. Interventions to reduce the risk of GDM among women with PCOS need to be developed and evaluated.
Introduction
An estimated 5-15% of women have polycystic ovary syndrome (PCOS).1 The three diagnostic features according to the Rotterdam Criteria are ovulatory dysfunction such as anovulation and oligo-ovulation, hyperandrogenism, and polycystic ovaries. Patients must display two of the three to be diagnosed.2 In addition, clinicians must exclude other conditions with similar presentations, such as congenital adrenal hyperplasia, Cushing’s syndrome and androgen-secreting tumors, and drug-induced androgen excess.2
PCOS is a major contributor to infertility. Ovulatory disorders account for approximately 25% of infertility diagnoses; 70% of women with anovulation have polycystic ovary syndrome.3 In addition to being at increased risk for infertility, women with PCOS have elevated risk of obesity, type II diabetes, hyperlipidemia, depression, anxiety, obstructive sleep apnea, nonalcoholic fatty liver disease, endometrial cancer, and cardiovascular disease.4,5 The cause of PCOS is unknown and there is no cure.
Gestational diabetes mellitus (GDM) is a glucose tolerance disorder that starts during pregnancy and affects approximately 6% of pregnancies. The prevalence of GDM has had a relative increase of approximately 78% in the last two decades. The rising prevalence of GDM over the last few decades is concerning because GDM is associated with pre-eclampsia, macrosomia, and future metabolic diseases in the mother and child.6
Prior studies have produced mixed findings regarding the presence and magnitude of the association between PCOS and GDM. The majority of the literature including the most recent meta-analysis found that women with PCOS have elevated risk of GDM compared to women without PCOS.6 The objective of this study is to test the association between preconception PCOS and GDM using Utah’s Pregnancy Risk Assessment Monitoring System (2016-2021). Utilizing these data allows the association between preconception PCOS and GDM to be tested among a representative population-based sample. This study includes women who are often underrepresented in hospital or clinic-based studies, such as Hispanics and women of low socioeconomic status.
Another unique feature of this study is that pre-pregnancy hypertension will be tested as a potential effect moderator between PCOS and GDM. PCOS is considered a heterogeneous disorder with multiple phenotypes which affect a person’s health risks at different stages of life.7 The purpose of testing pre-pregnancy hypertension as an effect moderator is to determine if the risk of GDM differs among women with and without pre-pregnancy hypertension. This information could contribute to our understanding of the underlying mechanism between PCOS and GDM as well as inform clinical decisions and treatment.7
Methods
Study Design
This cross-sectional study utilizes data from the 2016-2021 Utah Pregnancy Risk Assessment Monitoring System (PRAMS) survey which is a joint project between state, local, tribal, and territorial health departments and the Centers for Disease Control and Prevention (CDC).
Data Sources
PRAMS data collection began in 1987 to understand why some infants are born healthy and others are not. It was designed to identify groups of women and infants at high risk for health problems, monitor changes in health status, and measure progress toward goals in improving the health of mothers and infants.8 PRAMS surveillance began in Utah in 1999.9
Approximately 200 new mothers are randomly selected to participate each month from Utah birth certificates.9 Recruitment for PRAMS occurs according to the protocol developed by the CDC which combines statewide mailings of the surveys and telephone follow-up to women who do not complete the survey by mail. A key feature of PRAMS is the stratified systematic sampling, which over samples from populations of interest based on factors such as maternal age, race/ethnicity, geographic area of residence, and infant birth weight.10 The survey is available in both English and Spanish.
The data used in this study were from the Utah PRAMS Phase 8 (2016-2021) questionnaire (n=8,491) reflecting an estimated population of 279,355 women. The design and sampling frame assure the study sample is representative of Utah’s population. The unweighted response rates in Utah were 55.6% in 2016, 60.2% in 2017, 54% in 2018, 69.5% in 2019, 60.9% in 2020, and 52.6% in 2021.8
Outcome Measures
The outcome of interest for this study was whether or not a woman was diagnosed with gestational diabetes mellitus (GDM) during her most recent pregnancy. This outcome was measured in two ways. First, as a field on the birth certificate and second as a self-reported item on the PRAMS survey. On the survey women were asked, “during your most recent pregnancy, did you have any of the following health conditions?” One of the listed conditions was, “gestational diabetes (diabetes that started during this pregnancy)” and respondents were instructed to check yes or no. Estimates of the association between preconception polycystic ovary syndrome (PCOS) and gestational diabetes mellitus (GDM) will be provided using each outcome measurement method separately as well as a combined measure, which includes mothers who self-reported GDM for index pregnancy via PRAMS survey and those for whom GDM was indicated on the birth certificate. 8012 observations (96.4%) were categorized consistently for GDM between the survey and the birth certificate. However, 85 respondents did not self-report whether or not they had GDM on the survey and 59 respondents were categorized as not having GDM on the survey though it was indicated on the birth certificate. Conversely, 158 respondents self-reported having GDM on the survey though it was not indicated on the birth certificate. The combined GDM measure is the most inclusive outcome measurement and classifies observations as having had GDM if they self-reported GDM on the survey or if GDM was indicated on the birth certificate.
In prior studies, both birth certificate data and maternal recall have demonstrated excellent validity for variables related to labor and delivery when compared to medical records.11 Furthermore, one study using New York state PRAMS data found good agreement between birth certificate and self-reporting on the PRAMS survey specifically for GDM.12 Though both measurement methods are believed to have a high degree of validity, due to the 85 missing values for GDM on the survey, the birth certificate record may be the most valid measurement method for this study.
Covariates
Potential confounding factors believed to influence both PCOS and GDM were determined based on prior literature.1,4,5,6 Sociodemographic covariates include maternal age in years, yearly total household income before taxes during the 12 months before the new baby was born (categorical), maternal education (categorical), race/ethnicity (white/non-white and Hispanic/non-Hispanic), marital status (married/not married), and urban/rural residence. Salt Lake, Davis, Utah, and Weber counties were categorized as urban, and all others were categorized as rural. Lifestyle factors included cigarette smoking within the last two years (yes/no), drinking within the last two years (yes/no), and pre-pregnancy BMI (categorical). Reproductive history and comorbidities including previous live birth (yes/no), infertility treatment (yes/no), depression during the three months before getting pregnant (yes/no), and anxiety during the three months before getting pregnant (yes/no) were also considered as potential confounding factors. The following covariates were collected on the survey: maternal age, family income, cigarette smoking, drinking, pre-pregnancy BMI, pre-pregnancy depression, and pre-pregnancy anxiety. The following covariates were collected on the birth certificate: maternal education, race/ethnicity, marital status, urban/rural residence, previous live birth, and infertility treatment.
Respondents self-reported hypertension during the three months before getting pregnant (yes/no) on the survey. Pre-pregnancy hypertension was tested as an effect moderator is to determine if the risk of GDM differs among women with PCOS with and without comorbid hypertension.
Statistical Analysis
After excluding observations with missing values for PCOS (n=156) and hypertension (n=21), 8314 women (97.9%) were included in the analyses, reflecting an estimated population size of 274,023 women (Figure 1). Participant characteristics were reported by PCOS status, the exposure of interest. All variables were categorical and are reported as weighted percentages. Descriptive characteristics of respondents with and without PCOS were calculated by chi-square tests, taking into account the stratified survey sampling.
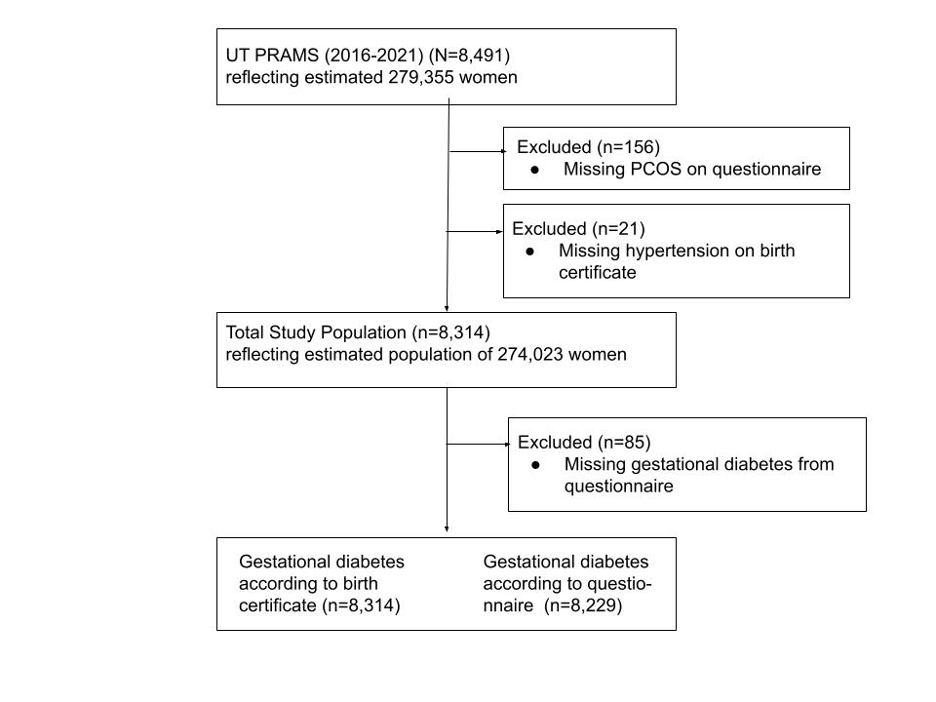
The association between PCOS and gestational diabetes was tested using Poisson regression models with a robust error variance. The models accounted for PRAMS’ use of stratified sampling and generated adjusted prevalence ratios (PR) and 95% confidence intervals (CI). The reference group in all models was mothers without PCOS. Pre-pregnancy hypertension was tested as an effect modifier using a stratified analysis and the Wald test. SAS Studio 9.4 and Stata 16.1 were used for data analysis.
Results
Characteristics of the Mothers
The majority of the respondents were non-Hispanic white (77.7%), received education beyond high school (70.4%), were married (81.7%), and lived in an urban area (76.4%) (Table 1). The median maternal age was 28.5 among respondents with PCOS and 27.9 among respondents without PCOS (Table 1). Most of the women were parous (65.4%), had a normal pre-pregnancy BMI (47.9%), and had not smoked cigarettes (90.7%) or drank alcohol (65.6%) within the last two years before becoming pregnant (Table 1).
Table 1. Sociodemographic, lifestyle and clinical characteristics of women by polycystic ovary syndrome (PCOS) status, Utah PRAMS, 2016-2021, n=8,314, reflecting an estimated population size of 274,023 women
| Characteristic | Overall | No PCOS | PCOS | P-value (chi-square) |
| Maternal Age (%) | ||||
| 15-19 | 3.2 | 3.3 | 1.4 | |
| 20-29 | 54.3 | 54.4 | 52.7 | |
| 30-39 | 40.0 | 39.7 | 43.0 | |
| 40+ | 2.6 | 2.6 | 3.0 | 0.08 |
| Family Income (%) | ||||
| $0-$20,000 | 14.2 | 14.5 | 11.3 | |
| $20,001-$32,000 | 13.5 | 13.7 | 10.7 | |
| $32,001-$57,000 | 22.1 | 22.1 | 22.3 | |
| $57,001-$85,000 | 20.9 | 20.8 | 22.3 | |
| $85,001+ | 23.6 | 23.1 | 29.4 | <0.00 |
| Maternal Education (%) | ||||
| Less than HS | 7.4 | 7.7 | 4.3 | |
| HS/GED | 19.6 | 19.7 | 17.4 | |
| Some College | 21.8 | 21.8 | 22.0 | |
| Associate | 10.7 | 10.5 | 13.1 | |
| Bachelors | 30.1 | 29.9 | 32.1 | |
| Masters, Doctorate/Professional | 7.8 | 7.7 | 8.6 | 0.09 |
| Race/ethnicity (%) | ||||
| Hispanic, non-white | 4.2 | 4.4 | 2.0 | |
| Hispanic, white | 11.9 | 12.0 | 11.1 | |
| Non-Hispanic, white | 77.7 | 77.3 | 82.5 | |
| Non-Hispanic, non-white | 6.0 | 6.2 | 4.1 | 0.01 |
| Married (%) | 81.7 | 81.5 | 84.5 | 0.13 |
| Rural (%) | 23.6 | 23.7 | 21.4 | 0.30 |
| Smoking (%) | 9.3 | 9.4 | 9.3 | 0.07 |
| Drinking (%) | 34.4 | 34.2 | 36.4 | 0.52 |
| Body Mass Index (BMI) (%) | ||||
| Underweight (<18.5) | 3.8 | 4.0 | 1.7 | |
| Normal (18.5-24.9) | 47.9 | 49.2 | 31.3 | |
| Overweight (25.0-29.9) | 24.2 | 24.3 | 22.7 | |
| Obese (30.0+) | 22.9 | 21.2 | 42.8 | |
| Unknown | 1.3 | 1.3 | 1.5 | <0.00 |
| Depression (%) | 18.5 | 17.1 | 35.9 | <0.00 |
| Anxiety (%) | 28.1 | 26.4 | 48.8 | <0.00 |
| Hypertension (%) | 3.9 | 2.4 | 22.5 | <0.00 |
| Previous live birth (%) | 65.4 | 65.7 | 62.6 | 0.21 |
| Infertility treatment (%) | 6.8 | 5.0 | 30.1 | <0.00 |
b. Cigarette smoking and drinking up to two years before pregnancy
c. Depression, anxiety, and hypertension diagnoses prior to pregnancy
2. Missing frequencies for characteristics: family income n=552 (6.6%), maternal education n=321 (3.9%), race/ethnicity n=17 (0.2%), smoking n=84 (1.0%), drinking n=112 (1.3%), depression n=15 (0.2%), anxiety n=16 (0.2%)
Compared to women without PCOS, women with PCOS were more likely to be non-Hispanic white, have higher family income, be older, and have higher educational attainment (Table 1). Women with PCOS also had significantly higher rates of obesity (42.8% vs. 21.2%), depression (35.9% vs. 17.1%), anxiety (48.8% vs. 26.4%), hypertension (22.5% vs. 2.4%), and utilization of infertility treatment (30.1% vs. 5.0%) compared to women without PCOS (Table 1).
Association Between Polycystic Ovary Syndrome (PCOS) and Gestational Diabetes Mellitus (GDM)
PCOS was associated with higher prevalence of GDM in all models, regardless of whether the outcome data came from the infant’s birth certificate, the PRAMS survey, or the combined measure. Estimates did not meaningfully differ between the different GDM variables (Table 2). After adjusting for sociodemographic characteristics of age, educational attainment, family income, race/ethnicity, marital status, and urban/rural, women with PCOS were 2.14 times (95% CI: 1.63–2.81) as likely to have GDM using the birth certificate measure, 2.0 times (95% CI: 1.54–2.60) as likely to have GDM using the PRAMS survey measure, and 2.02 times (95% CI: 1.57–2.59) as likely to have GDM using the combined measure compared to women without PCOS (Table 2).
After further adjustment by lifestyle factors of cigarette smoking, alcohol drinking, and BMI, women with PCOS were 1.64 times (95% CI: 1.24–2.17) as likely to have GDM using the birth certificate measure, 1.56 times (95% CI: 1.20–2.04) as likely to have GDM using the PRAMS survey measure, and 1.58 times (95% CI: 1.23–2.03) as likely to have GDM using the combined measure compared to women without PCOS (Table 2).
The final model was further adjusted by reproductive history and comorbidities including previous live birth, infertility treatment, depression, anxiety, and hypertension. In the final model women with PCOS were 1.49 (95% CI: 1.11–2.01) times as likely to have GDM using the birth certificate measure, 1.53 times (95% CI: 1.16–2.01) times as likely to have GDM using the PRAMS survey measure, and 1.50 (95% CI 1.16–1.95) times as likely to have GDM using the combined measure compared to women without PCOS (Table 2).
Table 2. Association between polycystic ovary syndrome (PCOS) and gestational diabetes mellitus (GDM)
| Gestational Diabetes (GDM) | |||||
| Unadjusted PR (95% CI) | Model 1 PR (95% CI) | Model 2 PR (95% CI) | Model 3 PR (95% CI) | ||
| GDM – Birth Certificate | |||||
| PCOS | 2.04 (1.56-2.68) | 2.14 (1.63-2.81) | 1.64 (1.24-2.17) | 1.49 (1.11-2.01) | |
| No PCOS | 1.0 (Reference) | 1.0 (Reference) | 1.0 (Reference) | 1.0 (Reference) | |
| GDM – Survey | |||||
| PCOS | 1.94 (1.51-2.51) | 2.00 (1.54-2.60) | 1.56 (1.20-2.04) | 1.53 (1.16-2.01) | |
| No PCOS | 1.0 (Reference) | 1.0 (Reference) | 1.0 (Reference) | 1.0 (Reference) | |
| GDM – Birth Certificate or Survey | |||||
| PCOS | 1.92 (1.50-2.45) | 2.02 (1.57-2.59) | 1.58 (1.23-2.03) | 1.50 (1.16-1.95) | |
| No PCOS | 1.0 (Reference) | 1.0 (Reference) | 1.0 (Reference) | 1.0 (Reference) | |
b. Model 1 was adjusted by sociodemographic characteristics of maternal age, maternal education, family income, race/ethnicity, marital status, and urban/rural
c. Model 2 was further adjusted by lifestyle factors of cigarette smoking, drinking, and BMI
d. Model 3 was further adjusted by reproductive history or comorbidities of previous live birth, infertility treatment, depression, anxiety, and hypertension
e. Poisson regression models with robust error variance, taking into account stratified sampling used to calculate PRs and 95% CIs
Association Between Polycystic Ovary Syndrome (PCOS) and Gestational Diabetes Mellitus (GDM) Stratified by Pre-Pregnancy Hypertension Status
Unexpectedly, the results of the stratified analysis suggest that women with PCOS who did not have comorbid pre-pregnancy hypertension had higher prevalence of GDM than women with PCOS and comorbid pre-pregnancy hypertension. However, the results were not statistically significant using the Wald test in models that adjusted for lifestyle factors, reproductive history, and comorbidities. Women with PCOS who did not have comorbid pre-pregnancy hypertension did have significantly higher risk of GDM in all models compared to women without PCOS (Table 3).
Table 3. Relationship between polycystic ovary syndrome and gestational diabetes mellitus, stratified by hypertension status
| Gestational Diabetes (GDM) | |||||
| Unadjusted PR (95% CI) | Model 1 | Model 2 | Model 3 | ||
| GDM – Birth Certificate | |||||
| PCOS and Hypertension | 1.27 (0.67-2.38) | 1.20 (0.62-2.33) | 1.01 (0.52-1.98) | 1.08 (0.56-2.11) | |
| PCOS without Hypertension | 2.27 (1.70-3.03) | 2.41 (1.81-3.22) | 1.80 (1.34-2.42) | 1.60 (1.16-2.21) | |
| Wald Test for Hypertension | 0.02 | 0.04 | 0.27 | 0.41 | |
| GDM – Survey | |||||
| PCOS and Hypertension | 1.37 (0.79-2.36) | 1.13 (0.61-2.10) | 0.96 (0.52-1.81) | 1.09 (0.59-2.04) | |
| PCOS without Hypertension | 2.11 (1.60-2.78) | 2.25 (1.71-2.97) | 1.72 (1.30-2.28) | 1.64 (1.21-2.22) | |
| Wald Test for Hypertension | 0.01 | 0.01 | 0.08 | 0.14 | |
| GDM – Birth Certificate or Survey | |||||
| PCOS and Hypertension | 1.31 (0.78-2.21) | 1.13 (0.63-2.03) | 0.97 (0.53-1.76) | 1.08 (0.59-1.97) | |
| PCOS without Hypertension | 2.10 (1.61-2.74) | 2.27 (1.74-2.96) | 1.74 (1.33-2.26) | 1.61 (1.22-2.14) | |
| Wald Test for Hypertension | 0.00 | 0.00 | 0.05 | 0.11 | |
b. The reference group was women without PCOS for each estimate
c. Model 1 was adjusted by sociodemographic characteristics of maternal age, maternal education, family income, race/ethnicity, marital status, and urban/rural
d. Model 2 was further adjusted by lifestyle factors of cigarette smoking, drinking, and BMI
e. Model 3 was further adjusted by reproductive history or comorbidities of previous live birth, infertility treatment, depression, anxiety, and hypertension
f. Poisson regression models with robust error variance, taking into account stratified sampling used to calculate PRs and 95% CIs
Discussion
The primary finding of this statewide sample of mothers 2-4 months postpartum indicate that women who reported having been diagnosed with preconception PCOS had significantly higher prevalence of GDM compared to women without PCOS when controlling for confounding variables. Hypertension was not found to be a statistically significant effect moderator. This test was done to contribute to our understanding of the underlying mechanism between PCOS and GDM as well as inform clinical care. However, it’s possible the effect moderator was not significant because of the small number of women with both PCOS and hypertension (n=158).
It is also possible that pregnant women with PCOS who do not have comorbid pre-pregnancy hypertension do not receive the same extent of clinical care as women with comorbid conditions and this contributes to their elevated risk of GDM. Women with chronic hypertension, high blood pressure at or above 140/90 mmHg before getting pregnant, are at higher risk of preeclampsia, which is a leading cause of maternal mortality.7,13 This elevated risk may cause women with pre-pregnancy hypertension to receive more care than pregnant women without hypertension. For example, women with pre-pregnancy hypertension are recommended to receive preconception health care, discuss medications that are safe to take during pregnancy, monitor blood pressure at home, and make lifestyle modifications to promote a healthy diet and regular physical activity.13 These interventions designed to reduce the risk of hypertensive disorders of pregnancy (HDP) may also reduce the risk of GDM.
Interpretation
The findings from this study were consistent with the majority of research including three previous meta-analyses. Yu et al. (2016) reported that women with PCOS showed an elevated prevalence of GDM (RR = 2.78, 95% CI: 2.27–3.40).6 Khomami et al. (2019) reported women with PCOS had a higher prevalence of GDM (OR = 2.89, 95% CI: 2.37–3.54)14 and Boomsma et al. (2006). found that PCOS in pregnancy significantly increased the risk of GDM (OR = 2.94, 95% CI: 1.70–5.08).15 Though the risk of GDM was elevated among women with pre-pregnancy PCOS, the estimates for this study using a population-based cohort of women in Utah were lower than the risk ratios and odds ratios of the meta-analyses by Yu et al. (2016), Khomami et al. (2019), and Boomsma et al. (2006). This could be due to Utah’s population being a younger and healthier population compared to the populations of the other studies, which were mainly comprised of women recruited from clinical settings.
Limitations
Limitations of this study include the retrospective nature of the PRAMs questionnaire, which limits the ability to infer causality. The questionnaire collects information from postpartum mothers about experiences they had before and during pregnancy which depend on participant’s accurate recall. Social desirability may also have impacted the collection of data on potential confounders since new mothers may not wish to report certain lifestyle behaviors. Another limitation is that that the PRAMS survey is restricted to women who successfully had a live birth. Women with PCOS may be underrepresented because of subfertility. This is important because the results may differ if women who have not yet conceived were included. Classifying women with PCOS based on self-reported diagnosis likely underestimates the number of women with PCOS, compared to using self-reported symptoms to identify women with PCOS. However, this misclassification of the exposure biases the results toward the null. Even more broadly, the lack of a biomarker that can be used in PCOS diagnosis is a significant limitation that affects all research on PCOS. Finally, this dataset did not have information on PCOS phenotype which would have been useful in the analysis.
Strengths
Strengths of this study include the population-based sample which is representative of Utah due to its systematic stratified sampling scheme. This increases the generalizability of the results. The PRAMS questionnaire and linked birth records allowed for detailed information about sociodemographic characteristics, lifestyle, reproductive history, and comorbidities to be used to assess potential confounding. Finally, GDM was measured through the birth certificate, PRAMS survey, and through a combined measure.
Health Implications
These findings indicate that women with PCOS are at elevated risk for GDM, among a population-based sample of mothers in Utah. This is the first known study to test the association between PCOS and GDM in Utah but is consistent with prior literature in other populations indicating women with PCOS are at elevated risk for GDM when controlling for confounding factors. This finding should inform the development of clinical care guidelines, health promotion programs, and policies in Utah and locales with comparable populations. Interventions to reduce the risk of GDM among women with PCOS need to be developed and evaluated.
This is also the first known study to test hypertension as an effect moderator between PCOS and GDM. The purpose of testing hypertension as an effect moderator was to determine if the risk of GDM differs among women with PCOS who do and do not have pre-pregnancy hypertension. In this study, women with PCOS who did not have comorbid pre-pregnancy hypertension appeared to have higher prevalence of GDM than women with PCOS and comorbid hypertension. However, the results were not statistically significant in models that adjusted for lifestyle factors, reproductive history, and comorbidities. Future studies should explore whether in practice women with pre-pregnancy hypertension receive more clinical care than those without pre-pregnancy hypertension. If this is the case, and future research indicates that these interventions lower their risk of GDM, these interventions may also be beneficial to women with PCOS. More research is needed on the role of comorbidities such as hypertension as effect modifiers between PCOS and GDM, the causal mechanisms between PCOS and GDM, and interventions to prevent GDM among women with PCOS.
Acknowledgements
Data were provided by the Utah Pregnancy Risk Assessment Monitoring System, a project of the Utah Department of Health (UDOH), the Office of Vital Records and Health Statistics of the UDOH, and the Centers for Disease Control and Prevention (CDC) of the United States Department of Health and Human Services. The authors extend appreciation to the participants who made the study possible. This report does not represent the official views of the UDOH or CDC.
Funding
Dr. Karen Schliep was supported by a NIH National Institute of Aging (NIA) grant, “Hypertensive Disorders of Pregnancy and Subsequent Risk of Vascular Dementia, Alzheimer’s Disease, or Related Dementia: A Retrospective Cohort Study Taking into Account Mid-Life Mediating Factors” (K01AG058781).
References
- Azziz, Ricardo. “Introduction: Determinants of Polycystic Ovary Syndrome.” Fertility and Sterility, vol. 106, no. 1, 2016, pp. 4–5, https://doi.org/10.1016/j.fertnstert.2016.05.009.
- The Rotterdam ESHRE/ASRM-sponsored PCOS consensus workshop group. “Revised 2003 Consensus on Diagnostic Criteria and Long-Term Health Risks Related to Polycystic Ovary Syndrome (PCOS).” Human Reproduction, vol. 19, no. 1, Jan. 2004, pp. 41–47, https://doi.org/10.1093/humrep/deh098.
- Carson, Sandra Ann, and Amanda N. Kallen. “Diagnosis and Management of Infertility: A Review.” JAMA, vol. 326, no. 1, July 2021, p. 65, https://doi.org/10.1001/jama.2021.4788.
- Shrivastava, Sneha, and Rosemarie L. Conigliaro. “Polycystic Ovarian Syndrome.” Medical Clinics of North America, vol. 107, no. 2, 2023, pp. 227–34, https://doi.org/10.1016/j.mcna.2022.10.004.
- Cooney, Laura G., and Anuja Dokras. “Beyond Fertility: Polycystic Ovary Syndrome and Long-Term Health.” Fertility and Sterility, vol. 110, no. 5, 2018, pp. 794–809, https://doi.org/10.1016/j.fertnstert.2018.08.021.
- Yu, Hai-Feng, et al. “Association between Polycystic Ovary Syndrome and the Risk of Pregnancy Complications: A PRISMA-Compliant Systematic Review and Meta-Analysis.” Medicine, vol. 95, no. 51, 2016, p. e4863, https://doi.org/10.1097/MD.0000000000004863.
- Mirza, Fadi G., et al. “Polycystic Ovarian Syndrome (PCOS): Does the Challenge End at Conception?” International Journal of Environmental Research and Public Health, vol. 19, no. 22, Nov. 2022, p. 14914, https://doi.org/10.3390/ijerph192214914.
- Centers for Disease Control and Prevention. PRAMS Methodology. 28 Mar. 2023, https://www.cdc.gov/prams/methodology.htm.
- Utah Department of Health & Human Services. “Maternal and Infant Health Program.” Utah PRAMS, https://mihp.utah.gov/pregnancy-and-risk-assessment. Accessed 18 July 2023.
- Shulman, Holly B., et al. “The Pregnancy Risk Assessment Monitoring System (PRAMS): Overview of Design and Methodology.” American Journal of Public Health, vol. 108, no. 10, 2018, pp. 1305–13, https://doi.org/10.2105/AJPH.2018.304563.
- Ziogas, Christina, et al. “Validation of Birth Certificate and Maternal Recall of Events in Labor and Delivery with Medical Records in the Iowa Health in Pregnancy Study.” BMC Pregnancy and Childbirth, vol. 22, no. 1, 2022, p. 232, https://doi.org/10.1186/s12884-022-04581-7.
- Hosler, Akiko S., et al. “Agreement Between Self-Report and Birth Certificate for Gestational Diabetes Mellitus: New York State PRAMS.” Maternal and Child Health Journal, vol. 14, no. 5, 2010, pp. 786–89, https://doi.org/10.1007/s10995-009-0529-3.
- CDC. “High Blood Pressure During Pregnancy.” Centers for Disease Control and Prevention, 19 June 2023, https://www.cdc.gov/bloodpressure/pregnancy.htm.
- Bahri Khomami, Mahnaz, et al. “Increased Maternal Pregnancy Complications in Polycystic Ovary Syndrome Appear to Be Independent of Obesity—A Systematic Review, Meta‐analysis, and Meta‐regression.” Obesity Reviews, vol. 20, no. 5, 2019, pp. 659–74, https://doi.org/10.1111/obr.12829.
- Boomsma, C. M., et al. “A Meta-Analysis of Pregnancy Outcomes in Women with Polycystic Ovary Syndrome.” Human Reproduction Update, vol. 12, no. 6, Aug. 2006, pp. 673–83, https://doi.org/10.1093/humupd/dml036.
Citation
Myrer RS, Adediran E, Ellsworth AD, Ceballos RM, Lopez I, Stanford JB, Talboys S, Wang J, Schliep KC. (2024). The association between preconception polycystic ovary syndrome and gestational diabetes mellitus among women with and without pre-pregnancy hypertension: a cross-sectional study from Utah’s Pregnancy Risk Assessment Monitoring System Survey (2016-2021). Utah Women’s Health Review. doi: 10.26054/d-k952-0keb
Barriers to Healthy Eating and Physical Activity for Women of Color in Utah
Abstract
Background: Physical inactivity and unhealthy eating are associated with morbidity and mortality, elevating health disparities in underserved communities. This study aims to identify common barriers to fruit/vegetable consumption and physical activity and explore factors associated with these barriers in women of color living in urban Utah.
Methods: The study involves secondary analysis of baseline data from a randomized trial of a wellness-coaching intervention led by Community Health Workers. Study participants from five diverse racial/ethnic communities were interviewed and self-reported demographics, health knowledge and behaviors, and perceived benefits and barriers to healthy behaviors. Self-reported barriers to fruit/vegetable consumption and physical activity were categorized as present or absent. The relationship between number of barriers and demographic factors were analyzed using ANOVA.
Results: Among 485 women in the study, the most reported barriers to fruits/vegetables included quick spoilage (n=203, 41.9%), high cost (n=161, 33.2%), and fruits/vegetables not being a typical part of diet (n=156, 32.2%). The most reported barriers to physical activity included being too tired (n=243, 50.1%), lack of time (n=184, 37.9%), and safety at night (174, 35.9%). More barriers were reported to physical activity than healthy eating. Statistically significant differences in reported barriers were seen between women from different racial/ethnic groups, as well as by age and education.
Conclusions: Among women of color participating in health-behavior change intervention, barriers to fruit/vegetable consumption and physical activity were common and aligned with the seven domains of health. Future interventions should consider these common barriers to improve health behaviors and address health inequity.
This work was supported by the Office on Women’s Health, Department of Heath and Human Services under Grant number: 1CCEWH111018-01-00; and National Center for Advancing Translational Sciences, National Institutes of Health under Grant number: UL1TR000105.
Background
Women’s health is intricately linked to lifestyle factors, particularly physical activity (PA) and nutrition. Lifestyle medicine—an approach that emphasizes healthy lifestyle choices to prevent and treat disease—plays a crucial role in addressing the unique health needs of women. 1 Healthy eating and PA patterns vary across racial and gender groups, with women of color engaging in reportedly low levels of both.2-4 Low levels of PA and fruit and vegetable consumption are associated with increased morbidity and mortality, exacerbating health disparities in often underserved communities.2,5 The Centers for Disease Control and Prevention recommends the consumption of 5-9 servings of fruits and vegetables daily and at least 150 minutes of PA per week to reduce the risk of chronic disease.6,7 Perceived barriers to healthy living often lead to reduced engagement in these behaviors.8,9 For example, common reported barriers to fruit and vegetable consumption and PA among African American and Hispanic/Latina women include fatigue, cost, competing family demands, cultural norms, and access among others.10-14 No research has been reported examining barriers among Pacific Islander/Native Hawaiian, American Indian/Alaskan Native, and African Immigrant/Refugee women, particularly those living in urban areas. Gathering insights in collaboration with women from diverse community groups may elevate the collective understanding of culturally specific barriers. To address this gap in the literature, our study aims to identify common barriers to fruit and vegetable consumption and physical activity among African immigrants and refugees, African Americans, Hispanic/Latino, Pacific Islander/Native Hawaiian, and American Indian/Alaska Native women. Specifically, we will explore the factors associated with these barriers to healthy lifestyle behaviors.
Data
Methodology
The data reported here were gathered as part of a 5-year study was led by the Coalition for a Healthier Community for Utah Women and Girls (UWAG) and community partners including Utah Women’s Health Coalition and Community Faces of Utah, Best of Africa, Calvary Baptist Church, Hispanic Health Care Task Force, National Tongan American Society, Urban Indian Center, University of Utah, and Utah Department of Health. Community Health Workers, referred to as Community Wellness Coaches for this project, recruited participants and collected the data. Each community organization involved had one to two Community Wellness Coaches dedicated to this effort. Participants (n = 485) were asked verbally during in-person computer-assisted baseline interviews (conducted August 31, 2012 through April 17, 2015) about demographics, health knowledge and behaviors, and perceived benefits and barriers to healthy behaviors collected August 31, 2012 through April 17, 2015.
Self-reported barriers collected during interviews were categorized into four groups: nutrition, physical activity, nutrition access, and physical activity access. A six-point response system was used to rate each barrier, with answer choices of strongly agree, somewhat agree, neither agree nor disagree, somewhat disagree, strongly disagree, or not appliable. For data analyses, barriers were classified as present or not present. For positively worded barriers (e.g., I feel safe walking in my neighborhood at night), responses of somewhat disagree or strongly disagree were coded as endorsing the barrier. For negatively worded barriers (e.g., Fruits and vegetables often spoil before I get the chance to eat them), responses of somewhat agree or strongly agree were coded as endorsing the barrier. The barriers used during interviews with participants were based on previous studies and further validated with input from community leaders. The frequency that each barrier was reported is summarized in Figure 1 and Figure 2. The difference in the average number of barriers by category within groups was evaluated by single-factor ANOVA for specific socio-demographic factors including racial/ethnic group, age, education, employment status, federal poverty level (FPL), marital status, and household composition. Statistical analyses were performed using R Studio 3.6.115 and Microsoft Excel for Microsoft 365.
Results
The study population included 485 women (ages 18 to 80) from African Immigrant/Refugee (n = 83), Hispanic/Latino (n = 138), Native Hawaiian/Pacific Islander (n = 87), and American Indian/Alaska Native (n = 74) communities who resided in Salt Lake and Utah counties. The study was powered to evaluate results across all communities combined but was not powered to assess associations within each individual community.Therefore, socio-demographic and health factors for all communities of participants are summarized in Table 1.
| Sociodemographic Factor | N (%) |
| Racial/Ethnic Group | |
| African Refugee/Immigrant | 83 (17%) |
| African American | 103 (21%) |
| Hispanic/Latina | 138 (28%) |
| Native Hawaiian/Pacific Islander | 87 (18%) |
| American Indian/Alaska Native | 74 (15%) |
| Age | |
| <25 Years | 60 (12%) |
| 25-34 Years | 120 (25%) |
| 35-44 Years | 131 (27%) |
| 45-54 Years | 88 (18%) |
| 55-64 Years | 64 (13%) |
| >65 Years | 22 (5%) |
| Education | |
| Less than High School Degree | 74 (15%) |
| High School Graduate | 129 (27%) |
| Technical School Graduate, Some Technical School, or Certificate | 56 (12%) |
| Associate’s Degree or Some College | 128 (26%) |
| College Graduate or Advanced Graduate Degree | 97 (20%) |
| Employment Status | |
| Full Time | 173 (36%) |
| Part Time or Self-Employed | 109 (22%) |
| Student | 29 (6%) |
| Homemaker | 82 (17%) |
| Retired or Disabled | 39 (8%) |
| Unemployed or Looking for Work | 83 (17%) |
| Federal Poverty Level (FPL) | |
| 100% or Less of the FPL | 224 (46%) |
| 101% – 130% of the FPL | 55 (11%) |
| 131% – 185% of the FPL | 71 (15%) |
| >185% of the FPL | 102 (21%) |
| Not Reported | 33 (7%) |
| Marital Status | |
| Single | 140 (29%) |
| Married | 220 (45%) |
| Living with Partner, Not Married | 43 (9%) |
| Divorced, Separated, or Widowed | 81 (17%) |
| Children in the Home | 140 (29%) |
| No Children <18 | 162 (33%) |
| 1 Child <18 | 83 (17%) |
| 2 Children <18 | 97 (20%) |
| 3 Children <18 | 68 (14%) |
| ≥4 Children <18 | 74 (15%) |
| Elders in the Home | |
| No Elders 65+ | 434 (90%) |
| Any Elders 65+ | 50 (10%) |
| Health Insurance Access | |
| Medicaid | 112 (23%) |
| Other | 186 (38%) |
| Uninsured | 185 (38%) |
| Body Mass Index | |
| Underweight/Normal Weight | 81 (17%) |
| Overweight | 127 (26%) |
| Obese | 276 (57%) |
| Self-Rated Health Status | |
| Excellent/Very Good/Good | 255 (53%) |
| Fair/Poor | 223 (46%) |
| Depression | |
| Positive PHQ-2 Depression Screen (≥3) | 105 (22%) |
| Number of Reported Barriers at Baseline | (Mean (SD), Range) |
| Barriers to Healthy Eating (0-12) | 2.08 (1.95), 0-9 |
| Barriers to Accessing Healthy Foods (0-5) | 0.59 (0.98), 0-4 |
| Barriers to Physical Activity (0-14) | 3.38 (2.84), 0-14 |
| Barriers to Physical Activity Access (0-8) | 1.42 (1.44), 0-7 |
| Number that Reported Zero Barriers | |
| Barriers to Healthy Eating | 115 (24%) |
| Barriers to Accessing Healthy Foods | 321 (66%) |
| Barriers to Physical Activity | 101 (21%) |
| Barriers to Physical Activity Access | 161 (33%) |
The most commonly reported barriers to healthy eating and healthy eating access were quick spoilage of healthy food (n = 203, 41.9%), high cost of healthy food (n = 161, 33.2%), healthy foods not a typical aspect of diet (n = 156, 32.2%), healthy foods not filling enough (n = 121, 24.9%), and family dislikes healthy foods (n = 81, 16.7%). A full summary of reported healthy eating and healthy eating access barriers are shown in Figure 1.

The most commonly reported barriers to physical activity and physical activity access were being too tired to be physically active (n = 243, 50.1%), not having time to be physically active (n = 184, 37.9%), not feeling safe walking in neighborhood at night (n = 174, 35.9%), too many family demands (n = 162, 33.4%), and no partner to exercise with (n = 149, 30.7%). A larger percentage of participants reported PA access barriers in comparison to healthy eating and healthy eating access barriers. A full summary of reported physical activity and physical activity access barriers are shown in Figure 2.

Comparing the average number of barriers reported by category between groups, there was a statistically significant difference in average number of barriers across racial/ethnic groups for nutrition barriers (p <0.00001), nutrition access barriers (p = 0.00003), and physical activity access barriers (p <0.00001). Women in Hispanic/Latino communities reported the highest average number of nutrition barriers (2.66), whereas African immigrant/refugee women reported the lowest average (1.18). Similarly, Hispanic/Latino women faced the greatest number of nutrition access barriers (0.82), while Native Hawaiian/Pacific Islander women reported the fewest (0.33). In terms of physical activity access barriers, women in American Indian/Alaskan Native communities reported the highest average (2.03), in contrast to Native Hawaiian/Pacific Islander women, who reported the lowest average (0.94).
Additionally, age groups exhibited significant differences in the average number of physical activity barriers (p = 0.00683). Specifically, 35–44-year-olds reported the highest average (4.05), while those over 65 years reported the lowest (2.50). Educational attainment also correlated with nutrition access barriers, with significant differences observed (p = 0.00395). technical school graduates, those with some technical school training, or a certificate training reported the highest average number of nutrition access barriers (3.05), whereas individuals with associate degrees or some college reported the lowest average (0.43). There were no significant differences in the average number of reported barriers based on employment status (Full Time, Part Time/Self Employed, Student, Homemaker, Retired/Disabled, Unemployed/Looking for Work), federal poverty level, marital status (Single, Married, Living with Partner/Not Married, Divorced/Separated/Widowed), or household composition (No Children <18, Children <18, No Elders 65+, Elders 65+). Further information on the average number of barriers reported by demographic groups is shown in Table 2.
| Demographics | Nutrition Barriers (Mean (SD)) | Nutrition Access Barriers (Mean (SD)) | Physical Activity Barriers (Mean (SD)) | Physical Activity Access Barriers (Mean (SD)) |
| Ethnic Group | ||||
| African | 1.18 (1.32) | 0.82 (1.24) | 2.87 (2.73) | 1.16 (1.21) |
| African American | 1.73 (1.74) | 0.36 (0.85) | 3.06 (2.55) | 1.26 (1.42) |
| Hispanic/Latino | 2.66 (2.17) | 0.83 (1.04) | 3.83 (3.00) | 1.70 (1.55) |
| Native Hawaiian/Pacific Islander | 2.39 (1.90) | 0.33 (0.71) | 3.48 (2.95) | 0.94 (1.18) |
| American Indian/Alaskan Native | 2.18 (2.06) | 0.49 (0.80) | 3.70 (2.85) | 2.03 (1.51) |
| p-Value | < .00001 | 0.000028 | 0.074553 | < .00001 |
| Age | ||||
| <25 Years | 1.73 (1.61) | 0.68 (1.10) | 2.57 (2.59) | 1.35 (1.39) |
| 25-34 Years | 2.32(2.07) | 0.50 (0.93) | 3.58 (2.98) | 1.37 (1.36) |
| 35-44 Years | 2.39 (1.90) | 0.79 (1.06) | 4.05 (2.89) | 1.49 (1.51) |
| 45-54 Years | 2.15 (2.17) | 0.49 (0.84) | 3.39 (2.79) | 1.52 (1.48) |
| 55-64 Years | 1.78 (1.90) | 0.42 (0.91) | 3.00 (2.62) | 1.25 (1.38) |
| >65 Years | 1.73(1.98) | 0.45 (0.91) | 2.50 (2.54) | 1.73 (1.70) |
| p-Value | 0.126124756 | 0.060286926 | 0.00683965 | 0.713430489 |
| Education | ||||
| Less than High School | 2.15 (2.16) | 0.62 (1.03) | 3.31 (3.06) | 1.38 (1.32) |
| High School Graduate | 2.40 (2.00) | 0.51 (0.88) | 3.40 (2.95) | 1.30 (1.34) |
| Technical School Graduate, Some Technical School, or Certificate | 1.95 (1.83) | 1.02 (1.23) | 3.05 (2.91) | 1.48 (1.43) |
| Associate’s Degree or Some College | 2.01 (1.91) | 0.43 (0.85) | 3.73 (2.86) | 1.67 (1.60) |
| College Graduate or Advanced Graduate Degree | 1.82 (1.84) | 0.63 (0.99) | 3.19 (2.40) | 1.28 (1.44) |
| p-Value | 0.223731 | 0.003955 | 0.519894 | 0.21151 |
* P-values showing significant differences among groups are bolded.
Barriers to a Healthy Lifestyle and the 7 Domains
The data reported here align directly with six of the seven domains of health.16,17 Emotional health barriers were reported, including body image concerns (“don’t look good while exercising”) and lack of prioritizing healthy eating (“not as important as other things”). Environmental health barriers were highlighted for both nutritional factors (“spoil/waste” and “stores in neighborhood don’t sell [fruits and vegetables]”) and physical activity factors (“too much pollution or noise” and “weather makes it hard to exercise”). Financial barriers (high cost or too expensive) were highly reported for nutritional behaviors, with less individuals reporting cost as a barrier to physical activity. Intellectual health barriers included lack of skill in both choosing and preparing fruits and vegetables as well as knowing what to do during exercise. Physical health barriers to health eating behaviors included disliking fruits and vegetables, having a hard time chewing or digesting them, and a lack of knowledge about the benefits associated with consuming fruits and vegetables. The barriers identified by the women were not associated directly with the spiritual health domain. However, in an open-response question, individuals expressed barriers due to a lack of motivation. Exploring motivational factors associated with spiritual health may be valuable to explore in future research.
Resources and Future Recommendations
Examining the barriers associated with physical activity and healthy eating behaviors among women of color provides insights for future research, community programming, and healthcare services. Efforts to reduce the perceived barriers among this unique population have the potential to encourage healthy lifestyle behaviors, reduce the risk and prevalence of chronic diseases, and reduce health inequities in Utah communities.
Several key strengths identified in this study provide guidance for future research and programming. The study examined barriers across various cultural groups, acknowledging that distinct groups of women of color perceive unique barriers to healthy eating and activity. Working as a community-based team that included community leaders, Community Wellness Coaches, and researchers was a key strength of this study. Engaging community members in the research process ensures that the findings are relevant and applicable to the populations being studied. This collaboration fosters trust, enhances the quality of data collected, and empowers community voices, making future research more impactful. Additionally, the analysis performed in this study, which included ANOVA to compare the average number of barriers reported across different demographic groups and the calculation of percentages of participants who reported each barrier, adds rigor to the findings. This multifaceted approach not only highlights disparities but also provides a comprehensive understanding of the barriers faced by diverse groups.
Despite the strengths, several limitations were also identified. Combining vegetable and fruit consumption in the survey limited our ability to examine the dietary habits across the two types of food. Reported perceived barriers to consumption, for example, may differ across fruits and vegetables. Findings from the present study also highlight the diverse interpretations of what the term ‘health’ and ‘physical activity’ mean for each community. While the study provides a valuable For example, physical activity can mean different things in different communities; it might refer to organized sports in one context and daily chores or informal play in another. Analyzing interview responses highlights the need to define ‘physical activity’ more inclusively—covering exercise, daily tasks, and general movement. This would improve transparency, standardize question interpretation, and reduce assimilation bias.examination of perspectives from five unique communities, future research exploring the community story qualitatively is recommended. Finally, for migrant communities, barriers related to access to resources may differ between individuals who recently arrived and those who have been resettled for a longer period. We propose a number of programming strategies in response to awareness of perceived barriers. To effectively support the nutritional needs of women of color, research shows it is essential to create culturally relevant nutritional education initiatives, evaluate food assistance programs, and implement culturally appropriate screening in clinical settings for each community.9 These types of programs can help reduce food insecurity and disparities. Specific to physical activity, designing programs that address broader patterns of time use, including improving sleep time and reducing sedentary behavior time, may mediate the relationship between physical activity and health for women of color.18 Again, physical activity programs need to be culturally tailored. Additional research suggests tailoring enrollment efforts to at-risk women who do not meet the physical activity and/or dietary guidelines to improve cost effectiveness19 and acknowledging the commonalities and differences across culture and gender related to lifestyle behaviors.20 As a follow-up to this study, we propose conducting community-based participatory qualitative research with community leaders to explore how the findings align with or differ from community lived experiences.
References
- Geyer C, McHugh J, Tollefson M. Lifestyle Medicine for Women: The Time Is Now! American Journal of Lifestyle Medicine. 2021;15(4):366-371. doi:https://doi.org/10.1177/15598276211004233.
- Bennett G, Bardon LA, Gibney ER. A Comparison of Dietary Patterns and Factors Influencing Food Choice among Ethnic Groups Living in One Locality: A Systematic Review. Nutrients. 2022;14(5):941. doi:https://doi.org/10.3390/nu14050941.
- Blackwell D, Villarroel M. Tables of Summary Health Statistics for US Adults: 2017 National Health Interview Survey. National Center for Health Statistics. 2018.
- Lorenzo E, Szeszulski J, Todd M, Mama SK, Lee RE. Health Is Power: Active transportation, physical activity, and cardiometabolic health among ethnic minority women. Journal of physical activity and health. 2020;17(3):323-330. doi:https://doi.org/10.1123/jpah.2019-0098.
- 2018 Physical Activity Guidelines Advisory Committee Scientific Report. (U.S. Department of Health and Human Services) (2018).
- Lee SH, Moore LV, Park S, Harris DM, Blanck HM. Adults Meeting Fruit and Vegetable Intake Recommendations — United States, 2019. MMWR Morb Mortal Wkly Rep 2022;71:1–9. DOI: http://dx.doi.org/10.15585/mmwr.mm7101a1.
- Hall KD, Sacks G, Chandramohan D, et al. Quantification of the effect of energy imbalance on bodyweight. The Lancet. 2011;378(9793):826-837. doi:https://doi.org/10.1016/S0140-6736(11)60812-X
- Trilk J, Nelson L, Briggs A, Muscato D. Including lifestyle medicine in medical education: rationale for American College of Preventive Medicine/American Medical Association resolution 959. American Journal of Preventive Medicine. 2019;56(5):e169-e175. doi:https://doi.org/10.1016/j.amepre.2018.10.034.
- Willis SK, Simonsen SE, Hemmert RB, Baayd J, Digre KB, Zick CD. Food Insecurity and the Risk of Obesity, Depression, and Self-Rated Health in Women. Womens Health Rep (New Rochelle). 2020;1(1):308-317. Published 2020 Aug 31. doi:10.1089/whr.2020.0049.
- Bertoni AG, Foy CG, Hunter JC, Quandt SA, Vitolins MZ, Whitt-Glover MC. A multilevel assessment of barriers to adoption of Dietary Approaches to Stop Hypertension (DASH) among African Americans of low socioeconomic status. Journal of health care for the poor and underserved. 2011;22(4):1205-1220. doi:10.1353/hpu.2011.0142.
- Gordon-Larsen P, Nelson MC, Page P, Popkin BM. Inequality in the built environment underlies key health disparities in physical activity and obesity. Pediatrics. 2006;117(2):417-424. doi:https://doi.org/10.1542/peds.2005-0058.
- Lucan SC, Barg FK, Long JA. Promoters and barriers to fruit, vegetable, and fast-food consumption among urban, low-income African Americans—a qualitative approach. American journal of public health. 2010;100(4):631-635. doi:https://doi.org/10.2105/AJPH.2009.172692.
- Shuval K, Leonard T, Murdoch J, Caughy MO, Kohl HW, Skinner CS. Sedentary behaviors and obesity in a low-income, ethnic-minority population. Journal of Physical Activity and Health. 2012;10(1):134-138. doi:https://doi.org/10.1123/jpah.10.1.134.
- Zenk SN, Odoms-Young AM, Dallas C, et al. “You have to hunt for the fruits, the vegetables”: environmental barriers and adaptive strategies to acquire food in a low-income African American neighborhood. Health education & behavior. 2011;38(3):282-292. doi:https://doi.org/10.1177/1090198110372877.
- R Core Team. R: A language and environment for statistical computing. R Foundation for Statistical Computing, Vienna, Austria. 2021. https://www.R-project.org/.
- Frost, C.J. & Digre, K.B., eds. (2016). The 7 Domains of Health: Multidisciplinary Considerations of Women’s Health in the 21st Century. Dubuque, Iowa: Kendall Hunt Publishers.
- Frost, C., Murphy, P., Shaw, J., Jones, K., Varner, M….Digre, K. (2013). Reframing the view of women’s health in the United States: Ideas from a multidisciplinary national center of excellence in women’s health demonstration project. Clin Mother and Child Health, 11(01). https://doi.org/10.4172/2090-7214.1000156.
- Zick CD, Buder I, Waitzman NJ, Simonsen S, Digre K. The nexus between health and time use among racially and ethnically diverse women. Ethnicity & Health. 2019;24(2):147-167. doi:https://doi.org/10.1080/13557858.2017.1315529.
- Buder I, Zick C, Waitzman N, Simonsen S, Sunada G, Digre K. It takes a village coach: Cost-effectiveness of an intervention to improve diet and physical activity among minority women. Journal of Physical Activity and Health. 2018;15(11):819-826. doi:https://doi.org/10.1123/jpah.2017-0285
- Simonsen SE, Digre KB, Ralls B, et al. A gender-based approach to developing a healthy lifestyle and healthy weight intervention for diverse Utah women. Evaluation and Program Planning. 2015;51:8-16. doi:https://doi.org/10.1016/j.evalprogplan.2014.12.003.
Citation
Fernandez M, O’Farrell KD, Digre K, Stark L, Davis FA, Lee D, Mukundente V, Napia E, Sanchez-Birkhead A, Tavake-Pasi F, Villalta J, Brown H, & Simonsen SE. (2024). Barriers to Healthy Eating and Physical Activity for Women of Color in Utah. Utah Women’s Health Review. doi: 10.26054/d-6ffd-2f44
A Review of Group Singing and Social Cohesion: Recommendations for Assessing Social Cohesion in Utah’s Youth
Background
Social cohesion is a fundamental social determinant of health that signifies the strength and quality of relationships among individuals or groups within a given community or society.1-3 It is also an important component of social health as outlined by the 7 Domains of Health, which reflects an individual’s “connection to family, intimate partner, friends, co-workers, and larger structures such as community, church, and workplace.”4 Numerous studies underscore the significance of social cohesion in promoting better mental and physical health, reducing risky behaviors, preventing disease, ensuring access to healthcare, fostering resiliency, promoting health equity, and improving the overall quality of life.5 Additionally, people are more likely to engage in community life, contribute to collective well-being, and experience positive health outcomes when they perceive strong social cohesion within their community.3,5
Social cohesion plays a pivotal role in shaping the overall well-being and health outcomes of individuals and communities, particularly for young people. Mental health is intricately linked to physical health, and maintaining a healthy mental state can mitigate behavioral risks such as substance use, unintended pregnancy, sexually transmitted diseases, and violence, while also reducing rates of self-harm, truancy, and feelings of isolation.6,7 Positive habits developed during adolescence tend to persist into adulthood, reinforcing the importance of fostering strong social cohesion during youth to cultivate lifelong positive health outcomes.
Various approaches can be employed to enhance social cohesion and foster a sense of connectedness, trust, and mutual support within a community.8 These include community engagement and participation, promoting inclusivity, building social networks, supporting social initiatives, investing in public spaces, and celebrating cultural diversity.8 Art and music therapy show promise in improving mental health conditions and social wellbeing.9,10 In particular, participating in a music group cultivates characteristics that strengthen social cohesion.11 Group members share common purposes and goals, create social bonds during rehearsals and performances, rely on effective communication to synchronize their efforts, engage in community outreach activities, and contribute to a sense of continuity and tradition. Research indicates that participating in a music group can expedite the development of strong social cohesion compared to other forms of social interaction.12,13 This holds particular significance for young people, who are in the process of developing their social identities and shaping their worldviews.
Data Snapshot
Given the recognized potential of music groups in fostering social cohesion, a review was undertaken to explore the relationship between group singing and social cohesion. A search of the scientific literature was conducted across multiple electronic databases, including PubMed, PsychINFO, Scopus, and CINAHL, from January to February 2024. Search terms included combinations of social bonding, group singing, social cohesion, choir, chorale, social network, community, and social capital. Articles meeting the following criteria were included in the results: publication date from 2014 to present, written in English, focus on group singing and/or choir participation, measurement of ‘social cohesion’ and/or ‘social bonding’ as a primary or secondary outcome, inclusion of original research studies with scientifically robust study designs, and exclusion of participants with significant mental or physical health conditions. The search yielded a total of 86 articles, from which seven met the predefined inclusion criteria (Table 1).
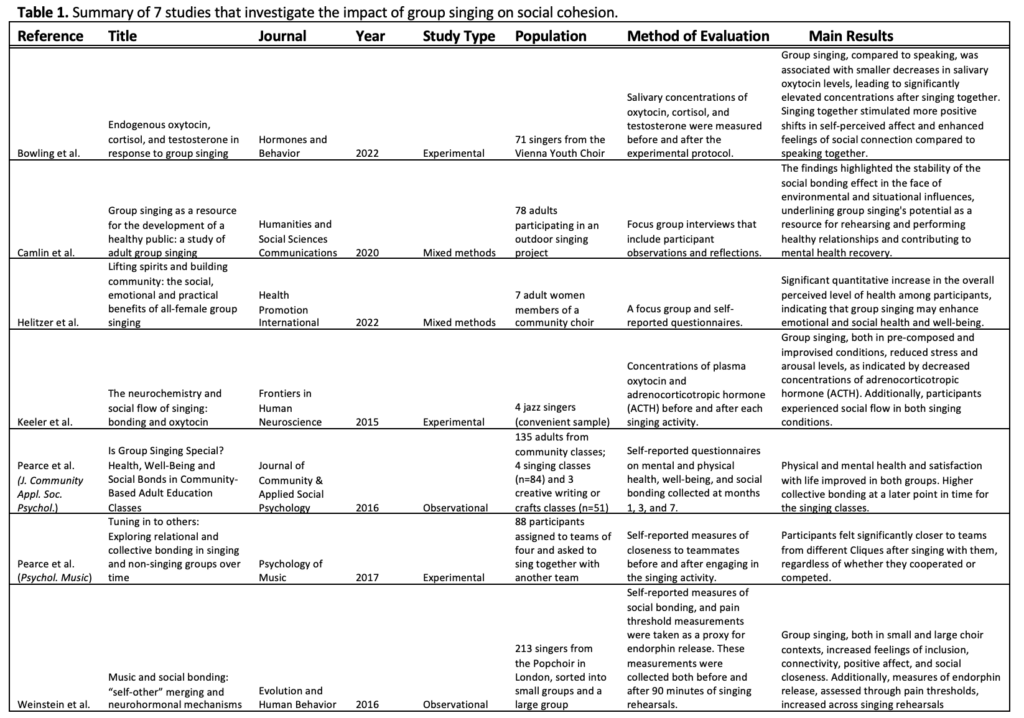
All seven studies included in the review demonstrated a positive correlation between group singing and strengthened social cohesion (Table 1). While all studies demonstrated a positive association between group singing and social cohesion, it is important to note the variations in methodologies, populations, and measures used across studies, which may influence the interpretation of the findings.
Bowling et al measured salivary oxytocin levels (a hormone associated with social bonding and trust) in the Vienna Youth Choir before and after singing as a group and singing alone, as well as before and after speaking as a group and speaking alone.14 Both activities resulted in a decrease in salivary oxytocin; however, singing as a group was associated with a significantly smaller decrease in oxytocin compared to speaking as a group, indicating that group singing may contribute to stronger feelings of social connectedness than group speaking.14 Keeler et al examined plasma oxytocin and adrenocorticotropic hormone (a hormone released in response to stress) levels in jazz singers, reporting reduced stress hormones and increased feelings of connectedness during group singing, although the small sample size (n=4) may limit generalizability.15 In a study of singers from the London Popchoir, Weinstein et al. used self-reported measures of social bonding and pain threshold measurements to conclude that group singing increases feelings of inclusion, connectivity, positivity, and social closeness and may be associated with an increase in endorphin release.16
Pearce et al (J. Community Appl. Soc. Psychol.) followed four community-based singing classes and three non-singing (creative writing and craft) classes over the span of seven months; although physical and mental health and satisfaction of life did not differ between the singing and non-singing groups, group singing may be associated with quicker feelings of social bonding.12 In another study (Pearce et al, Psychol. Music), participants were randomly assigned to teams of four and asked to sing together.17 Self-reported measures of closeness to teammates before and after the singing activity were collected, and participants reported increased feelings of closeness to less-familiar groupmates after singing together.17 Camlin et al conducted focus group interviews of adults participating in an outdoor singing project, and their findings confirm the social bonding effects strengthened by group singing.18 Lastly, Helitzer et al utilized focus group interviews and a questionnaire to assess the social connectedness of an all-female choir, revealing a significant qualitative increase in the overall perceived level of health among participants and indicating that group singing may enhance emotional and social health and well-being.19
Recommendations
Limited research has been conducted quantifying the extent of social cohesion that results from group singing. The studies highlighted in this paper either measure an increase in social cohesion qualitatively or consider it as a secondary outcome alongside related factors, rather than as the primary measure. Furthermore, there is a notable gap in the literature concerning studies that are focused on middle- or high-school-aged participants. Given the ongoing decline in funding for public school arts programs nationwide, coupled with Utah’s overall low expenditure on education,20-23 it becomes imperative to study the impact of school choral and music programs on social cohesion and other factors contributing to youth mental wellbeing.
To address these gaps, it is proposed that the Workplace Social Capital (WSC) scale be adapted to quantify the association between group singing and social cohesion.24,25 Initially introduced by Kouvonen et al. in 200625 and subsequently refined by Eguchi, Tsutsumi, Inoue, and Odagiri in 2017,24 the WSC scale evaluates social capital (defined as “ those features of social relationships that facilitate collective action for mutual benefit”25) and its relation to physical and mental health outcomes. Because the WSC scale is intended to measure social capital among working adults, much of its verbiage does not directly apply to adolescents in a school setting. However, by modifying the scale to be more student-centric, the adapted scale, termed the Social Cohesion Youth Group (SCYG) scale, can effectively gauge the impact of group singing on the social cohesion of adolescents in Utah. Table 2 introduces the proposed SCYG scale alongside the WSC from which it was adapted. The SCYG scale comprises eight questions, each assessed on a Likert scale ranging from 1=strongly disagree to 5=strongly agree. Higher scores denote stronger perceptions of social cohesion.
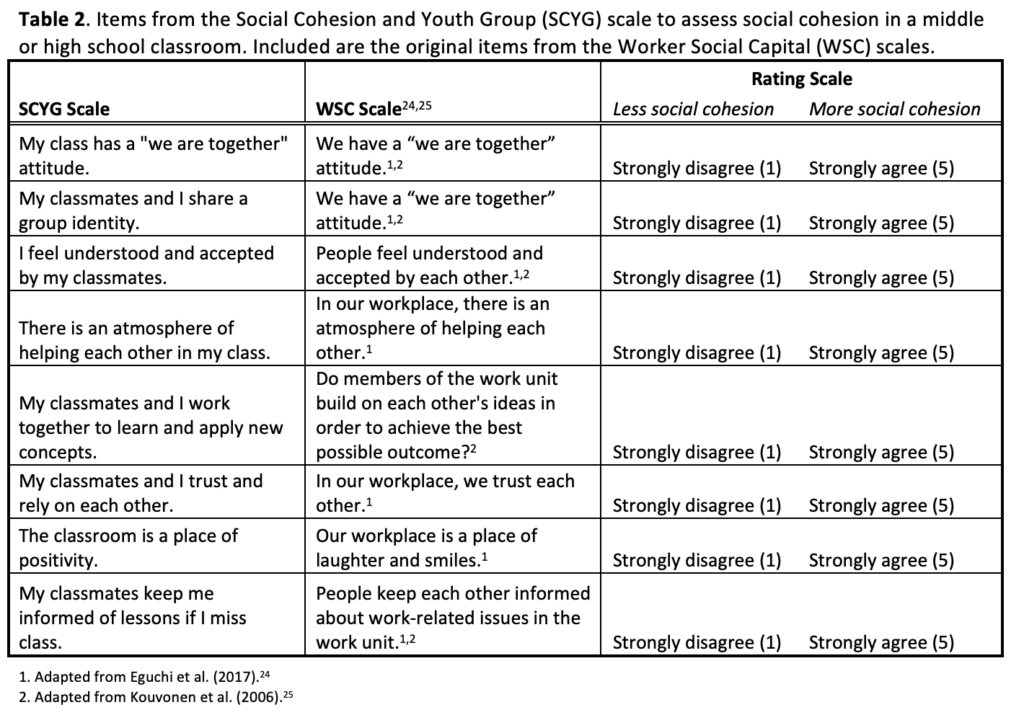
Conclusion
Social cohesion is a crucial social determinant of health and an important component of the 7 Domains of Health, reflecting the interconnectedness, relational quality, and social bonds within communities. Its impact spans various domains, including mental and physical well-being, risk reduction, healthcare access, resilience, equity, and overall quality of life, and it is associated with better mental and physical health, reduced risky behaviors, disease prevention, access to healthcare, resiliency, health equity, and overall quality of life. While existing research underscores the efficacy of art therapy and group singing in strengthening social cohesion, limited attention has been directed towards the efficacy of school choral and music programs in cultivating socially adept and physically and mentally healthy youth. To address this gap, the implementation of the Social Cohesion Youth Group (SCYG) scale, adapted to middle- or high-school students from the Worker Social Capital scale, is a promising method for quantifying the impact of group singing on strengthening social cohesion among adolescents, ultimately demonstrating the importance of the continued funding of school music programs.
References
1. U.S. Department of Health and Human Services. Social Cohesion. Accessed March 11, 2024, https://health.gov/healthypeople/priority-areas/social-determinants-health/literature-summaries/social-cohesion
2. Fancourt D, Finn S. What is the evidence on the role of the arts in improving health and well-being? A scoping review. 2019. Health Evidence Network (HEN synthesis report 67).
3. Centers for Disease Control and Prevention. How Does Social Connectedness Affect Health? Accessed March 11, 2024, https://www.cdc.gov/emotional-wellbeing/social-connectedness/affect-health.htm
4. Frost CJ, Murphy PA, Shaw JM, et al. Reframing the view of women’s health in the United States: Ideas from a multidisciplinary National Center of Excellence in Women’s Health Domenstration Project. JMCH. 2013;11(1)doi:10.4172/2090-7214.1000156
5. Oberndorfer M, Dorner TE, Leyland AH, et al. The challenges of measuring social cohesion in public health research: A systematic review and ecometric meta-analysis. SSM – Population Health. 2022;17doi:10.1016/j.ssmph.2022.101028
6. Ohrnberger J, Fichera E, Sutton M. The relationship between physical and mental health: A mediation analysis. Soc Sci Med. 2017;195:42-49. doi:10.1016/j.socscimed.2017.11.008
7. Feiss R, Pangelinan MM. Relationships between Physical and Mental Health in Adolescents from Low-Income, Rural Communities: Univariate and Multivariate Analyses. International Journal of Environmental Research and Public Health. 2021-02-03 2021;18(4):1372. doi:10.3390/ijerph18041372
8. Centers for Disease Control and Prevention. Ways to Improve Social Connectedness. Accessed March 11, 2024, https://www.cdc.gov/emotional-wellbeing/social-connectedness/ways-to-improve.htm
9. Jay EK, Moxham L, Patterson C. Using an arts‐based approach to explore the building of social capital at a therapeutic recreation camp. International Journal of Mental Health Nursing. 2021-08-01 2021;30(4):1001-1009. doi:10.1111/inm.12856
10. Wang S, Agius M. The use of music therapy in the treatment of mental illness and enhancement of societal wellbeing. Psychiatr Danub. 2018;30:S595-S600.
11. Pesata V, Colverson A, Sonke J, et al. Engaging the Arts for Wellbeing in the United States of America: A Scoping Review. Frontiers in Psychology. 2022-02-09 2022;12doi:10.3389/fpsyg.2021.791773
12. Pearce E, Launay J, Machin A, Dunbar RIM. Is Group Singing Special? Health, Well‐Being and Social Bonds in Community‐Based Adult Education Classes. Journal of Community & Applied Social Psychology. 2016-11-01 2016;26(6):518-533. doi:10.1002/casp.2278
13. Pearce E, Launay J, Dunbar RIM. The ice-breaker effect: singing mediates fast social bonding. Royal Society Open Science. 2015-10-01 2015;2(10):150221. doi:10.1098/rsos.150221
14. Bowling DL, Gahr J, Ancochea PG, et al. Endogenous oxytocin, cortisol, and testosterone in response to group singing. Hormones and Behavior. 2022;139doi:10.1016/j.yhbeh.2021.105105
15. Keeler JR, Roth EA, Neuser BL, Spitsbergen JM, Waters DJM, Vianney J-M. The neurochemistry and social flow of singing: bonding and oxytocin. Frontiers in Human Neuroscience. 2015-09-23 2015;9doi:10.3389/fnhum.2015.00518
16. Weinstein D, Launay J, Pearce E, Dunbar RIM, Stewart L. Singing and social bonding: changes in connectivity and pain threshold as a function of group size. Evolution and Human Behavior. 2016-03-01 2016;37(2):152-158. doi:10.1016/j.evolhumbehav.2015.10.002
17. Pearce E, Launay J, Van Duijn M, Rotkirch A, David-Barrett T, Dunbar RIM. Singing together or apart: The effect of competitive and cooperative singing on social bonding within and between sub-groups of a university Fraternity. Psychology of Music. 2016-11-01 2016;44(6):1255-1273. doi:10.1177/0305735616636208
18. Camlin DA, Daffern H, Zeserson K. Group singing as a resource for the development of a healthy public: a study of adult group singing. Humanities and Social Sciences Communications. 2020-08-05 2020;7(1)doi:10.1057/s41599-020-00549-0
19. Helitzer E, Moss H, O’Donoghue J. Lifting spirits and building community: the social, emotional and practical benefits of all-female group singing. Health Promot Int. 2022;37(6):daac112. doi:doi.org/10.1093/heapro/daac112
20. Nestbitt C. Utah has no plans to change lowest-in-nation education spending, officials say. The Salt Lake Tribune. January 8, 2024. https://www.sltrib.com/news/education/2024/01/08/utah-not-race-outspend-other/
21. American University School of Education. School Funding Issues: How Decreasing Budgets Are Impacting Student Learning and Achievement. Accessed March 11, 2024, https://soeonline.american.edu/blog/school-funding-issues/
22. Morrison N. How the Arts Are Being Squeezed Out of Schools. Forbes. https://www.forbes.com/sites/nickmorrison/2019/04/09/how-the-arts-are-being-squeezed-out-of-schools/?sh=47095520aaf4
23. Wood B. Utah school board gets earful after dropping middle school arts and health requirements. The Salt Lake Tribune. September 20, 2017. https://www.sltrib.com/news/education/2017/09/21/utah-school-board-gets-earful-after-dropping-middle-school-arts-and-health-requirements/
24. Eguchi H, Tsutsumi A, Inoue A, Odagiri Y. Psychometric assessment of a scale to measure bonding workplace social capital. PLoS One. 2017;12(6):e0179461. doi:10.1371/journal.pone.0179461
25. Kouvonen A, Kivimäki M, Vahtera J, et al. Psychometric evaluation of a short measure of social capital at work. BMC Public Health. 2006-12-01 2006;6(1)doi:10.1186/1471-2458-6-251
Citation
Crouch S. (2024). A Review of Group Singing and Social Cohesion: Recommendations for Assessing Social Cohesion in Utah’s Youth. Utah Women’s Health Review. doi: 10.26054/d-wzh2-g09f
Perinatal depression trends in Utah and the role of nurses and integrated behavioral health professionals
Abstract
Objectives: Perinatal depression is a serious condition that many women experience in Utah. Women with this challenge may not receive adequate treatment even when they are screened. This study evaluated the needs of Utah women who are perinatally depressed and identified recommendations for addressing this public health concern.
Methods: Data collected from the Utah PRAMS survey on 8,491 women were analyzed. Of these women, 307 had depressive symptoms and provided substantive comments to the open-ended question. Multivariate logistic regression analysis was performed. The results were expressed as adjusted odds ratios. A qualitative analysis of the open-ended responses was also executed to identify various thematic categories.
Results: Women from a non-white background, women who were not married, and women with lower socioeconomic status had higher odds of experiencing depressive symptoms. In the thematic analysis, most women wished they had received better medical care during pregnancy or at delivery and several described an unmet need related to their depressive symptoms. Many women experienced diseases during the perinatal period while others had a positive pregnancy experience or delivery.
Conclusion: Race, marital status, and socioeconomic status may increase the odds for women in Utah to have postpartum depression. In addition, Utah women with perinatal depression continue to have unmet needs for diagnosis and treatment.
Implications: Though screening services for postpartum depression have improved, Utah should increase the frequency and consistency of screening, provide more training about identifying perinatal depression to nurses and other healthcare professionals, and support integrated behavioral healthcare models to treat perinatally depressed mothers.
Introduction
Perinatal depression is a mood disorder experienced by many women during pregnancy and the postpartum period of 12 months after delivery.1,2,3,4,5,6,7 The American College of Obstetricians and Gynecologists (ACOG)1 indicates that one in seven women will be diagnosed with depression during the perinatal period. Women with perinatal depression may suffer symptoms such as loss of interest, suicidal thoughts, and feeling distant from the baby.3,5,8 The presence of any of these symptoms is associated with major depressive episodes. Diagnosis occurs through screening during regular pregnancy check-ups with a physician. Once diagnosed, women with perinatal depression need resources to receive optimal treatment.
Data collected from the Pregnancy Risk Assessment Monitoring System (PRAMS) survey in Utah show that depression and anxiety rates among pregnant women increased between 2016 and 2020.9 Furthermore, the 2020 Utah statewide needs assessment for maternal and child health indicated that perinatal depression is an issue and that the state needs to expand mental health services to address this disorder.10 The purpose of this study was to evaluate the current needs of women suffering with perinatal depression in Utah and identify approaches to provide them with better healthcare services.
Methods
This is a mixed methods study of data collected from the Utah PRAMS survey from 2016 to 2021. The CDC collects data on maternal attitudes and experiences before, during, and after pregnancy.11 States are permitted to add their own questions to the PRAMS survey with CDC approval. Utah has added questions related to anxiety and depression based on the needs of mothers in Utah. Women completing the survey have an opportunity to respond to an open-ended question as well. This study is a secondary analysis of Utah PRAMS data and a thematic analysis of qualitative data collected from the open-ended question. A total of 8,491 women completed the Utah PRAMS survey from 2016 to 2021. Of these women, 1,715 responded to the open-ended question at the end of the survey. The inclusion criterion for the thematic analysis was that the women had depressive symptoms based on their responses to two survey questions on the PRAMS survey. After removing comments that were unsubstantial, 307 respondents remained.
Dependent Variable
The dependent variable in this study was having depressive symptoms. A survey participant who had depressive symptoms was a variable generated in the PRAMS dataset based on the participants’ responses to the following questions:
- Since your new baby was born, how often have you felt down, depressed, or hopeless?
- Since your new baby was born, how often have you had little interest or little pleasure in doing things you usually enjoyed?
Responses to these questions were limited to “Never”, “Rarely”, “Sometimes”, “Often”, and “Always”. Women who indicated at least “Sometimes” for both or either of these questions were considered to have some level of depressive symptoms, though specific variation was not measured. Responses were combined into the variable “depressive symptoms”.
Independent Variables
The two questions directly contributing to the outcome variable were used in the analysis because one study described symptoms of PPD to include depressed mood and diminished interest or pleasure in activities.12 This study also found that PPD is likely underreported because of the stigma surrounding mental health and being perceived as a good mother.12 Other risk factors from the literature were considered in determining which independent variables to include in the analysis, such as social and cultural factors,12,13,14 including age, marital status, race, Hispanic background, and income percentage of the Federal poverty line. The latter of these variables was considered a proxy variable for income. Similarly, insurance status was included as a socioeconomic variable due to its relationship to income and education.
Much of the literature indicated that screening services need improvement and more consistency across clinics.12,15,16,17,18 Because untreated depression can lead to the mother taking her life or harming the child,12 and if a woman is not receiving adequate screening in the perinatal period, she may be more susceptible to escalating depressive symptoms. Thus, screening was a focal point of the analysis and was distinguished between screening during the prenatal visit and screening at the postpartum visit.
Quantitative and Qualitative Analyses
Logistic regression was used to analyze the categorical variables coded into ordinal data. Three models were built using different combinations of independent variables. While no models incorporated every response variable from the PRAMS Phase 8 survey, Model 1 utilized the most independent variables as listed in Table 2, excluding whether the patient sought help for their perinatal depression. Model 2 included the three options for the insurance status variable. The aim was to isolate the group of individuals who had private/group insurance versus Medicaid. In this same model, the patient’s response about asking the physician for help was incorporated as an essential component of mental health stigma. Model 3 removed the additional variables in Model 2, including the percentage of the federal poverty line and Hispanic background status. The intention of this model was to isolate the race variable to determine whether it was more related to the outcome while excluding ethnicity as a potential confounder. Stata version 15.1 was used to analyze the quantitative data.
For the qualitative data, each individual response was read and evaluated. Based on the general theme of the response, a code was assigned. Some of these codes were combined into larger thematic categories after the initial assignment. Other codes had many responses without recategorizing them into broader groups. Dedoose software was used to identify themes in the open-ended responses and summarize all the data.
Results
Quantitative
Table 1 shows all the characteristics of the survey participants for select categories from 2016-2021. Most women who completed the survey were white and of a non-Hispanic background (85.96% and 81.13% respectively). Many of them had at least a high school diploma (27.3%) and several had a college degree (42.9%). Likewise, the sample included more women with higher incomes, at least 185% of the Federal Poverty Line or higher (58.16%). A high number of women had private/group insurance (70.09%) compared to those who had Medicaid or no insurance (26.57%) and a lower percentage of women were eligible for WIC during their pregnancy (23.05%). These were characteristics considered as independent variables that could influence the outcome variable of PPD symptoms.
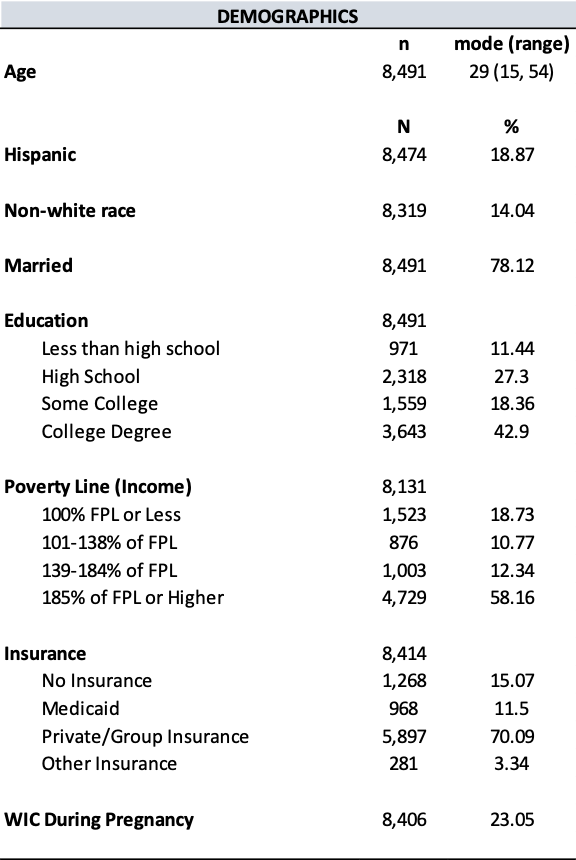

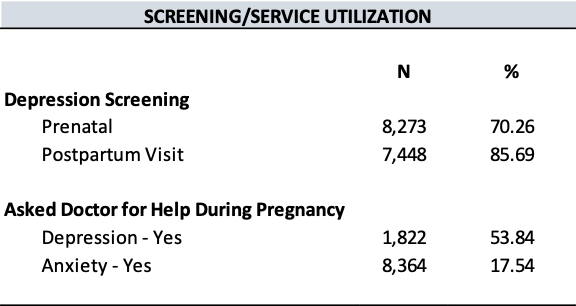
The most frequent age of survey participants was 29 years old, ranging from as low as 15 years and as high as 54 years. The average weight before pregnancy was 157 pounds and average weight at delivery was 186 pounds. A small proportion of women had depression three months before pregnancy (21.34%), while only 16.35% of women had depressive symptoms based on their responses to two dependent variable questions.
Other important characteristics to note are related to screening services. When it comes to depression screening, 70.26% of women received screening during their prenatal visit and 85.69% received screening at their postpartum visit. While many women responded to the question about whether they asked their doctor for help with anxiety at some point during their pregnancy, only 1,822 (21.46%) of participants answered the question about seeking help for depression during pregnancy, perhaps because of mental health stigma or the belief that doctors would not take them seriously.
Table 2 shows the results of the logistic regression. Both variables that directly determined the outcome variable were statistically significant in every model. Notably, women with a household income equivalent to a higher percentage of the Federal Poverty Line had a decreased odds of experiencing depressive symptoms since delivering their baby (OR = 0.8641, p = 0.06). In other words, women with a higher income were less likely to have depressive symptoms. This was statistically significant only in Model 1, which excluded whether the patient asked for help for their depression during pregnancy and the breakdown of insurance status categories. In contrast, Model 2 showed that women with a higher percentage of the Federal Poverty Line had an increased odds of PPD symptoms (OR = 1.1862) but was not statistically significant. Another variable statistically significant was women who had private or group insurance in Model 2. Women with this type of insurance had a decreased odds of having PPD symptoms after delivery (OR = 0.3651, p = 0.03) compared to women with other types of insurance (OR = 0.6259 for Medicaid and 0.3784 for other insurance).
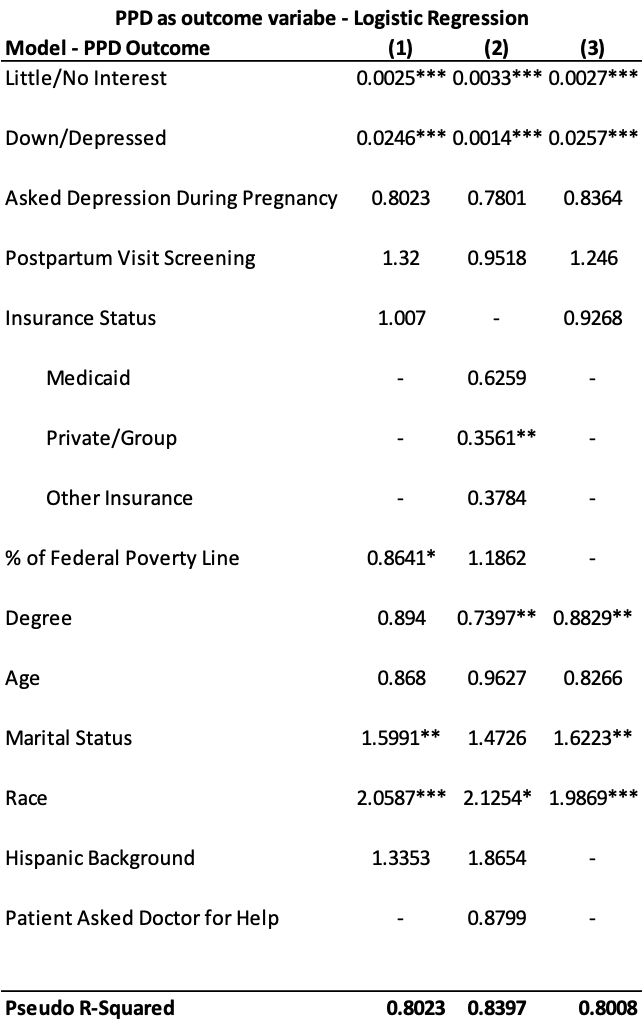
* p < 0.10
** p < 0.05
*** p < 0.002
Variables that were statistically significant for more than one model included degree level, marital status, and race. Women with a higher educational level had a decreased odds of experiencing depressive symptoms (OR = 0.7397 and OR = 0.8829, p = 0.03). In contrast, women who were not married had an increased odds of PPD symptoms (OR = 1.5991 and 1.6223, p = 0.02). Interestingly, race was the only variable statistically significant in every model, suggesting that race has a relationship with depressive symptoms. In all scenarios, being a non-white race resulted in an increased odds of experiencing depressive symptoms in the postpartum period (OR = 2.0587 and 1.9869, p = 0.002 and p = 0.001; OR = 2.1254, p = 0.09). This remained statistically significant even after removing Hispanic background status from the model.
Qualitative
Based on the analysis of 307 open-ended responses from women who had depressive symptoms, 20 thematic categories were identified. Figure 1 shows the top five categories. The “Other” category was a broad theme that consisted of responses relating to the participant’s unique circumstances or general advice for other expecting mothers.
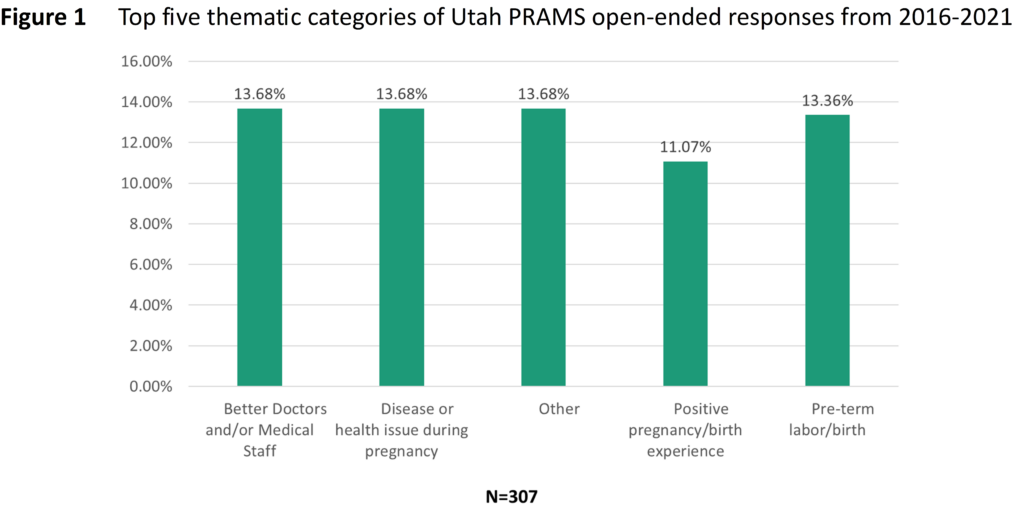
Table 3 summarizes the frequency of comments that fit into the 20 categories. Although there were 307 responses that met the criteria of this study, they could have fallen into more than one category, meaning each category totals a number greater than 307. In addition to the categories shown in Figure 1, other relevant categories worth noting include having a NICU baby (10.42%), unmet needs related to postpartum depression (10.10%), and lack of knowledge or resources (9.12%).
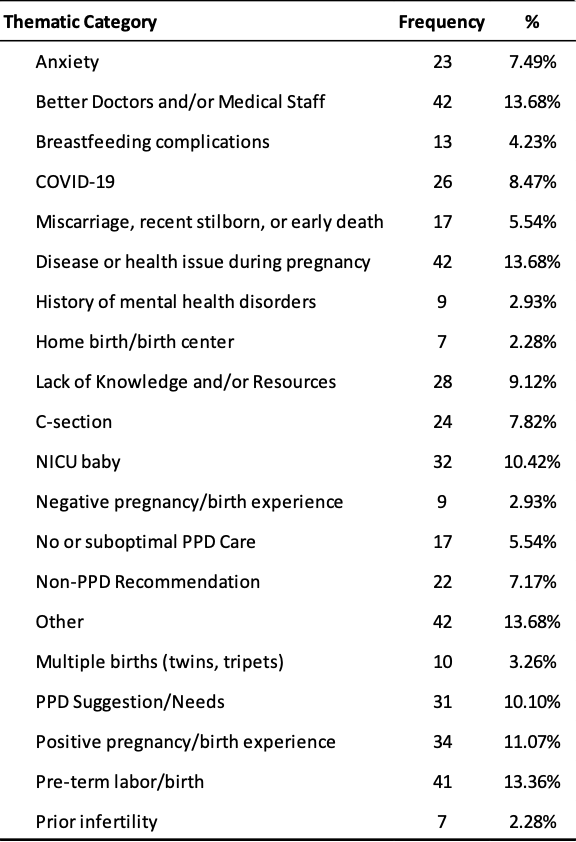
Better doctors or medical staff
Many women with depressive symptoms expressed that they were disappointed with the type of care they received from their doctor during pregnancy or at the hospital from nurses and other healthcare professionals. One woman explained that she felt pressured by her OB/GYN to deliver by cesarean. This made her feel uncomfortable and she ended up delivering vaginally with no complications. However, she was distressed that her physician was not sensitive or compassionate to her needs.
Other women described symptoms of depression and anxiety after delivery and not being prepared for that. There is insufficient follow-up and support during the perinatal period and women are left feeling alone and helpless after their baby arrives.
“It is a little upsetting to me that there isn’t enough follow-up care or discussion with the mother’s regarding PPD here in Utah. I have NEVER filled out a survey or been asked about my thoughts & well-being after having a baby…. Also, a little discussion and concern for the mother…. Moms are exhausted and doing so much for their babies and family. It would be nice if someone was concerned & looking out for mom every once in a while. A lot of women, like myself, don’t even know they have PPD. Please help us Moms!“
Having feelings of guilt and shame are likely enhanced by mental health stigma. Women may not feel like they are adequate mothers when they experience symptoms of depression or anxiety. Consequently, healthcare professionals should consider reassuring their patients that these feelings are normal, though difficult to cope with. These women can feel better with proper treatment and follow-up. Yet many women with depressive symptoms in this study did not experience follow-up and highlights a critical unmet need.
Disease or health issue during pregnancy
While not as prevalent as the need for better, compassionate healthcare professionals, many women mentioned how they suffered a disease or health condition during pregnancy, including hyperemesis gravidarum, preeclampsia, an incompetent cervix, or COVID-19. Hyperemesis gravidarum and preeclampsia were the most prevalent. Part of the problem with developing any disease during pregnancy is when women do not believe they receive sufficient resources. One participant suggested that Utah should have more resources specifically for expectant mothers with hyperemesis gravidarum.
Coping with the additional stress of these diseases could lead to other complications during pregnancy or birth. Increased stress could lead to pre-term labor or delivery, which also has an increased chance of having a baby with a medical issue that requires a stay in the NICU. Women with these diseases during pregnancy mentioned feelings of distress and worry. Thus, it is important for public health professionals in Utah to evaluate the need for developing more resources for diseases such as hyperemesis gravidarum or preeclampsia, especially if it can help women navigate their struggle with a trained physician who cares and understands.
Positive pregnancy or birth experience
Interestingly, many of the comments related to the survey respondents having a positive birth experience or pregnancy. This category also notably had more native Spanish-speaking women, so it would be interesting to see if women with a Hispanic background experience perinatal care or mental health struggles differently. In general, women with positive pregnancy or birth experiences may have chosen to not focus on underlying risk factors. It is also possible that they had a stronger support system.
“I have enjoyed it since labor and all is due to relax on my side of motherhood and not being stressed and having the support on both sides, partner and husband and family that is very important to me that keeps postpartum [depression] away for the mother.“
Conversely, the lack of a support system could be a contributor to depressive symptoms. The quantitative analysis of this study found that women who were married had a decreased odds of experiencing PPD. Although marital status is not the only indicator of a support system, having a partner, friends, or other family who can help take care of the new baby and ensure the mother receives time to relax is beneficial.
Unmet needs related to postpartum depression
Overall, women continue to have unmet needs when it comes to their perinatal care. Some women expressed that postpartum care and education is necessary and that more than one checkup after birth is essential. As one woman put it, “[O]ur mental health matters too.” Similarly, other women felt like doctors did not talk enough about PPD during their prenatal visits, and they did not know why. This could be because doctors have limited time with patients, so it may be worth providing additional training to nurses and other frontline staff who spend more time with patients. If they know what symptoms to look for, they may be able to identify them in the patient before a doctor does. They also tend to be the employees who administer the screening tool.
As it relates to screening, some women never received any and others felt that the survey process was insufficient. “[Postpartum depression screening] felt like a simple record keeping thing and not something they were willing to help with. I hope that PPD/A is taken more seriously in the future by all providers.” This comment suggests that even if screening increases, healthcare professionals need additional training to know what to do with the information and to also connect patients with the treatment they need.
Finally, women feel like their mental health challenges go unnoticed or are not taken seriously. One respondent explained, “I felt dumb and that my feelings and thoughts would get better by the way I was brushed off…I think more women suffer with this and are afraid to say something & when you build up the nerve to finally say something and not feel heard it was hard.” They likely deal with mental health stigma, which is unique to mothers who are held to traditional values and standards. Women who feel shame, guilt, or embarrassment about their feelings may not feel comfortable enough to share their feelings. As this respondent noted, when their voices are not heard, then they will not share them with healthcare professionals in the future, which can impact their depressive symptoms.
Discussion and Health Implications
This study supported the need for improved healthcare and resources for women in the perinatal period, which aligns with the findings of the Utah statewide maternal and child health needs assessment.10 Race, marital status, and socioeconomic status were found to increase the odds for postpartum depressive symptoms. While non-white women had an increased odds of having depressive symptoms in this study, Utah PRAMS data generally shows a gap in the prevalence of PPD between white and non-white populations, with white populations experiencing a higher prevalence.19
Moreover, studies have shown that marital satisfaction and peer and family support are risk factors for PPD.13,20 Other studies have found that socioeconomic status has a relationship with PPD.12,13,20 In these studies, lower socioeconomic status (lower income and lower education) was identified as a risk factor for PPD, which supports the findings of increased odds ratios in this study.
Stressful life events, limited resources, and deficient prenatal health knowledge may also be related to a woman developing PPD symptoms. Two studies have found that all these factors can have an increased risk for PPD.14,20 In this study, participants in the Utah PRAMS survey described difficult life experiences, including the presence of disease during pregnancy, and little knowledge of what to expect during the perinatal period.
While Utah currently has a Maternal Mental Health Toolkit and a website to help women find a mental healthcare professional, challenges continue to exist related to physician and nurse training, screening services, and connecting patients to healthcare professionals who can treat mental health struggles. Though not specific to Utah, some studies have shown that nurses feel underprepared to meet the needs of perinatally depressed patients.16,21 At least one study found that inadequate training can lead to poor screening practices.16 Thus, providing better education and training to nurses and other healthcare professionals could help improve PPD screening.
Although Utah’s screening rates at the postpartum visit have improved from 2016 to 2021,19 there remains inconsistency in screening practices. This may be related to the amount of screening tools available. Even though Utah has improved depression screening at the postpartum visit, screening needs to occur more frequently. UDHHS encourages expanding ACOG’s recommendation1 so that screening takes place at the first visit, each trimester, one to two days postpartum, two weeks postpartum, six weeks postpartum, and at each well-baby check for one year postpartum.22
Additionally, healthcare professionals should consider implementing integrated behavioral healthcare (IBH). IBH is a model used to create more collaborative efforts to address mental health issues when patients visit with their primary care provider. By bringing together professionals from various fields of expertise through an IBH manager, patients can receive more targeted approaches to their healthcare that yields more quality care. IBH programs are an efficacious means for bridging gaps between women in the perinatal period and their healthcare providers.23 IBH can also address fragmentation in perinatal mental health services.24
Strengths and Limitations
The strengths of this study included the high volume of responses included as well as the review of both quantitative and qualitative data that provided mutual support of the outcomes. Given the large sample of Hispanic and low SES survey participants in this study, results may be generalizable to these populations. However, this study was limited to Utah participants in the PRAMS survey, thus the findings may not be generalizable to all populations, including those in other states or countries. Another limitation to this study is the difficulty in measuring health equity. Most women who completed the survey had at least a college degree and identified as white. The PRAMS survey does not ask about sexual orientation, which would also be an important consideration for future phases of the PRAMS project.
While this study assessed the importance of screening, there were no questions on the PRAMS Phase 8 survey that looked at treatment of perinatal depression. Thus, the ability to assess discrepancies between women screened and treated versus women who were screened and not treated is limited. Since the Phase 9 survey began, a new question was added to solicit responses in this area now. Another confounder not considered in this study that should be evaluated in the future is the possibility of risk factors increasing the odds of screening taking place, such as low SES, disease during pregnancy, or depression prior to pregnancy. Other studies should also look at whether the failure to screen and treat women is a result of a poor screening process or the lack of available resources to effectively do so.
Conclusion
More information should be collected during the perinatal period to determine the severity of depression during pregnancy in addition to the postpartum period. Although screening during the postpartum visit has increased from 2016 to 2021 in Utah, there is still room to increase consistency and frequency of screening services across clinics. Additionally, nurses have a unique opportunity to help patients in the perinatal period if they can receive adequate training because they are on the frontlines administering the screening tool. They can also be part of an IBH collaborative care model to bring physicians from different fields of expertise together to deliver optimal care to perinatally depressed women. Further research should be done to assess the usefulness of these recommendations and to evaluate the disparities in access to mental health services.
References
1. The American College of Obstetricians and Gynecologists. (2018). ACOG Committee opinion no. 757: Screening for perinatal depression. Obstetrics and Gynecology, 132(5), 208-212. https://doi.org/10.1097/aog.0000000000002927
2. Branquinho, M., Rodriguez-Munoz, M., Rodrigues Maia, B., Marques, M., Matos, M., Osma, J., Moreno-Peral, P., Conejo-Ceron, S., Fonseca, A., & Vousoura, E. (2021). Effectiveness of psychological interventions in the treatment of perinatal depression: A systematic review of systematic reviews and meta-analyses. Journal of Affective Disorders, 291, 294-306. https://doi.org/10.1016/j.jad.2021.05.010
3. Dagher, R. K., Bruckheim, H. E., Cople, L. J., Edwards, E., & White, D. B. (2021). Perinatal depression: Challenges and opportunities. Journal of Women’s Health, 30(2), 154-159. https://doi.org/10.1089/jwh.2020.8862
4. Huang, R., Yan, C., Tian, Y., Lei, B., Yang, D., Liu, D., & Lei, J. (2020). Effectiveness of peer support intervention on perinatal depression: A systematic review and meta-analysis. Journal of Affective Disorders, 276, 788-796. https://doi.org/10.1016/j.jad.2020.06.048
5. National Institute of Mental Health. (n.d.). Perinatal depression. National Institute of Mental Health. https://www.nimh.nih.gov/health/publications/perinatal-depression
6. Tripathy, P. (2020). A public health approach to perinatal mental health: Improving health and wellbeing of mothers and babies. Journal of Gynecology Obstetrics and Human Reproduction, 49(101747). http://dx.doi.org/10.1016/j.jogoh.2020.101747
7. Van Niel, M. S., & Payne, J. L. (2020). Perinatal depression: A review. Cleveland Clinic Journal of Medicine, 87(5), 273-277. https://doi.org/10.3949/ccjm.87a.19054
8. Centers for Disease Control and Prevention (CDC). (2022). Depression during and after pregnancy. Centers for Disease Control and Prevention. https://www.cdc.gov/reproductivehealth/features/maternal-depression/index.html
9. Valcarce K, Myrer R, & Garces J. (2022). Comparison of anxiety and depression among women who gave birth in Utah 2016-2020 using the Pregnancy Risk Assessment Monitory System (PRAMS). Utah Women’s Health Review. https://doi.org/10.26054/0d-46dz-sr1a
10. Talboys, S., Shoaf, K., Godin, S., & Hipol, F. (2020). Utah maternal and child health and children with special healthcare needs, statewide needs assessment 2020. University of Utah Division of Public Health. https://health.utah.gov/mch/documents/Utah%20Title%20V%20Needs%20Assessment%20Report/2020%20Utah%20MCH_CSHCN%20Needs%20Assessment%20(updated).pdf
11. Centers for Disease Control and Prevention (CDC). (2017). Pregnancy Risk Assessment Monitoring System (PRAMS): Phase 8 standard questions. Centers for Disease Control and Prevention. https://www.cdc.gov/prams/pdf/questionnaire/Phase-8-Standard-Core-Questions-508.pdf
12. Alba, B. M. (2021). Postpartum depression: A nurse’s guide. American Journal of Nursing, 121(7), 32-43. https://doi.org/10.1097/01.naj.0000756516.95992.8e
13. Raymond, N. C., Pratt, R. J., Godecker, A., Harrison, P. A., Kim, H., Kuendig, J., & O’Brien, J. M. (2014). Addressing perinatal depression in a group of underserved urban women: A focus group study. BMC Pregnancy and Childbirth, 14(336). https://doi.org/10.1186/1471-2393-14-336
14. Tebeka, S., Strat, Y. L., Higgons, S. D. P., Benachi, A., Dommergues, M., Kayem, G., Lepercq, J., Luton, D., Mandelbrot, L., Ville, Y., Ramoz, N., du Montcel, S. T., IGEDEPP Groups, Mullaert, J., & Dubertret, C. (2021). Prevalence and incidence of postpartum depression and environmental factors: The IGEDEPP cohort. Journal of Psychiatric Research, 138, 366-374. https://doi.org/10.1016/j.jpsychires.2021.04.004
15. Lomonaco-Haycraft, K. C., Hyer, J., Tibbits, B., Grote, J., Stainback-Tracy, K., Ulrickson, C., Lieberman, A., van Bekkum, L., & Hoffman, M. C. (2018). Integrated perinatal mental health care: A national model of perinatal primary care in vulnerable populations. Primary Health Care Research & Development, 20. https://doi.org/10.1017/S1463423618000348
16. Kang, P. S., Mohazmi, M., Ng, Y. M., & Liew, S. M. (2019). Nurses’ knowledge, beliefs and practices regarding the screening and treatment of postpartum depression in maternal and child health clinics: A cross-sectional survey. Malaysian Family Physician, 14(1), 18-25. http://www.ncbi.nlm.nih.gov/pmc/articles/pmc6612276/
17. Ransing, R., Kukreti, P., Deshpande, S., Godake, S., Neelam, N., Raghuveer, P., Mahadevaiah, M., Kataria, D., Patil, S., Puri, M., & Padma, K. (2020). Perinatal depression–knowledge gap among service providers and service utilizers in India. Asian Journal of Psychiatry, 47. https://doi.org/10.1016/j.ajp.2019.10.002
18. Segre, L. S., Brock, R. L., O’Hara, M. W., Gorman, L. L., & Engeldinger, J. (2011). Disseminating perinatal depression screening as a public health initiative: A Train-the-Trainer approach. Maternal and Child Health Journal, 15(6), 814-821. https://doi.org/10.1007/s10995-010-0644-1
19. Utah Department of Health and Human Services (UDHHS). (2022). Public Health Indicator Based Information System (IBIS): Utah’s public health data resource. Utah Department of Health and Human Services. https://ibis.health.utah.gov/ibisph-view/
20. Chen, J., Cross, W. M., Plummer, V., Lam, L., Sun, M., Qin, C., & Tang, S. (2019). The risk factors of antenatal depression: A cross‐sectional survey. Journal of Clinical Nursing, 28, 3599-3609. https://doi.org/10.1111/jocn.14955
21. Wang, T. H., Tzeng, Y. L., Teng, Y. K., Pai, L. W., & Yeh, T. P. (2022). Evaluation of psychological training for nurses and midwives to optimise care for women with perinatal depression: a systematic review and meta-analysis. Midwifery, 104(103160). https://doi.org/10.1016/j.midw.2021.103160
22. Utah Women and Newborns Quality Collaborative (UWNQC), Maternal Mental Health Committee. (2022). Utah’s maternal mental heath toolkit: Resources for anyone working with perinatal parents and their children. UWNQC. https://mihp.utah.gov/mmhtoolkit
23. Miller, E. S., Jensen, R., Hoffman, M. C., Osborne, L. M., McEvoy, K., Grote, N., & Moses-Kolko, E. L. (2020). Implementation of perinatal collaborative care: A health services approach to perinatal depression care. Primary Health Care Research & Development, 21(e30), 1-9. https://doi.org/10.1017/S1463423620000110
24. Bayrampour, H., Hapsari, A. P., & Pavlovic, J. Barriers to addressing perinatal mental health issues in midwifery settings. Midwifery, 59, 47-58. https://doi.org/10.1016/j.midw.2017.12.020
Citation
Waechtler L and Talboys S (2024). Perinatal depression trends in Utah and the role of nurses and integrated behavioral health professionals. Utah Women’s Health Review. doi: 10.26054/d-k9mp-4mw1
