Milk Banking

Milk banking has been around for over one hundred years. The first human milk bank opened in 1909 in Vienna, Austria. The first milk bank in the United States opened in 1919 in Boston, Massachusetts. The Human Milk Banking Association of North America (HMBANA) was organized in 1985 to establish guidelines for milk banking in North America and to work with the medical community and non-profit donor milk banks. The mission of HMBANA is to “promote the health of babies and mothers through the provision of safe pasteurized donor milk and support of breastfeeding” (HMBANA: about-us). 27 non-profit milk banks in the United States and Canada are currently in operation. In Utah, the Mountain West Mothers’ Milk Bank (MWMMB, https://www.giveyourmilk.org/) is a developing milk bank.

The MWMMB has partnered with Colorado’s Rocky Mountain Children’s Health Foundation Mothers’ Milk Bank (https://rmchildren.org/mothers-milk-bank/). As part of an effort to be an operating non-profit human milk bank, human milk donor donation sites have been set up in Utah and Idaho. There are currently a number of human milk donation sites in operation throughout Utah and Idaho with several more upcoming developing human milk donation sites. At this time, operations as a fully operational human milk donor bank have not started, as collected milk must be sent to Denver for processing.

Utah has one of the highest breastfeeding rates in the nation, with 89.7 percent of babies being breastfed at some point according to the 2018 Center for Disease Control Breastfeeding Report Card (https://www.cdc.gov/breastfeeding/data/reportcard.htm). However, only 49.7 percent of these infants are exclusively breastfeeding at three months and 27.8 percent are exclusively breastfeeding at six months. Some mothers who had planned to breastfeed or provide exclusive human milk are unable to do so. Supplementation of the mother’s own milk with donor pasteurized human milk (PHM) can be beneficial to all infants. Very low birth weight infants (less than 1500 grams) whose mothers are unable to produce enough milk are a high-risk group who receive several health and cognitive benefits from donor PHM.

Human milk banks following the HMBANA guidelines provide a safe alternative. The 2016 American Academy of Pediatrics (AAP) policy statement on donor PHM for the high risk infant recommends mothers’ own milk for this population. When mothers’ own milk is unavailable or the mother cannot provide enough milk, the AAP recommends use of donor PHM, with priority to be given for infants less than 1500 grams. Many Utah hospitals have policies to provide donor PHM for infants with low birth weights, as well as for infants with other medical conditions such as intestinal diseases. Studies of these high risk infants have shown improved feeding tolerance when fed donor PHM (AAP 2017). More recent studies are showing improved growth outcomes in this population.

The pasteurization process does impact human milk. Lactoferrin, lysozyme, and secretory IgA and immunoglobulin proteins are significantly decreased in PHM. According to Landers and Hartmann (2013), these concentrations are reduced by 50-80 percent. Some of the anti-inflammatory factors, cells, and other immunoactive factors are also destroyed during the Holder pasteurization according to the AAP (2017) and Landers and Hartmann (2013). Other nutrients, along with macro and micronutrients, are not significantly decreased as a result of the pasteurization process. Despite reductions in these constituents, the AAP reports positive clinical outcomes including improved feeding tolerance. These positive outcomes support use of donor PHM.

Landers and Hartmann (2013) report the consensus among neonatologists regarding use and efficacy of donor PHM is the greatest barrier to its use in the NBICU. Another barrier to use of donor PHM in the NBICU is the cost of purchasing the milk. Availability of donor PHM has also been a concern and a barrier to its use. Another barrier is the perceived risks and safety of the milk. According to Landers and Hartmann (2013), risks from infectious disease are believed to be very low, negligible in fact as no reported cases have been reported of infection or viral transmission from donor PHM feedings. Additional concerns regarding donor PHM include risks associated with infectious and noninfectious bacteria and other viruses that may be found in human milk. Human milk banks following HMBANA guidelines screen incoming milk and also run bacteriologic cultures on a routine basis. The Holder pasteurization process has been shown to remove and destroy a wide variety of bacteria and viruses including cytomegalovirus (CMV).

The mother’s own milk is the best and first option for all infants, as it provides both short- and long-term benefits into childhood and adult life. This protective benefit of mother’s milk is dose-related; however, many health improvements have been documented with any breastfeeding. The AAP Policy Statement on Breastfeeding and Use of Human Milk (2012) discusses these benefits and improved health outcomes. Picaud and Buffin (2017) attribute these benefits to the unique bioactive substances in mother’s milk is and report mother’s milk as essential to the newborn, who naturally is born with an immature digestive and immune system.

Multiple studies and review articles which discuss the risks of infant formula and the benefits of human milk (both mother’s own and donor PHM) have been published. Risk reduction in many diseases and improved health outcomes is well documented, such as documentation of a significant reduction in necrotizing enterocolitis (NEC), retinopathy of prematurity, and late-onset sepsis. Studies have shown that PHM retains protective abilities to inhibit bacterial growth despite reductions in immunological properties from pasteurization, making donor PHM absolutely essential for this high-risk group (Picaud & Buffin 2017).

Nationally and in the state of Utah, significant differences exist between hospitals regarding use of donor PHM and policies supporting its use in high-risk infants. The use of donor PHM as a bridge for all infants also varies between hospital systems in Utah, as some hospitals use it as their standard of care while others do not even have donor PHM in their facilities.

Providing and using donor PHM intersects between the physical health domain and the emotional health domain. In Lois Arnold’s 2006 article about global health policies, she quotes the United Nations Universal Declaration of Human Rights, article 25 “Everyone has the right to a standard of living adequate for the health and well-being of himself and of his family including food, clothing, housing and medical care…” (Arnold 2006, https://www.ohchr.org/EN/Issues/Health/Pages/Interna-tionalStandards.aspx). She also states that the same protections should be provided to all children regardless of health status and risk, whether they are term births, premature, or sick with congenital anomalies or other illnesses. According to Arnold, all children should have the same opportunities for the best possible health outcomes. For the infant whose mother cannot produce enough milk to meet her infant’s needs, or the mother who is unable to provide milk for her newborn, banked donor PHM provides a safe and essential option to promote optimal health for these infants.

To ensure that the rights of women, children and infants are protected; Arnold (2006) stresses the importance of protecting and supporting breastfeeding mothers in the hospital setting and after discharge. The University of Utah is the only hospital in the state with the Baby-Friendly Hospital designation (CDC 2016). The Baby-Friendly Hospital Initiative (BFHI) is a global program recognizing hospitals for successful implementation of the WHO/UNICEF Ten Steps to Successful Breastfeeding. The Utah Department of Health Maternal and Infant Health Program is currently promoting Stepping UP for Utah Babies a collaborative working with Utah hospitals to support breastfeeding in their facilities. This program has a toolkit for hospitals to implement the Ten Steps to Successful Breastfeeding (https://www.unicef.org/newsline/tenstps.htm).

Research has shown that hospitals implementing the Ten Steps to Successful Breastfeeding positively impact initiation and duration of breastfeeding. Leadership organizations and health care professionals in Utah communities and at state and national levels are needed to increase donations of mother’s milk, and to increase the number of donors who provide donor milk to those in need. The Mountain West Mothers’ Milk Bank has started to serve as a community donor milk bank, thereby providing leadership opportunities to increase donations of mothers’ milk. Communities benefit from donor milk banks, as their presence increases awareness of the importance of donor milk to high-risk infants and to infants whose mother is unable to provide this valuable resource.

References

  • American Academy of Pediatrics (2017).Committee on Nutrition, Section on Breastfeeding Policy Statement. Donor Human Milk for the High Risk Infant: Preparation, Safety, and Usage Options in the United States. Pediatrics, 139(1), doi:10.1542/peds.2016-3440.
  • American Academy of Pediatrics (2012). Committee on Nutrition, Section on Breastfeeding Policy Statement. Breastfeeding and the Use of Human Milk. Pediatrics, 129(3), e827-841, doi:10.1542/peds.2011-3552.
  • Arnold, L.DW. (2006). Global health policies that support the use of banked donor human milk: a human rights issue. International Breastfeeding Journal, 1,26. doi:10.1186/1746-4358-1-26.
  • Centers for Disease Control (2018) Breastfeeding Report Card. Retrieved from https://www.cdc.gov/breastfeed- ing/data/reportcard.htm Accessed April 29, 2019.
  • Human Milk Banking Association of North America. Retrieved from https://www.hmbana.org/about-us/ Accessed April 29, 2019.
  • Landers, S., and Hartmann, B. T. (2013). Donor human milk banking and the emergence of milk sharing. Pediatr Clin North Am, 60, 247-260. Doi:10.1016/j.pcl.2012.09.009
  • Picaus, J. C., and Buffin, R. (2017). Human Milk Treatment and Quality of Banked Human Milk. Clin Perinatol, 44, 95-119. Doi:10.1016/j.clp.2016.11.003.
  • Utah Department of Health. Maternal and Infant Health Program (MIHP) Stepping Up for Utah Babies. Retrieved from https://mihp.utah.gov/stepping-up-for-utah-babies Accessed June 30, 2017.


Citation

Lechtenberg E. (2019). Milk Banking. Utah Women’s Health Review. doi: 10.26054/0KANH91T5Z.

PDF

View/download


Data Snapshot: Adolescent Pregnancy

Background

Adolescent pregnancy and births are at historic lows in both Utah and the U.S. While the efforts of local and national programs that have worked to achieve this rate decrease should be celebrated, efforts to reduce unwanted pregnancies among teens and support young women cannot become complacent. Adolescent pregnancy continues to be associated with long-term difficulties for the mother, her child, and communities at large.

Adolescent pregnancy overlaps with every domain of health and results in negative risks for both mothers and their babies. “For the mothers, giving birth during adolescence is associated with limited educational attainment, which in turn can reduce future employment prospects and earning potential” (UDOH, 2016). Just 40% of adolescent mothers who have a child before the age of 18 receive their high school diploma (TNC, 2019). Adolescent mothers are also at higher risk for postpartum depression and other mental health conditions (PRAMS, 2016).

When considering the health of infants, babies born to adolescent mothers “are at higher risk of low birth weight and infant mortality” compared to babies born to older mothers (UDOH, 2019). “These babies are also more likely to grow up in homes that offer lower levels of emotional support and cognitive stimulation”, and consequently the babies themselves “are less likely to earn a high school diploma” (UDOH, 2019). Children born to adolescent mothers are also at a higher risk of becoming an adolescent parent themselves (TNC, 2019).

Nearly all adolescent pregnancies are unplanned (TNC, 2019). Because of this, many view adolescent child-bearing as only a reproductive health issue. However, since adolescent pregnancy is closely linked to a host of other critical social issues – poverty, overall child well-being, responsible fatherhood, health issues, education, and a variety of risky behaviors – communities cannot ignore the substantial public costs associated with unwanted or mistimed teen pregnancy and parenthood (TNC, 2019). Supporting adolescents’ reproductive goals of delaying first birth should be viewed not only as a reproductive health issue, but also as one that works to improve multiple domains of health for both mothers and their babies.

Data

The Utah adolescent birth rate (per 1,000 females age 15-19) continues to be lower than the U.S. (See Figure 1). Currently, Utah ranks 13th in the nation for overall teen birth rate and fourth for teen pregnancy rate (TNC, 2017). However, Utah ranks 24th for the decline in adolescent birth rate, suggesting that improved efforts are needed to address disparities.

Figure 1. Utah and U.S. Adolescent Birth Rates per 1,000 Females, Age 15-19, 2010-2015

In Utah, there are substantial racial and ethnic disparities in the adolescent birth rate. American Indian and Black populations are almost twice as likely to have an adolescent birth compared to the White population, and Hispanic populations are nearly three times as likely to have an adolescent birth compared to non-Hispanic populations (See
Figures 2 and 3).

Figure 2. Utah Adolescent Birth Rates, Age 15-19 by Race, 2015
Figure 3. Utah Adolescent Birth Rates, Age 15-19 by Ethnicity, 2015

Geographic disparities also persist in Utah, particularly in rural areas of the state. In four local health districts (San Juan, Southeast, TriCounty, and Weber-Morgan), the adolescent birth rate is higher than both the state and national average (See Table 1). Though the adolescent birth rate continues to decline, efforts to focus on these disparities in Utah will help improve our rank when compared to the nation, as well as the overall health of all our communities.

Table 1. Utah Adolescent Birth Rates, Age 15-19 by Local Health District, 2015

Available Resources

For many years, the Utah Department of Health (UDOH) has received federal funding to address the issue of teen pregnancy through the Title V Abstinence Education grant. This funding is sub-granted to local health departments to implement nationally developed evidence-based programs for youth ages 10-16. Traditionally, these adolescent pregnancy prevention programs have focused primarily on providing sexuality education to youth in public schools. However, four noteworthy programs discussed below, including an additional federal funding opportunity—the Personal Responsibility Education Program (PREP)—illustrate a wider range of possibilities for adolescent pregnancy prevention interventions.

In October of 2016, the TriCounty Health Department received Title V Abstinence Education funding to implement the Wyman Teen Outreach Program® (TOP®), an after-school youth development program designed and evaluated by the Wyman Center in St. Louis. The program is widely used across the U.S., reaching 25,000 teens annually. Evaluation conducted by Wyman shows that 98% of youth participating in the program nationally avoid teen parenthood (Wyman, 2017). TOP® not only equips teens with the skills to avoid risky behaviors, like early sexual initiation, but also empowers them to become powerful and visionary leaders in their community. For example, TriCounty’s program participants for the 2016-2017 school year have completed nearly 50 hours of community service. Youth across the Uintah Basin now have increased skills and opportunities to engage in meaningful community service, take on leadership roles, and participate in civic engagement.

Beginning in 2010, UDOH began receiving additional teen pregnancy prevention funding for the Personal Responsibility Education Program (PREP). Like the Title V Abstinence Education Program, the funding is sub-contracted to local health departments to implement nationally developed, evidence-based programs. However, the program is intended for an older population of youth (aged 14-19) and provides a wider focus than traditional educational interventions. Four local health departments (Bear River, Tooele, Salt Lake, and Weber-Morgan), and the Urban Indian Center of Salt Lake, are currently receiving funding to implement community-based programming that provides education on a variety of adult preparation subjects, such as parent-child communication, healthy relationships, education and career success, and financial literacy, in addition to traditional sexuality-related material. The goal of the program is not only to prevent adolescent pregnancy, but also to provide all youth with the skills they need to become productive and successful adults and citizens in their community.

A third noteworthy intervention being implemented through Title V Abstinence Education and PREP funding in several Utah communities is Families Talking Together. The program was developed by the Center for Latino Adolescent and Family Health at New York University School of Social Work, and is based upon the philosophy that parents are the primary sexuality educators of their children. Evaluations of the program have shown that the intervention delays sexual initiation and promotes abstinence (HHS, 2017). Through two intensive one-on-one or small group sessions, parents learn specific skills and strategies to enable them to engage in conversations with their teens and effectively take on the role of a sexuality educator for their family.

Another unique community program focuses specifically on reducing repeat births to adolescents. The Teen Success program, one of the many programs implemented by the Education Department at Planned Parenthood Association of Utah, was established in 2011. Its primary goal is to help mothers aged 13-19 in Salt Lake County maintain their current family size until they complete their high school education and feel ready for another child. This goal is achieved through a unique, mixed method program model of providing a safe and supportive group counseling environment that also implements an educational curriculum focused on personal health and self-esteem, parenting, healthy relationships and college and career preparation. Over the past five years, this program has helped more than 100 young mothers achieve their goals and become empowered parents. The program has a 98% success rate at preventing a repeat birth during the adolescent years; and for the past three years, 100% of the high school seniors participating in the program have graduated with their high school diploma.

Recommendations

Effective interventions include a wide range of activities, including youth development programs, adult preparation education, and programs tailored to specific sub-populations, such as teen mothers. Regardless of the specific program or implementation setting, there are common themes for success. These include creating a safe, supportive environment for program participants; involving parents; and moving beyond a prevention focus to a more holistic adolescent development and engagement approach. Ultimately, when government and communities are willing to invest resources in programs for young people, the return in social capital is tremendous.

References

  • U.S. Department of Health and Human Services. (2017). Teen Pregnancy Prevention Evidence Review: Families Talking Together. Retrieved from https://tppevidencereview.aspe.hhs.gov/document.aspx ?rid=3&sid=53&mid=7. Accessed April 24, 2019.
  • Utah Department of Health Public Health Indicator Based Information System. (2016). Adolescent Births. Retrieved from https://ibis.health.utah.gov/indicator/view/AdoBrth.html. Accessed April 24, 2019.
  • Utah Pregnancy Risk Assessment Monitoring System (PRAMS), Utah Department of Health. (2016). Percentage of Utah Women Who Reported Postpartum Depression Symptoms by Maternal Age. Retrieved from https://ibis.health.utah.gov/indicator/view/PPD.Age.html. Accessed April 24, 2019.
  • Wyman Center. (2017). Results. Retrieved from http://wymancenter.org/results/.

Citation

Stokes SC, Gerke E. (2019). Data Snapshot: Adolescent Pregnancy. Utah Women’s Health Review. doi: 10.26054/0K04F501PR.

PDF

View/download

Potential Anorexia Among Adolescent Girls in Utah

Background

Eating disorders, which include anorexia nervosa, bulimia nervosa, and binge-eating disorder, are psychological disorders where people experience abnormal or disturbed eating habits. People who have anorexia nervosa typically view themselves as overweight, but they are actually dangerously underweight. Anorexia nervosa may lead to several medical complications including abnormally slow heart rate, low blood pressure, scoliosis, osteoporosis and/or severe dehydration, and women may experience amenorrhea, or an absence of period. People of any age, race, gender, and social-economic status can be affected by anorexia. The disorder most frequently begins during adolescence, but children and adults can be diagnosed as well. Hudson, Hiripi, Jr, & Kessler (2008) found the lifetime prevalence estimate of anorexia nervosa to be 0.9% among women and 0.3% among men in the United States. A 2011 meta-analysis found that mortality rates among those with anorexia nervosa are higher than the general population, and higher than mortality in patients with other eating disorders (including bulimia nervosa and eating disorder not otherwise specified; Arcelus, Mitchell, & Wales, 2017).

While there is a growing body of research on treatment for anorexia nervosa, the research on the prevention of anorexia is limited. Some research has suggested that individuals who have anorexia are more likely to experience adverse health risks, compared to their peers without eating disorders. This data snapshot further explores some of those adverse health risks among adolescent girls in Utah.

Methods

To better understand the magnitude of eating disorder behaviors on the adolescent population, Youth Risk Behavior Surveillance System (YRBSS) data from 2011 and 2013 were used. YRBS is a collaboration between the Centers for Disease Control and Prevention and the Utah Department of Health. The YRBSS surveys students in grades 9-12, across Utah every two years. The questionnaire includes sections for chronic disease prevalence, alcohol, tobacco and drug use, safety, violence-related behaviors, physical activity and nutrition, depression, and suicide ideation.

To look at health risks due to potential anorexia among the adolescent population in Utah, we used two constructs – Body Mass Index (BMI) based on age and sex growth charts, in addition to diagnosis of an eating disorder behavior. To determine if an adolescent had potential anorexia, we identified students below the 15th percentile BMI and those who had one or more of the following eating disorder behaviors: (1) trying to lose weight; (2) fasting for 24 hours or more to lose weight during the past 30 days; (3) taking diet pills to lose weight during the past 30 days; and (4) vomiting or using laxatives to lose weight during the past 30 days.

To understand the magnitude and consequences of eating disorder behaviors among underweight adolescents, we looked at rates of various health risks for adolescents with potential anorexia compared to those without potential anorexia. These findings highlight the burden of anorexia and associated health risks on the female adolescent population in Utah.

Findings

In 2011 and 2013, 3.9% of female students and 1.4% of male students met the BMI and eating disorder behavior criteria for potential anorexia. For girls, the most commonly reported eating disorder behavior for those with potential anorexia was trying to lose weight (22.8%), followed by fasting to lose weight (11.8%), vomiting to lose weight
(7.0%), and taking pills to lose weight (4.8%). Overall, these percentages estimated that nearly 3,000 girls and more than 1,000 boys were potentially anorexic in Utah. For females, this number was approximately equal to the number of female student who currently smoke cigarettes during the same time period.

Additionally, we applied these two criteria for potential anorexia to 2013 national YRBSS data. We found that rates of potential anorexia among all adolescents (2.6% and 1.5%) and rates of potential anorexia among girls (3.9% and 2.1%) are statistically higher in Utah compared to the U.S. adolescent population. This further magnifies the severity of these findings and demonstrates the magnitude of the issue within Utah.

Anorexia has been shown to be associated with numerous adverse health risks. The prevalence of potential anorexia among girls was associated with higher rates of the health risks shown on Graph 1 and Graph 2. Compared to those with no potential anorexia, girls with potential anorexia had statistically higher rates of: suicide ideation (36.6% vs. 16.1%); making a suicide plan (31.4% vs. 13.0%); attempting suicide (18.7% vs. 6.3%); electronic bullying (34.3% vs. 21.0%); being in a physical fight (30.3% vs. 14.7%); and intimate partner violence (physically hurt 22.0% vs. 6.3%; forced to do sexual activities 35.5% vs. 13.2%).

Graph 1: Suicide and Bullying Among Adolescents with and without Potential Anorexia, Utah Girls, 2011, 2013
Graph 2: Physical Fights and Intimate Partner Violence Among Girls with and without Potential Anorexia, Utah Girls, 2011, 2013

Discussion: Domains of Health, Girls, Potential Anorexia, and Health Risks

Physical & Reproductive Health

Anorexia nervosa, while a mental health condition, also manifests itself physically. Individuals who have anorexia nervosa can be at risk for numerous consequences, including death due to the development of arrhythmias (abnormal heart rhythms) or electrolyte imbalance. Anorexia has the highest mortality of any mental illness. Physical symptoms of anorexia include extreme weight loss, bluish discoloration of fingers, thinning hair, lanugo (soft, downy hair covering the body for warmth), and dehydration. Physical complications as a result of some of the aforementioned symptoms of anorexia include anemia, bone loss, gastrointestinal problems, and kidney problems.

Additionally, females may experience amenorrhea (absence of a period) and men may experience a decrease in testosterone. Despite menstrual irregularities, women with anorexia nervosa are getting pregnant at similar rates to those found in the general population. The demands of pregnancy on a person with anorexia nervosa may present additional challenges and considerations, but for mothers with adequate gestational weight gain, the occurrence of delivery complications and rate of birth defects was no different from that of the general population (Hoffman, Zerwas, & Bulik, 2011). In addition, potential anorexia in young people was associated with other adverse risk behaviors, including physical and sexual assault.

Occupational and Financial Health

Higher health-care costs and treatment costs present financial burden for individuals with anorexia. One study demonstrated nearly $2,000 higher annual health-care costs among individuals with eating disorders compared to the general population (Samnaliev, Noh, Sonneville, & Austin, 2015).

Emotional Health

Eating disorders are a disorder of the mind and body. They are not a fad, diet, or lifestyle choice. Those with anorexia nervosa maintain a starvation diet despite being significantly underweight. Often, the individuals feel a sense of control when engaging in abnormal eating habits and losing weight. Once they are at an unhealthy body weight, they still see themselves as overweight and refuse to regain healthy weight. Eating disorders, including anorexia nervosa, must be recognized as a mental health issue and must be treated as such. It is common for eating disorders to co-occur with other psychiatric disorders. This makes diagnosis, treatment, and recovery even more difficult. The earlier a person seeks treatment, the greater are the chances of emotional and physical recovery.

Recommendations

Our results demonstrate the lack of attention and resources anorexia has received compared to other health conditions with a similar burden among the same population. Based on the findings of this analysis, recommendations include a deeper dive to better understand the problem, as well as development and implementation of prevention strategies and interventions for adolescents with potential anorexia. Current efforts by healthcare providers to screen for eating disorders, as well as current efforts to prevent interpersonal violence and suicide in youth, should be evaluated. School nurses or school counselors may play an important role in screening for or identifying eating disorders, violence, mental health, and other associated health risks, and providing support for affected youth. Prevention resources and partnerships should be aligned to incorporate these findings. The magnitude of potential anorexia among adolescent girls in Utah, and the association with multiple health risks, demonstrate the need to recognize and address eating disorders as a part of adolescent health. Awareness of these issues is critical, among school staff and providers as well as parents and all youth.

References

  • Arcelus, J., Mitchell, A. J., & Wales, J. (2011). Mortality Rates in Patients With Anorexia Nervosa and Other Eating Disorders, Arch Gen Psychiatry 68(7), 724–731.
  • Hoffman, E. R., Zerwas, S. C., & Bulik, C. M. (2011). Reproductive issues in anorexia nervosa. Expert Review Obstet Gynecol, 6(4), 403–414. https://doi.org/10.1586/eog.11.31.
  • Hudson, J. I., Hiripi, E., Jr, H. G. P., & Kessler, R. C. (2007). NIH Public Access, 61(3), 348–358.
  • Samnaliev, M., Noh, H. L., Sonneville, K. R., & Austin, S. B. (2015). The economic burden of eating disorders and related mental health comorbidities : An exploratory analysis using the U . S . Medical Expenditures Panel Survey. PMEDR, 2, 32–34. https://doi.org/10.1016/j.pmedr.2014.12.002

Citation

Friedrichs M, Waters M, Ferell D. (2019). Potential Anorexia Among Adolescent Girls in Utah. Utah Women’s Health Review. doi: 10.26054/0KZCZSHTDF.

PDF

View/download

A Complex Web: Exposure to Domestic Violence, Aggressive Behaviors and Suicidality in Utah Adolescents

Background

Utah has a notably high rate of sexual and domestic violence: 32% vs 29% nationally [5]. Female and male adults are not the only victims of this behavior. Adolescents exposed to domestic and sexual violence are at increased risk of acting aggressively towards their peers in the form of bullying and harassment [2]. These adolescents and all adolescents exposed to bullying in any capacity experience greater rates of suicidal ideation and behavior [1]. To improve adolescent health, it is imperative that the complex interplay between these three types of violence are further explored and prevention efforts are developed in order to break this cycle and optimize youth health and resiliency.

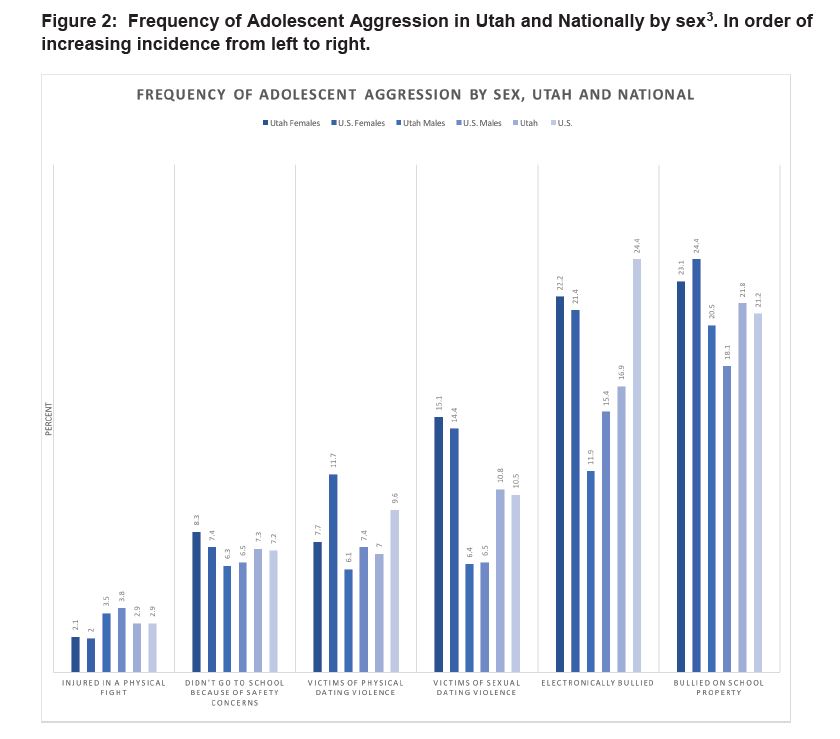
This data snapshot will explore population data and propose some approaches to build youth resilience and improve health outcomes for adolescents. Adolescents who are exposed to domestic violence are at increased risk of perpetrating aggressive behaviors in the form of fighting, dating violence, and bullying [2, 8]. Typically, they are more accepting of aggressive behaviors, experience higher rates of adolescent depression and more feelings of anger, and tend to demonstrate impaired regulation of anger [1]. Students exposed to domestic violence have poorer conflict management skills and poorer emotional regulation than those not exposed [2]. A 2014 meta-analysis found that involvement in bullying in any capacity (whether as a victim or perpetrator) is associated with suicidal ideation and behavior [1]. Notably, a 2006 Utah study found that adult victims of domestic violence are considerably more likely than non-victims to have witnessed domestic violence as a child (34%) or to have been abused by their parents (36 %) [3]. Utah ranks 7th in the nation for suicide among 10 to 17-year-olds (Figure 1) and has some of the higher aggression rates in the country (Figure 2). Those who are exposed to domestic violence are at higher risk for perpetrating adolescent aggression, having suicidal ideations, and committing suicide [1, 2].

The high rates of suicide, adolescent aggression, and adolescent suicide are especially noteworthy because bullying, assault, and suicide ideations are under-reported problems. Data on individuals who attempt suicide are limited. Such problems disproportionately affect minorities and low socioeconomic populations. For example, Hispanic female adolescents experience sexual dating violence at 16.0 percent, compared to 14.6 percent among white adolescent females [3], LGBTQ teens have a suicide rate between 1.5 and 3 times higher than heterosexual teens [12], and low-income areas such as South Salt Lake have remarkably poorer mental health overall. Because of the overlapping nature of these three phenomena, this research snapshot focuses on three key areas:

Because of the overlapping nature of these three phenomena, this research snapshot focuses on three key areas:
1) The impacts of domestic violence on aggression in adolescents.
2) The correlation between bullying and aggression on youth suicide rates.
3) The high rate of suicide in Utah, notably in adolescents.

Data

Self-reported Utah data from the 2013 Youth Risk Behavior Survey indicate that 7% of Utah students have been a victim of physical dating violence, 22% have been bullied on school property, and 11% percent have been victims of sexual dating violence [3]. Among children who have been exposed to domestic violence, nationally, 9% reported perpetrating physical violence, 44% reported bullying others during the current school term, and 16% reported having sexually harassed a peer in the last school year [2]. These high rates are especially salient in small areas within key populations, like South Salt Lake where the poverty rate is 28.5%, and 26% of children were victims of abuse [6].

Figure 1: Rate of suicide per 100,000 ages 10+

Adolescent deaths from suicide are more prevalent among males, although attempts are far more evenly distributed, with females having significantly higher rates of hospitalization than males across age groups [11]. Overall, on mental health, Utah ranks 40th in the nation, having a high prevalence of mental illness and low rates of access to care [10]. In Utah, the rates of adolescent aggression are higher, if only slightly, than the national average. It stands to reason that the three phenomena are linked, especially in light of their strong correlation with socioeconomic status and education.

Figure 2: Frequency of Adolescent Aggression in Utah and Nationally by sex (3). In order of increasing incidence from left to right.
Figure 3: Frequency of Adolescent Depression in Utah and Nationally by sex (3). In order of increasing incidence from left to right.

Available Resources and Conclusion

Suicide, domestic violence, and bullying are complex public health issues where discussion may be stigmatized and the victims may be blamed. As such, these topics are not openly discussed, making it difficult to collect valid data and potentially difficult to establish meaningful prevention measures. One approach to this complex web is to expand evidence-based violence prevention work offered to children and youth who are known to have been exposed to domestic violence. A second approach is to implement bystander prevention strategies that empower peers to intervene in the moment where they see situations brewing.

Programs that provide teachers and other adults who work with youth with skills to intervene in bullying/harassment, to be a safe, nurturing person to talk with, and to create safer spaces for learning is known to improve safety for LBGTQ youth, youth who have had adverse childhood experiences including exposure to domestic violence. The literature suggests that programs that target nearly all forms of adolescent aggression at their core can be created, using a social – emotional approach to teach communication skills, decision making, and the qualities of healthy and unhealthy relationships [2, 7].

Late adolescents living in poverty are almost twice as likely to have suicidal inclinations [9]. Because of the drastically higher rates of violence in areas like South Salt Lake, more research needs to be done in order to determine if this is a statewide problem, or one that is disproportionately affecting low-in-come families in areas like South Salt Lake. Further research can aid efforts to ameliorate the effects of exposure to domestic violence. Because exposure to domestic violence is linked to suicide, bullying, and other adverse behaviors, we need to continue to support youth who have been exposed and work to target aggressive behaviors across Utah.

References

  1. Holt, M. K., Vivolo-Kantor, A. M., Polanin, J. R., Holland, K. M., DeGue, S., Matjasko, J. L., Wolfe, M.. Reid, G. (2015). Bullying and Suicidal Ideation and Behaviors: A Meta-Analysis. Pediatrics,135(2), e496-509. Retrieved May 2, 2019, from http://pediatrics.aappublications.org/content/early/2015/01/01/peds.2014-1864
  2. Foshee, V. A., McNaughton Reyes, H. L., Chen, M. S., Ennett, S. T., Basile, K. C., DeGue, S., Vivolo-Kantor, A.M., Moracco, K.E., Bowling, J. M. (2016). Shared Risk Factors for the Perpetration of Physical Dating Violence, Bullying, and Sexual Harassment Among Adolescents Exposed to Domestic Violence. Journal of Youth and Adoles-cence,45(4), 672-686. doi:10.1007/s10964-015-0404-z
  3. Kann, L., et al. (2014, June 13). Youth Risk Behavior Surveillance — United States, 2013. Atlanta, GA: Centers for Disease Control and Prevention. Retrieved May 2, 2019 from https://www.cdc.gov/mmwr/pdf/ss/ss6304.pdf
  4. Madsen, S. R., Turley, T., & Scribner, R. T. (2017, February 6). Domestic Violence Among Utah Women [PDF]. Utah Women & Leadership Project.
  5. Black, M.C., Basile, K.C., Breiding, M.J., Smith, S.G., Walters, M.L., Merrick, M.T., Chen, J., & Stevens, M.R. (2011). The National Intimate Partner and Sexual Violence Survey (NISVS): 2010 Summary Report. Atlanta, GA: National Center for Injury Prevention and Control, Centers for Disease Control and Prevention.
  6. Why Health Matters for Intergenerational Poverty [Pamphlet]. (2013). Salt Lake City , Utah: Utah Department of Health.
  7. Suicide Among Teens and Young Adults. (n.d.). Retrieved May 2, 2019, from http://health.utah.gov/vipp/teens/youth-suicide/
  8. Baldry, A. C. (2003). Bullying in schools and exposure to domestic violence. Child Abuse & Neglect,27(7), 713- doi:10.1016/s0145-2134(03)00114-5
  9. Dupéré, V., Leventhal, T., & Lacourse, É. (2008). Neighborhood poverty and suicidal thoughts and attempts in late adolescence. Psychological Medicine,39(8), 1295-1306. doi:10.1017/s003329170800456x
  10. 2017 State of Mental Health in America – Ranking the States. Retrieved May 2, 2019, from http://www.mental-healthamerica.net/issues/2016-state-mental-health-america-ranking-states
  11. Thomas, D., LCSW. Utah Suicide Prevention Plan 2017-2021. Utah Division of Substance Abuse and Mental Health, Utah Suicide Prevention Coalition. Retrieved May 2, 2019, from https://health.utah.gov/vipp/pdf/Suicide/Sui-cidePreventionCoalitionPlan2017-2021.pdf
  12. Suicide Prevention Resource Center. (2008). Suicide risk and prevention for lesbian, gay, bisexual, and trans-gender youth. Newton, MA: Education Development Center, Inc. retrieved May 2, 2019 from https://www.sprc.org/sites/default/files/migrate/library/SPRC_LGBT_Youth.pdf

Citation

Diener Z & Sheinberg A. (2019). A Complex Web: Exposure to Domestic Violence, Aggressive Behaviors and Suicidality in Utah Adolescents. Utah Women’s Health Review. doi: 10.26054/0KFTYRFGC2.

PDF

View/download

Arthritis in Utah: Significant Differences for Women

Background

Arthritis includes over 100 different rheumatic diseases (Hardin, Crow, & Diamond, 2012). Although the causes and symptoms vary, they all share symptoms of pain, swelling, stiffness, and tenderness in one or more joints (Hardin et al., 2012). Arthritis may lead to decreased mobility, and over time joints may lose their normal shape (Hardin et al., 2012). Osteoarthritis (OA), the most common form of arthritis, is a degenerative joint disease (Centers for Disease Control and Prevention, 2017c). OA develops over a long time and is the result of long-term wear, tear, and break-down of joint cartilage (Centers for Disease Control and Prevention, 2017c). Rheumatoid arthritis (RA), the second most common form of arthritis, is an auto-immune disease that attacks joints and can affect multiple systems, tissues, and organs throughout the body (Centers for Disease Control and Prevention, 2017e). Lupus, fibromyalgia, and gout are other common forms of arthritis (Centers for Disease Control and Prevention, 2017b).

Arthritis is the most common cause of disability in the US (Utah Department of Health, 2015b). In 2017, the prevalence of arthritis among adults ages 18 and older in Utah was 19.3% (Utah Department of Health, 2015b). This represents approximately 419, 800 individuals based on the estimated Utah population 18 years and older for 2017 (Utah Department of Health, 2015c). Women are significantly more likely to suffer from arthritis than men, according to the Utah Department of Health (UDOH): 26% of adult women in Utah versus 19% of men had arthritis (Utah Department of Health, 2015b). Women are also more likely to have lupus, which is a type of arthritis with distinct differences (Hardin et al., 2012). New cases of RA are about two to three times higher in women than in men (Centers for Disease Control and Prevention, 2017e), and women of childbearing years (15-44 years) are the most likely to develop lupus (Centers for Disease Control and Prevention, 2017d).

Biology, genetics, hormones and environmental factors all contribute to these differences (Hardin et al., 2012). For example, women are two to five times more likely than men to sustain an anterior cruciate ligament (ACL) injury, a risk factor for developing knee OA ; this may be due to differences in the shape of their knee bones (Hardin et al., 2012). Specific genes are also associated with a higher risk of certain types of arthritis (Hardin et al., 2012). Other risk factors include obesity, smoking, joint injuries, infection, and occupations that involve repetitive knee bending and squatting (Centers for Disease Control and Prevention, 2017e; Hardin et al., 2012).

The effects of arthritis are wide-ranging. Arthritis is a leading cause of disability and a major cause of severe joint pain (Centers for Disease Control and Prevention, 2017a). In Utah, over half (56.2%) of adults with arthritis are taking prescribed pain medications, which is significantly greater than those without arthritis (25.8%) (Utah Department of Health, 2015b). Many types of arthritis, especially RA, are “associated with an increased risk of heart disease and even early death” (Hardin et al., 2012). In Utah, 53% of adults with heart disease and 47% of adults with diabetes also have arthritis (Utah Department of Health, 2015b). Arthritis limits many of their normal activities making it harder to manage their heart disease, diabetes, or other chronic conditions (Centers for Disease Control and Prevention, 2017a).

Adults with arthritis are also more likely to report an injury related to a fall, have substantial activity limitation, work disability, and reduced quality of life (Centers for Disease Control and Prevention, 2017a). Women tend to experience many of the negative effects of arthritis to a greater degree than men. Women have greater pain, greater reductions in knee function, and greater reductions in their overall quality of life than men (Hardin et al., 2012).

Data

Data
The prevalence of arthritis in Utah consistently stayed around 21% from 2011-2015 with the prevalence staying around 24% for women and 18% for men (see Figure 1). In 2014, 24.1% of U.S. adults had arthritis (Division of Behavioral Science, CDC Office of Surveillance, Epidemiology, and Laboratory Services, 2015). This is significantly higher than the 2014 prevalence in Utah of 21.4% (Utah Department of Health, 2014).

Figure 1. Age-adjusted percent of Utah adults with arthritis by gender
Figure 1. Age-adjusted percent of Utah adults with arthritis by gender (2011-2015, BRFSS)

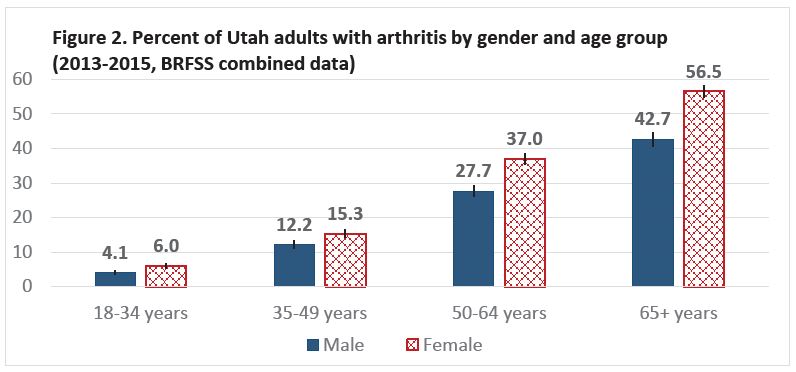
Arthritis is increasingly more common as people age, although people of all ages can be affected by the disease. In Utah, 85% of people with arthritis in 2015 were younger than 65 (Utah Department of Health, 2015b). Arthritis is significantly more common for women than men in every age group (Utah Department of Health, 2015a) (see Figure 2).

Figure 2. Percent of Utah adults with arthritis by gender and age group
Figure 2. Percent of Utah adults with arthritis by gender and age group (2013-2015, BRFSS combined data)

Figure three shows additional differences by sex and arthritis status. Women with arthritis are more likely than men with arthritis to have been diagnosed with depressive disorder, report 7 days or more of poor mental health within the past 30 days (Utah Department of Health, 2015b), and to report that they were limited in any of their usual activities due to their arthritis (Utah Department of Health, 2015a). Even though women, regardless of arthritis status, are more likely than men to report more poor mental health and to be diagnosed with depressive disorder, women with arthritis are also significantly more likely than women without arthritis to report these conditions (see Figure 3). The exact reasons for the difference in mental health between men and women are not known as they arise from complex interactions of genetics, environmental factors, and psychology. However, it is apparent that women with arthritis have a higher burden of poor mental health and activity limitations than men with or without arthritis, and than women without arthritis.

Figure 3. Percent of Utah adults with poor mental health and activity limitations

Impact on Other Domains of Health

Arthritis also impacts social and occupational domains of health. Arthritis lessens the ability of affected individuals to participate in social activities such as shopping, going to the movies, or going to religious or social gatherings. Again, women are more likely to report social participation restriction than men due to their arthritis (18% of women, 13% of men) (Utah Department of Health, 2015b). Limitations in ability to work or to do certain types of work are also reported by 34% of working-age women and 32% of working-age men due to their arthritis (Utah Department of Health, 2015b). The physical, social, and work limitations experienced by people with arthritis likely contribute to their reduced quality of life and greater number of days with poor mental health.

Current Efforts, Resources, and Recommendations

According to the CDC, “physical activity can decrease pain and improve physical function by about 40%” and may reduce annual healthcare costs by approximately $1,000 per person, yet one in three adults with arthritis are physically inactive (Centers for Disease Control and Prevention, 2017a). Adults with arthritis can also reduce their symptoms by participating in a disease self-management education program (SMEP) (Centers for Disease Control and Prevention, 2017a).

While over half of adults with arthritis are using prescribed pain medications (56.2%), only 16.6% have ever attended a SMEP (Utah Department of Health, 2015b). The Utah Arthritis Program (UAP) works with organizations statewide to offer evidence-based SMEPs and exercise programs, such as EnhanceFitness and the Arthritis Foundation Exercise Program (AFEP), for people with arthritis. Living Well with Chronic Conditions, Utah’s main SMEP for people with arthritis, helps participants learn about and improve their use of medications, exercise and nutrition, communication with providers and loved ones, and symptom management (Lorig et al., 2001). The class mitigates the negative effects of arthritis. Participants report significant improvements in general health, fatigue, disability, and social activity limitations (Lorig et al., 2001).

“Adults with arthritis are significantly more likely to attend an education program when recommended by a provider” (Centers for Disease Control and Prevention, 2017a). The Utah Arthritis Program developed a referral website (https://arthritis. health.utah.gov/) for people with chronic conditions, including arthritis, to find self-management and exercise programs near them or for physicians to register patients directly into a workshop. Current classes and schedules can be found at livingwell.utah.gov.

References

  • Centers for Disease Control and Prevention. (2017a). Arthritis in America: Time to Take Action! CDC Vital Signs, Retrieved from https://www.cdc.gov/vitalsigns/pdf/2017-03-vitalsigns.pdf
  • Centers for Disease Control and Prevention. (2017b). Arthritis Types. Retrieved May 30, 2017, from https://www.cdc.gov/arthritis/basics/types.html
  • Centers for Disease Control and Prevention. (2017c). CDC Osteoarthritis Fact Sheet. Retrieved May 30, 2017, from https://www.cdc.gov/arthritis/basics/osteoarthritis.html
  • Centers for Disease Control and Prevention. (2017d). Lupus Detailed Fact Sheet.
  • Centers for Disease Control and Prevention. (2017e). Rheumatoid Arthritis Fact Sheet. Retrieved May 30, 2017, from https://www.cdc.gov/arthritis/basics/rheumatoid-arthritis.html
  • Division of Behavioral Science, CDC Office of Surveillance, Epidemiology, and Laboratory Services, C. for D. C. and P. (2015). Behavioral Risk Factor Surveillance System (BRFSS). Office of Public Health Assessment.
  • Hardin, J., Crow, M. K., & Diamond, B. (2012). Get the facts: Women and Arthritis. Arthritis Foundation. Retrieved from http://www.arthritis.org/New-York/-Files/Documents/Spotlight-on-Research/Get-the-Facts-Women-and-Arthritis.pdf
  • Lorig, K. R., Ritter, P., Stewart, A. L., Sobel, D. S., Brown, B. W., Bandura, A., … Holman, H. R. (2001). Chronicdisease self-management program: 2-year health status and health care utilization outcomes. Medical Care, 39(11), 1217–23. Retrieved from http://www.ncbi.nlm.nih.gov/pubmed/11606875
  • Utah Department of Health. (2014). Behavioral Risk Factor Surevillance Systems (BRFSS), 2014. Salt Lake City: Office of Public Health Assessment. https://ibis.health.utah.gov/.
  • Utah Department of Health. (2015b). Behavioral Risk Factor Surveillance System (BRFSS), 2015. Salt Lake City: Utah Department of Health, Center for Health Data. https://ibis.health.utah.gov/.
  • Utah Department of Health. (2015c). IBIS-PH, Dataset Queries, Population Estimates for 2015. Salt Lake City: https://ibis.health.utah.gov/.

Citation

George S. (2019). Arthritis in Utah: Significant Differences for Women. Utah Women’s Health Review. doi: 10.26054/0K7E21H4QA.

PDF

View/download

Select Alcohol-Attributable Emergency Department Visits and Inpatient Hospitalizations for Women 18-64 Years of Age

Background

An estimated 530 deaths occur each year in Utah from alcohol attributable causes. There are consistent gender disparities in alcohol-attributable deaths in Utah. Men are disproportionally among the alcohol fatalities, while women account for 150 (28%) of these deaths (Centers for Disease Control [CDC], 2010). In Utah, a lower prevalence of adult women (18 and older) report binge drinking (7.5 percent) compared to the national average for women (11.1 percent) (CDC, 2019). However, alcohol-attributable harms, such as alcohol-attributable emergency department (ED) visits and in-patient hospitalizations, have increased at a higher rate for both genders in the past decade relative to national trends (Talwakar and Ahmad, 2013).

Consistent monitoring of alcohol-attributable harms may be useful in supporting the development and implementation of evidence-based prevention strategies recommended by the Community Preventive Services Task Force. These strategies to reduce excessive drinking and related harms include increasing taxes on alcohol purchases, regulating the density of alcohol outlets, and having and enforcing commercial host liability laws (The Community Guide, 2015).

Binge drinking is defined as consumption four or more drinks on a single occasion for a woman or five or more drinks for a man (National Institute of Alcohol Abuse and Alcoholism, 2004). Most people who binge drink are not alcohol dependent or alcoholics (Esser et al., 2014). However, binge drinking is the most common form of excessive alcohol use and can have both immediate and long-term effects on women’s health.

A few of the short-term effects associated with excessive drinking include injuries from motor vehicle crashes or falls, violence in the form of sexual assault or suicide, alcohol poisoning, risky sexual behaviors, and miscarriage and stillbirth among pregnant women (CDC, 2015).

Several of the long-term effects of excessive alcohol use include increased risk of high blood pressure, various cancers, learning and memory problems, mental health problems like depression and anxiety, social and family problems, and alcohol dependence (CDC, 2015).

This report describes alcohol-attributable emergency department (ED) visits and inpatient hospitalizations for women 18-64 years of age between 2004 and 2014.

Data

Data include ED visits and hospitalizations with a primary, 100 percent alcohol-attributable diagnosis (CDC, 2010). Diagnoses that are not always attributed to alcohol use (e.g., falls and motor vehicle crashes) are not included. Therefore, calculated numbers may underestimate the true impact of alcohol use.

In 2014, 2,263 ED visits were alcohol-attributable for Utah women aged 18-64, up from 1,150 in 2004. In 2014, the rate of alcohol-attributable ED visits per 10,000 population was 26.2 compared to 16.0 in 2004, a 63.1 percent increase. In contrast, the overall rate per 10,000 population of total ED visits for women aged 18-64 decreased slightly from 3,252.3 in 2004 to 3,226.9 in 2014 (Figure 1) (Utah Emergency Department Encounter Database, 2015; Utah Inpatient Hospital Discharge Data, 2015).

Alcohol-attributable hospitalizations for women 18-64 years old increased from 444 (6.2 per 10,000 population) in 2004 to 958 (11.1 per 10,000 population) in 2014, a 78.8 percent increase. In contrast, the overall rate of hospitalizations per 10,000 for this population decreased from 1,268.5 in 2004 to 1,062.3 in 2014, a 16.3 percent decrease (Figure 1). By age group, the rate of alcohol-attributable ED visits and hospitalizations varied. Women aged 18-34 years had an 83.6 percent increase (12.4 in 2004 to 22.7 in 2014) in alcohol-attributable ED visits and a 154.4 percent (2.6 to 6.6) increase in alcohol-attributable hospitalizations. Women aged 35-49 years had a 42.5 percent increase (23.5 to 33.4) in alcohol-attributable ED visits and a 35.9 percent increase (12.0 to 16.3) in alcohol-attributable hospitalizations. Women aged 50-64 years had a 71.2 percent increase in alcohol-attributable ED visits (13.7 to 23.5) and a 111.2 percent (6.0 to 12.6) increase in alcohol-attributable hospitalizations.

The rate of alcohol-attributable ED visits and hospitalizations varied across the twelve local health districts (LHD). In 2004, ED rates per 10,000 population for women 18-64 years old ranged between 7.7 and 22.9, and increased by 8.1 percent to 148.7 percent in 2014, to a range of 13.8 to 48.1. Results from one LHD were not included in 2004 due to the data not meeting Utah Department of Health (UDOH) standards for publication.

In 2004, hospitalizations by LHD, for women aged 18-64 years, were between 2.2 and 11.4 per 10,000 population, and increased by 20.4 percent to 157.0 percent in 2014 to a range of 5.2 to 29.4. Results from four LHDs were not included in 2004 and three in 2014 due to the data not meeting UDOH standards for publication.

Nationally, from 2001–2002 to 2009–2010, the rate of alcohol-attributable ED visits for all adult women increased 38 percent (26 to 36 per 10,000 population) (Talwakar and Ahmad, 2013). Utah has lower overall rates of alcohol-attributable ED visits compared to these national statistics; however, Utah rates have increased more steeply.

Figure 1. Select Alcohol Attributable and Total ED Visits/Inpatient Hospital Stays Per 10,000 population Utah Women 18-64

The prevalence of binge drinking for Utah women aged 18-64 was 6.9 percent in 2005 and 8.8 percent in 2014 (Figure 2) (Behavioral Risk Factor Surveillance System [BRFSS], 2014). A change in BRFSS survey methodology and the confidence intervals shown suggest that this difference may not be significant.

Figure 2. Utah Binge Drinking Prevalence, Women 18-64

Domains of Health

Excessive alcohol use is relevant to many of the domains of health and increases the risk of both chronic diseases and acute outcomes. Because of differences between women and men in body structure and chemistry, women who drink excessively are at increased risk for some health conditions compared to men, such as the following (CDC, 2015):

  • Cirrhosis and other alcohol-attributable liver diseases
  • Brain damage
  • Damage to the heart muscle

Alcohol use also increases the risk of cancer of the mouth, throat, esophagus, liver, colon, and breast among women. Increased risk to reproductive health is a special concern. Excessive drinking may increase both the risk of infertility and a pregnant woman’s risk of miscarriage, stillbirth, and premature delivery. Women who drink alcohol while pregnant increase the risk of having a baby with Fetal Alcohol Spec-trum Disorders (FASD) and are more likely to have a baby die from Sudden Infant Death Syndrome (SIDS) (CDC, 2015).

Available Resources and Recommendations

While the prevalence of binge drinking may be increasing among women in Utah, further research could examine whether a change in binge drinking is associated with an increase in alcohol-attributable ED visits and hospitalizations. Collecting additional data, such as surveys or follow-up questions to survey respondents, may be useful in understanding excessive alcohol use and related harms.

In addition to assessing the prevalence of binge drinking, binge drinking intensity (i.e., the number of drinks per binge drinking episode) and frequency (i.e., the number of binge drinking occasions in the past month) are also informative data. In 2014, binge drinking intensity in Utah for all adults was 8.1 drinks per binge occasion while it was 7.6 binge drinks per occasion nationally (BRFSS, 2014). While our preliminary analyses did not show much change in binge drinking intensity and frequency for women aged 18-64 from 2005 to 2014, future studies could examine whether high-intensity and frequent binge drinking are associated with increased risk of alcohol-attributable ED visits and hospitalizations among women in Utah.

The Utah Department of Health employs an alcohol epidemiologist to conduct monitoring and surveillance of excessive alcohol use and related harms. The alcohol epidemiologist educates stakeholders about evidenced-based prevention strategies for reducing excessive alcohol use and related harms, such as those recommended by the Community Preventive Services Task Force (The Community Guide, 2015).

Disclaimer

This article was supported by Cooperative Agreement Number NU58DP001005-01-00 from the Centers for Disease Control and Prevention. Its contents are solely the responsibility of the authors and do not necessarily represent the official views of the Centers for Disease Control and Prevention or the Depart-ment of Health and Human Services.

References

  • Behavioral Risk Factor Surveillance System (BRFSS). (2014). Retrieved from Utah Department of Health, Center for Health Data and Informatics, Indicator-Based Information System for Public Health website: http:// ibis.health.utah.gov/. accessed April 26, 2019
  • Centers for Disease Control (2015). Alcohol & Public Health, Fact Sheets-Alcohol, Alcohol Use and Your Health, Excessive Alcohol Use and Risks to Women’s Health, Retrieved from https://www.cdc.gov/alcohol/fact-sheets.htm. Accessed April 26, 2019
  • Centers for Disease Control (CDC). (2010). Alcohol-Related Disease Impact (ARDI) application. Retrieved from https://nccd.cdc.gov/DPH_ARDI/Default/Default.aspx. Accessed April 26, 2019. Accessed April 26, 2019
  • Centers for Disease Control (CDC). (2016). Chronic Disease and Health Promotion Data & Indicators. U.S. Chronic Disease Indicators: Alcohol. Retrieved from https://chronicdata.cdc.gov/Chronic-Disease-Indicators/U-S-Chronic-Disease-Indicators-Alcohol/5hba-acwf. Accessed April 26, 2019
  • The Community Guide. (2015) Excessive Alcohol Consumption, Retrieved from https://www.thecommunityguide. org/topic/excessive-alcohol-consumption. Accessed April 26, 2019
  • Esser, M.B., Hedden, S.L., Kanny, D., Brewer R.D., Gfroerer, J.C., & Naimi, T.S. (2014). Prevalence of Alcohol Dependence Among US Adult Drinkers, 2009–2011. Prev Chron Dis 11:140329. DOI: http://dx.doi. org/10.5888/pcd11.140329. Retrieved from https://www.cdc.gov/pcd/issues/2014/14_0329.htm. Accessed April 26, 2019
  • National Institute of Alcohol Abuse and Alcoholism. (2004). NIAAA council approves definition of binge drinking. NIAAA Newsletter, 3;3. Retrieved from https://pubs.niaaa.nih.gov/publications/Newsletter/winter2004/Newsletter_Number3.pdf. Accessed April 26, 2019
  • Talwalkar, A. & Ahmad, F. (2013). QuickStats: Rate of Emergency Department Visits for Alcohol-Related Diagnoses, by Sex — National Hospital Ambulatory Medical Care Survey, United States, 2001–2002 to 2009–2010, Morbidity and Mortality Weekly Report, 62(35). Retrieved from https://www.cdc.gov/ mmwr/preview/ mmwrhtml/mm6235a9.htm. Accessed April 26, 2019
  • Utah Emergency Department Encounter Database, Bureau of Emergency Medical Services. (2014). Retrieved from Utah Department of Health, Center for Health Data and Informatics, Indicator-Based Information System for Public Health website: http://ibis.health.utah.gov/
  • Utah Inpatient Hospital Discharge Data, Office of Health Care Statistics. (2014). Retrieved from Utah Department of Health, Center for Health Data and Informatics, Indicator-Based Information System for Public Health website: http://ibis.health.utah.gov/

Citation

Buckner A. (2019). Select Alcohol-Attributable Emergency Department Visits and Inpatient Hospitalizations for Women 18-64 Years of Age. Utah Women’s Health Review. doi: 10.26054/0K0BVF7JC2.

PDF

View/download

Women with Disabilities: An Important Health Disparity Population

Background

Americans with disabilities are an often overlooked population experiencing health disparities, with women facing greater disability-related health disparities than men [1-3]. Although the presence of disparities between individuals with disability and those without disability is clear, inconsistent definitions of disability across research studies and government agencies have hampered progress towards a fuller understanding of the factors underlying these disparities, and how to best address them to promote health equality in this population [2].

In 2003 the Interagency Committee on Disability Research found the United States government had 67 different definitions of disability [4]. Most disability definitions fall into one of three conceptual categories: medical (based on medical diagnoses), social (defines disability as a predominantly social construct arising from environmental barriers) and functional (defines disability as the inability to complete certain life tasks [2]. Each of the definitions has utility for specific research projects, but the lack of a standard definition makes it impossible to compare data across studies.

Additionally, studies which use the functional definition are often too broad to identify health issues unique to groups with specific medical diagnoses, whereas medical definitions may miss individuals with significant impairments who lack a medical diagnosis. The Centers for Disease Control and Prevention (CDC), as well as the World Health Organization, have adopted the functional definition of disability. The CDC utilizes the Behavioral Risk Surveillance System (BRFSS) as their primary source of data on disability, estimating that 1 in 5 Americans experience disability, with mobility and cognitive disabilities as the most common [5].

Racial and ethnic minorities, as well as those unemployed or living in poverty, have higher rates of disability [1]. Nationwide women are more likely than men to experience disability at all ages, with 24.4% of women reporting a functional disability compared to 19.8% of men [5].

Among women, those with disabilities are less likely to receive routine preventive health care such as cervical cancer screening, mammography and dental care [1, 6]. While women with and without disability are equally likely to desire pregnancy, once pregnant, women with disabilities may experience barriers to accessing health care, may be less likely to receive adequate prenatal care, and may face criticism and judgement from those who dis-approve of their pregnancy [7, 8]. Pregnant women with disability may be at risk for stillbirth, preterm birth, low birthweight babies, fetal growth restriction, and cesarean delivery, although risks vary by type of disability [9].

Data

Three national surveys include questions about disabilities: BRFSS, the American Community Survey, and the National Health Interview Survey. All three surveys use a functional definition; however, the methodology and number of questions vary by survey. Despite standardized questions in each of the three surveys, disability prevalence in 2013 varied by survey [10]. The 2013-2015 BRFSS survey, which we utilized in this data snapshot, contained questions on five categories of disability: cognitive, mobility, vision, self-care and independent living (see appendix for the list of questions). BRFSS data was utilized because information about health care utilization and outcomes were also available in this dataset. The statistics reported below are compiled from BRFSS data using the Disability and Health Data System.

Utah has lower rates of overall disability compared to the United States (19.0% vs 22.5%), as well as lower levels of disability in each of the five categories [11]. County-level data for Utah shows the highest rates of disability (for people of all ages and genders) in Carbon, Emery, San Juan and Piute counties [12]. According to 2006 data (the most current year of publicly-available expenditures data) Utah spent less on disability-associated health-care than any other state; the per person expenditure for Utah was estimated at $1,443 com-pared to $2,190 for the nation [13].

As in the rest of the United States, mobility disabilities were the most common type in Utah, with a prevalence of 10.1% (compared to 13.1% nationally). Disability rates for all reported racial and ethnic minorities in Utah were higher than for whites. Most strikingly, disability was 17.9% among whites compared to 32.2% among American Indian/Alaskan Natives. Utah veterans also had higher rates of disabilities than non-veterans (22.8% vs. 18.8%) [11].

Women in Utah have higher rates of disability overall (21.8%) compared to men (16.0%).

Figure one shows the breakdown of disability by category for Utah women and men.

Figure 1. Age-Adjusted Percentage of Disability Among Utah Adults (18+) by Disability Type and Sex, 2014
*Percentages are age-adjusted to 2000 U.S. standard population. Data compiled by DHDS from 2014 BRFSS survey, compiled by DHDS [11].

There are pronounced disparities in health care utilization and health outcomes for women with disabilities in Utah (Figure Two). The largest difference is in the proportion of women with Self-Reported Fair or Poor Health; only 6.5% of women without disabilities fit this category compared to 36.8% percent of women with disabilities.

Figure 2. Health Disparities Between Utah Women with and without Disabilities, in age-adjusted percentages, 2014

Between 2013 and 2014, most of the factors displayed in Figure Two were stable. However, although there were minimal changes in the proportion of women without disability who were obese between 2013 and 2014, the percentage of women with disability who were obese increased from 33.5% in 2013 to 41.4% in 2014. This increase highlights a unique risk factor for Utah women with disabilities, and presents a possible key point for future public health interventions.

Seven Domains of Health

Creating an environment in the state of Utah which is supportive of women with disabilities is a crucial aspect of addressing the multi-faceted model of wellness. As showing in Figure Two, Utah women with disabilities are experiencing markedly lower levels of physical wellness than their counterparts, but the disparities do not end with their physical well-being. Studies have shown that people with any type of disability are 1.7 times as likely to report inadequate emotional support than those without a disability [14] and as borne out in the Utah data, women with disabilities are almost five times as likely to have 14+ days of poor mental health than women without disabilities. Some women with disabilities may face discrimination and stigma because of their impairment [1], which leads to difficulties in creating the robust social network needed for optimal health and can also impact a woman’s spiritual health.

The financial well-being of women with disabilities is another area of concern for overall health, as people with disabilities are much more likely to live in poverty and be unemployed [1]. People with disabilities are less than half as likely to attend college, which can impact their intellectual heath [1]. Many of the disparities in these domains of health are not the consequence of the person’s impairment alone, but are exacerbated by deficiencies in the individual’s environment. Despite government actions to require physical accommodations, many areas of public life are still not accessible to those with physical limitations.

One recent survey of 2400 health care facilities in California found only a small fraction of offices were accessible— only 3.6% of offices had a scale that could accommodate those with physical disabilities, and only 8.4% had exam tables with adjustable heights [15]. For individuals with intellectual disabilities, they can find themselves in a healthcare environment where their provider excludes them from decisions on their care, or does not properly understand how to share health information with them [1].

Actions, Resources and Recommendations

There are many changes Utah could make to improve the health of people with disabilities. Two key areas, which are promoted by Healthy People 2020, are: 1) Increase the quality of disability health data, and 2) increase the use of evidence-based health/wellness programs for people with disabilities [16].

In addition to continuing to collect population-level data on functional disability, Utah should promote the exploration of how functional disability and medical conditions overlap to produce disparities, particularly for women and racial/ethnic minorities. The Utah Population Database (UPDB) is uniquely suited to fill this research gap. The UPDB condition-specific data would be particularly useful to women’s health providers in Utah, as pregnancy in women with disability is understudied.

Utah could also expand the use of evidence-based health and wellness programs for women with disabilities, particularly those suffering from obesity. Utah currently has a wide-range of services available for people with disabilities available through the Utah Department of Human Services. Unfortunately, these services only reach a small proportion of those who need them. In 2016, 5,559 people with disabilities received services, with an additional 2,510 individuals on a wait list due to limited state funding. On average, those who received services waited 5.73 years [17]. Despite having a higher prevalence of disability, women were less likely to receive services than men, with only 38.6% of state-funded services going to women. Attention to the unique needs of women, as well as additional state funding, are needed to promote health equality for Utah women with disability.

References

  1. Iezzoni, L.I., Stigma and Persons with Disabilities, in Stigma and Prejudice. 2016, Springer. p. 3-21.
  2. McDermott, S. and M.A. Turk, The myth and reality of disability prevalence: measuring disability for research and service. Disabil Health J, 2011. 4(1): p. 1-5.
  3. Krahn, G.L., L. Hammond, and A. Turner, A cascade of disparities: Health and health care access for people with intellectual disabilities. Mental Retardation and Developmental Disabilities Research Reviews, 2006. 12(1): p. 70-82.
  4. Krahn, G.L., D.K. Walker, and R. Correa-De-Araujo, Persons with disabilities as an unrecognized health disparity population. American journal of public health, 2015. 105 Suppl 2: p. S198.
  5. Courtney-Long, E.A., et al., Prevalence of Disability and Disability Type Among Adults–United States, 2013. MMWR Morb Mortal Wkly Rep, 2015. 64(29): p. 777-83.
  6. Mitra, M., et al., Maternal Characteristics, Pregnancy Complications, and Adverse Birth Outcomes Among Women With Disabilities. Med Care, 2015. 53(12): p. 1027-32.
  7. Iezzoni, L.I., et al., Physical Accessibility of Routine Prenatal Care for Women with Mobility Disability. J Womens Health (Larchmt), 2015. 24(12): p. 1006-12.
  8. Iezzoni, L.I., et al., “How did that happen?” Public responses to women with mobility disability during pregnancy. Disabil Health J, 2015. 8(3): p. 380-7.
  9. Morton, C., et al., Pregnancy outcomes of women with physical disabilities: a matched cohort study. PM&R, 2013. 5(2): p. 90-8.
  10. Courtney-Long, E.A., et al. A Comparison of Disability Prevalence Estimates Across Three Federal Population-Based Surveys 2015; Available from: https://ww2.amstat.org/meetings/jsm/2015/onlinepro gram/AbstractDetails.cfm?abstractid=316947.
  11. Centers for Disease Control and Prevention. Disability and Health Data System (DHDS). June 1 2016 [cited 2017 May 5]; Available from: http://dhds.cdc.gov/.
  12. Community Commons. Community Health Needs Assessment: Utah Statewide Disability Report. [cited 2017 May 9]; Available from: http://www.communitycommons.org/.
  13. Anderson, W.L., et al., Estimates of State-Level Health-Care Expenditures Associated with Disability. Public Health Reports, 2010. 125(1): p. 44-51.
  14. Havercamp, S.M. and H.M. Scott, National health surveillance of adults with disabilities, adults with intellectual and developmental disabilities, and adults with no disabilities. Disabil Health J, 2015. 8(2): p. 165-72
  15. Mudrick, N.R., et al., Physical accessibility in primary health care settings: Results from California on-site reviews. Disability and Health journal, 2012. 5(3): p. 159-167.
  16. Healthy People2020. Disability and Health. [cited 2017 5/30/2017]; Available from: https://www.healthy people.gov/2020/topics-objectives/topic/disability-and-health?topicid=9https://www.healthypeople.gov/2020/topics-objectives/topic/disability-and-health?topicid=9.
  17. DSPD. Annual Report 2016 Division of Services for People With Disabilities. 2016; Available from: https://dspd.utah.gov/pdf/AR_Final_Draft2016.pdf.

Appendix

The five BRFSS questions on disability which were included in the 2013, 2014 and 2015 surveys are as follows:

  1. Cogitive: Because of a physical, mental, or emotional condition, do you have serious difficulty concentrating, remembering, or making decisions?
  2. Mobility: Do you have serious difficulty walking or climbing stairs?
  3. Vision: Are you blind, or do you have serious difficulty seeing, even when wearing glasses?
  4. Self-care: Do you have difficulty dressing or bathing?
  5. Independent living: Because of a physical, mental, or emotional condition, do you have difficulty doing errands alone such as visiting a doctor’s office or shopping?

Citation

Baayd J, Clark L, Willis S, & Simonsen SE. (2019). Women with Disabilities: An Important Health Disparity Population. Utah Women’s Health Review. doi: 10.26054/0K5ME66CA2.

PDF

View/download

Women’s Health in Utah’s Homeless Population

The U.S. Department of Housing and Urban Development defines “Homeless” as “individuals and families who lack a fixed, regular, and adequate nighttime residence” and those “who are fleeing, or are attempting to flee, domestic violence… or other dangerous or life-threatening conditions that relate to violence against the individual or a family member” (State of Homelessness Executive Committee, 2015). A person is deemed chronically homeless if she or he remains homeless longer than one year or has four episodes of homelessness in a three-year time period, and if she or he has a disabling condition (HUD, 2007).

Women and families are the fastest-growing segment of the homeless population, as calculated with a Point-In-Time (PIT) count (ACOG, 2013). Risk factors for women becoming homeless include: extreme poverty, affordable housing shortage, inadequate social support, substance abuse, mental illness, and history of violence (Comprehensive Report on Homelessness State of Utah, 2016). In fact, domestic and sexual violence is the leading cause of homelessness for women and families, and over 92% of homeless mothers “have experienced severe physical and/or sexual abuse” in their life (The Characteristics and Needs of Families Experiencing Homelessness, 2011). 73% of homeless persons have unmet health needs; and women, in particular, lack preventative care such as prenatal care, mammograms and Pap smears (Baggett, O’Connell, Singer, & Rigotti, 2010).

Partly due to this lack of access, 30% of the care provided by homeless clinics to women is for chronic diseases (ACOG, 2013). This results in lower prioritization of reproductive planning; and although most homeless women have access to contraception, often they are provided methods with high-failure rates, putting them at high risk for unintended pregnancy and poorer obstetric outcomes.

In the mid 1980s, Salt Lake revitalized their downtown by demolishing and redeveloping many Single-Room Occupancy Hotels (SROs). The SROs were home to the city’s lowest-income residents who often worked within walking distance. When the SROs were destroyed in the early 2000’s, about 1,000 residents were left homeless and jobless. Prior to this, Utah homelessness was temporary; however, now it can be permanent and often intergenerational (http://fourthstreetclinic.org/history/). As of 2016, 2,807 individuals remained homeless in Utah at a given point-in-time (Comprehensive Report on Homelessness State of Utah, 2016).

Since 2009, Utah has received national recognition for its reduction in homelessness. Unfortunately, some of this decline is secondary to changing definitions of what constitutes homelessness and how rates of homelessness are reported. From 2007 to 2016, the total number of homeless individuals in Utah decreased by 6.8%, compared to a national 15% reduction; and from 2011 to 2016, the number of homeless individuals in families decreased by 8%, compared to a national decrease of 16% (see figure 1) (PIT and HIC Data Since 2007, 2018). Yet between 2011 and 2016 there was been a significant reduction in the number of individuals in Utah affected by chronic homelessness compared to national reductions, particularly those individuals that are unsheltered (see Figure 2).

Figure 1. Utah's trends in select homeless populations from 2007-2016
Figure 1. Utah’s trends in select homeless populations from 2007-2016. Source: 2007-2016 PIT Counts by State. U.S. Department of Housing and Urban Development, Homeless Point-in-Time Count Data
Figure 2. Utah's reductions in chronic homelessness compared to the national trends between 2011 and 2016
Figure 2. Utah’s reductions in chronic homelessness compared to the national trends between 2011 and 2016. Source: 2007-2016 PIT Counts by State. U.S. Department of Housing and Urban Development, Homeless Point-in-Time Count Data


This reduction in chronic homelessness was largely attributable to the rapid re-housing programs and provision of permanent supportive housing for select individuals. The majority of these services are provided by the Road Home, Utah’s largest homeless shelter. Demonstrating ongoing commitment to maintaining these services, in 2016, the Housing and Homeless Reform Initiative (H.B. 436) was passed, appropriating $27 million over three years to focus on the needs of homeless sub-populations such as families and victims of domestic violence (Comprehensive Report on Homelessness State of Utah, 2016).

In addition to rapid re-housing, Utah’s homeless population has increasing access to primary care. The Fourth Street Clinic, in downtown Salt Lake City, serves over 5,000 homeless patients annually ( http://fourthstreetclinic.org/history/). In 2017, there were over 25,000 visits and 35% of the patient population was female. In 2015, the University of Utah Department of Obstetrics and Gynecology began staffing a women’s health clinic within the Fourth Street Clinic. This clinic provides essential women’s healthcare needs, including treatment for cervical dysplasia, urinary incontinence and contraceptive counseling and provision. By increasing homeless Utahns’ access to primary care, Fourth Street is a major contributor to ending homelessness, promoting community health, and achieving health care savings.

While homelessness is decreasing, largely due to improving homeless assistance, this system cannot fix the affordable housing crisis. Housing is still unaffordable to a large number of Americans, and this lack of affordable housing is the leading cause of homelessness among families with children (The Characteristics and Needs of Families Experiencing Homelessness, 2011; State of Homelessness Executive Committee, 2015). The housing crisis continues to worsen, and assistance programs need to help maintain housing stability when possible. Most important, policy makers in Utah need to prioritize investment in affordable housing, while continuing to provide rapid re-housing and access to primary care for homeless Utahns.

References

  • American College of Obstetricians and Gynecologists (ACOG. (2013). Health Care for Homeless Women.
  • Baggett, T. P., O’Connell, J. J., Singer, D. E., & Rigotti, N. A. (2010). The unmet health care needs of homeless adults: a national study. Am J Public Health, 100(7), 1326-1333. Retrieved from https://www.ncbi.nlm.nih.gov/pmc/articles/PMC2882397/pdf/1326.pdf.
    doi:10.2105/ajph.2009.180109
  • The Characteristics and Needs of Families Experiencing Homelessness. (2011). Retrieved from iles.eric.ed.gov/fulltext/ED535499.pdf
  • Comprehensive Report on Homelessness State of Utah. (2016). Retrieved from https://jobs.utah.gov/housing/scso/documents/homelessness2016.pdf
  • Homeless Point-in-Time Count Data. (2016). Retrieved from https://www.hudexchange.info/resource/3031/pit- and-hic-data-since-2007/
  • State of Homelessness Executive Committee. (2015). Retrieved from https://www.hud.gov/sites/documents/PIH2013-15HOMELESSQAS.PDF. Accessed April 29, 2019
  • U.S. Department of Housing and Urban Development (HUD) Office of Community Planning and Development, Office of Special Needs Assistance Programs (2007). HUD’s Homeless Assistance Programs. Defining Chronic Homelessness: A Technical Guide for HUD Programs. Retrieved from https://files.hudexchange. info/resources/documents/DefiningChronicHomeless.pdf. Accessed April 29, 2019

Citation

Benson AE & Gawron L. (2019). Women’s Health in Utah’s Homeless Population. Utah Women’s Health Review. doi: 10.26054/0K37YFD98Z.

PDF

View/download

Sexual Minority Women’s Health in Utah

Background

In 2011, the Institute of Medicine completed a landmark report on the health of lesbian, gay, bisexual, and transgender (LGBT) persons in the US. This report documented that across numerous health-related domains, including health risk behaviors and both mental and physical health, sexual minorities were at a distinct disadvantage compared to their heterosexual peers (IOM, 2011). As a result of this report, more federal surveys began to include measures of sexual orientation. In 2012, the Utah Behavioral Risk Factor Surveillance Survey (BRFSS) began to include indicators of sexual orientation in its data collection. This paper presents the first snapshot of sexual orientation disparities across multiple indicators of health in Utah, including alcohol use behaviors, asthma and cardiovascular health, and mental health.

Sexual minority women are more likely to report a variety of negative health-related outcomes (IOM 2011). These disparities in health are largely attributed to increased exposure to “minority stress,” broadly defined as the increased exposure to victimization, discrimination, and stress due to the excess stigma associated with non-heterosexual identities and behavior (Meyer, 2003). As a result of these negative exposures, sexual minority women have been found to have higher levels of depression (Marshal et al., 2011), negative coping behaviors such as alcohol use and misuse (Hughes, 2011), and poorer physical health outcomes including increased risk for cardiovascular and respiratory diseases (Blosnich, Lee, Bossarte, & Silenzio, 2013).

Previous research suggests that sexual minority health can vary across contexts. In particular studies have examined the extent to which health can vary depending on the cultural climate within a state. For example, studies have linked changes in LGBT-specific policies, such as the passing of same-sex marriage bans or the legalization of same-sex relationships to changes in the health of sexual minority women (Hatzenbuehler, 2014). Generally, a politically conservative climate has been shown to have negative effects on the health and well-being of sexual minorities (Everett B, 2013).

To our knowledge, no research has examined the health of sexual minority women in the state of Utah. Sexual minorities in Utah may have a health disadvantage similar to what has been observed in national data. While same-sex marriage became permanently legal in 2014, other challenges that are related to a larger religious and politically conservative climate persist.

Data

Data came from the 2012-2015 Utah Behavioral Risk Factor Surveillance System
(BRFSS) data set. In 2012, the BRFSS began including data on sexual orientation identity in addition to a wide-ranging set of other health-related outcomes. We focused on several important domains of women’s health including general perceived health, physical limitations, asthma, diabetes, alcohol use, and depression. Previously, these health indicators have been linked to sexual orientation disparities in national data sets. Our sample was restricted to women who answered the sexual identity measure questions, as well as all of our health-indicator items. Our final sample size was 19343 women, 260 of whom identified themselves as gay or lesbian, 156 as bisexual, and 156 as “other.” Individuals who indicated “don’t know” or did not answer were excluded.

Health indicators were derived from survey items that asked respondents if they had ever been diagnosed with diabetes or pre-diabetes (yes=1, no=0), , or asthma (yes=1, no=0) by a medical provider. We also assessed whether or not respondents reported being “limited in any way in any activities because of physical, mental, or emotional problems“(yes=1, no=0). Self-rated health was measured using an item that asked participants,” Would you say that in general your health is:” with possible answers from “excellent” (1) to “poor” (5). We constructed a measure of alcohol use based on the question: “During the past 30 days, how many days per week or per month did you have at least one drink of any alcoholic beverage such as beer, wine, a malt beverage or liquor?” Based on the responses, we calculated how many of the past 30 days a respondent had consumed any alcohol. We also included a binge drinking indicator, which measured whether or not the respondent had consumed 5 or more alcoholic drinks on a single occasion during the past month.

Finally, we included two mental health indicators: 1) whether a health provider had ever told the respondents that they had a depressive disorder (including depression, major depression, dysthymia, or minor depression); and 2) a count of the days in the past month during which respondents experienced mental health problems, derived from the survey item: “Now thinking about your mental health, which includes stress, depression, and problems with emotions, for how many days during the past 30 days was your mental health not good?”

We compiled descriptive statistics and performed bivariate tests to examine differences by sexual identity in the prevalence of the assessed health conditions in the state of Utah. We compared means between non-sexual minority (heterosexual) and sexual minority women (bisexual, gay/lesbian, other). We also compared each sexual minority identity group to heterosexual women to capture variability within the sexual minority group. To assess whether differences were statistically significant we estimated F-tests that took our complex survey design into account. All statistics were weighted to produce population estimates and adjusted for year of the survey using the “svy” commands in Stata 14.

Results

Table 1 summarizes our results, which showed that sexual minority women were at a health disadvantage for many but not all of the outcomes we evaluated. Looking at our physical/general health outcomes, we observed no differences by sexual orientation for having “any” health limitation, or for having diabetes or pre-diabetes. However, we did see that sexual minority women report a higher prevalence of asthma (17%) compared to heterosexual women (12%). This difference was most pronounced between heterosexual and lesbian women: 20% of lesbians reported being diagnosed with asthma compared to 12% of heterosexual women. Turning to self-rated health, on average, sexual minority women reported higher scores indicating perceptions of their health that were worse than perceptions reported by hetero-sexual women. These disparities were largest when we compared women who identified their sexuality as “other” to heterosexual women.

Turning to alcohol use, the results showed that sexual minority women reported more days of drinking and a higher prevalence of binge drinking than their heterosexual peers. Table 1, Panel B illustrates that the disparity was largest between lesbian and heterosexual women: 68% of lesbians compared to 35% of heterosexual women reported binge drinking.

Table 1. Health Outcomes by Sexual Identity from 2012-2015 BRFSS data (n=19343)

Looking at mental health outcomes, sexual minority women reported a higher prevalence of depression (30%) and almost double the number of days they were limited by poor mental health (m=5.1), compared to heterosexuals (15%, m=2.7). Rates of depression and number of days limited by mental health were similar between bisexual and lesbian women. Mental health disparities were even larger among sexual minority women ages 18-24, 50% of whom reported depression compared to 14% of heterosexual women in the same age group.

Discussion

Our results are in line with other research that has found sexual minority women to report poorer health outcomes and engage in increased risk behaviors compared to heterosexual women. While we did not examine all seven domains of health, our results show disadvantages in both emotional and physical health for sexual minority women. Due to data limitations, we were unable to demonstrate disadvantages in other health domains.

However, the mental health disparities we observed are particularly striking given the high rates of suicide in Utah, especially among youth (https://ibis.health.utah.gov/indicator/complete_profile/SuicDth.html). It is possible that this increase in suicide rates may be due to the marginalization of sexual minority individuals within Utah’s dominant religion, coupled with the policies, which often are perceived as discriminatory, and which are related to sexual minority status in the dominant religion in Utah. Religious leaders of both Utah’s dominant religion and other religious groups have begun efforts to deal with this marginalization and policies; some of these efforts have been more successful than others.

We also saw higher rates of alcohol use among sexual minority women, particularly lesbian-identified women. This difference may reflect engagement in negative coping behaviors related to stressors and depression. It may also reflect that this group of women may be less connected to religious institutions in Utah that prohibit drinking; thus, disparities between the groups may be easier to detect. Regardless, the high rates of binge drinking among lesbian women in Utah (68%) suggest a need to reduce engagement in this and other health risk behaviors.

More encouraging, our results showed no differences in physical limitations or diabetes. However, we did find that sexual minority women are more likely to report having been diagnosed with asthma. This finding is in line with other work that has found disparities in asthma among persons in same-sex relationships compared to those in opposite-sex relationships.

Recommendations

We recommend policies and practices that remove stigma, as well as an increase of mental health and support services for sexual minority women to minimize the impact of health issues on domains of health. This has the potential to curb binge drinking in sexual minority populations. Future analyses will show whether changes in policies
(for example, the recent legalization of same sex marriage) will be reflected in diminishing health disparities over time.

References

  • Blosnich, J. R., Lee, J. G. L., Bossarte, R., & Silenzio, V. M. B. (2013). Asthma Disparities and Within-Group Differences in a National, Probability Sample of Same-Sex Partnered Adults. American Journal of Public Health, 103(9), e83–e87.
  • Everett B, Sexual Orientation Identity Change and Depressive Symptoms: A Longitudinal Analysis. J Health Soc Behav. 2015 March ; 56(1): 37–58. doi:10.1177/0022146514568349
  • Hatzenbuehler, M. L. (2014). Structural Stigma and the Health of Lesbian, Gay, and Bisexual Populations. Current Directions in Psychological Science, 23(2), 127–132.
  • Hughes, T. (2011). Alcohol-Related Problems Among Sexual Minority Women. Alcoholism Treatment Quarterly, 29(4), 403–435.
  • Institute of Medicine (IOM) Committee on Lesbian, Gay, Bisexual, and Transgender Health Issues and Research Gaps and Opportunities. (2011). The Health of Lesbian, Gay, Bisexual, and Transgender People: Building a Foundation for Better Understanding. Washington (DC): National Academies Press (US). Retrieved from http://www.ncbi.nlm.nih.gov/books/NBK64806/
  • Marshal, M. P., Dietz, L. J., Friedman, M. S., Stall, R., Smith, H. A., McGinley, J., Thoma, B.C., Murray, P.J., D’Augelli, R., Brent, D. A. (2011). Suicidality and Depression Disparities Between Sexual Minority and Heterosexual Youth: A Meta-Analytic Review. Journal of Adolescent Health, 49(2), 115–123.
  • Meyer, I. H. (2003). Prejudice, social stress, and mental health in lesbian, gay, and bisexual populations: conceptual issues and research evidence. Psychological Bulletin, 129(5), 674-697.

Citation

Geist C & Everett B. (2019). Sexual Minority Women’s Health in Utah. Utah Women’s Health Review. doi: 10.26054/0KC8V40BZQ.

PDF

View/download

Food Insecurity & 5 Fruits and Vegetables

Background

In Utah, 11.9% of households are considered food insecure (Coleman-Jensen, Rabbitt, Gregory, & Singh, 2016). Food security is determined when “individuals have physical, social, and economic access to sufficient, safe, and nutritious food to meet dietary needs and food preferences for an active and healthy lifestyle” (US Department of Agriculture, 2016). The United States Department of Agriculture (USDA) has set a range of food security standards categorized as high, marginal, low, and very low food security. Food access, which is another component of food security, takes residential location into account. Low food access occurs when a significant number (at least 33%) of individuals in a census tract live more than ½ urban miles or 10 rural miles from a supermarket (US Department of Agriculture, 2017).

Many households experience short periods of food insecurity that repeat periodically, due to a shortage of adequate personal finances or resources. In addition to sufficient and safe food, access to nutritious food is a central criterion of food security. The USDA has recommended that individuals eat at least 5 servings of fruits and vegetables a day to maintain a healthy diet. Food insecurity and not meeting the USDA fruit and vegetable recommendations are also correlated. Food insecurity has been associated with developmental delays, nutritional inadequacy, depression, obesity, diabetes, and many other adverse health outcomes (Ivers & Cullen, 2011).

Food insecurity disproportionately affects women (Mallick & Rafi, 2010). Women are more vulnerable to food insecurity because of increased vulnerability to poverty due to the gender wage gap, job segregation, gender-based violence, disproportionate caregiver responsibilities, and economic pregnancy costs (Ivers & Cullen, 2011). Nationally, single female-headed households (women without a partner and with children) have the highest rates of food insecurity, with 30.3% of households being food insecure in comparison to 22.4% of single male-headed households (men without a partner and with children) (Coleman-Jensen et al., 2016).

Even within partnered households, women bear the brunt of food insecurity consequences. Among all food-insecure individuals, the risk of obesity is higher in women than in men (Ivers & Cullen, 2011). Additionally, the risk of depression and anxiety is higher in food-insecure women than in men (Ivers & Cullen, 2011). These consequences are not isolated to the low and very low food-secure families. Existing literature has reported that marginally food-insecure families are more similar to low and very low food-insecure families than to high food-secure families, as was traditionally thought (Franklin et al., 2012).

Utah is uniquely affected by food insecurity due to the geographic and ethnic composition of the state’s residents. Food insecurity disproportionally impacts individuals living in rural regions of the state as well as individuals who are of Hispanic and Latino/a ethnicity. According to the U.S. Census, 13.7% of the Utah population is Latino. Nationally, it is estimated that approximately 1 in 5 Latino households are food insecure (Coleman-Jensen et al., 2016). Additionally, Utah has a significant rural population that is susceptible to food insecurity. According to the 2010 U.S. Census, 9.4% of Utah’s population live in rural areas and it is estimated that 15% of rural households are food insecure (Coleman-Jensen et al., 2016). By utilizing available resources and the encouragement of local infrastructure to promote food security, communities can improve self-sufficiency and prevent adverse health outcomes.

Data

As of 2015, food insecurity in Utah is close to the national average of 12.7%, which is an improvement compared to past years (Coleman-Jensen et al., 2016). According to a 2014 Feed America survey, within the state, the areas with the highest food insecurity prevalence are in southern Utah, with San Juan County having the highest prevalence (19.07%) of food-insecure families (Figure 1). Although Utah has similar food insecurity rates to those observed in the rest of the US, in low income areas with low food access, Utahns are doing worse than the national average.

Based on USDA 2015 data, 22.89% of the Utah population is low income and have low food access, while nationwide, 18.94% of the population is low income and have low food access. Over 50% of the population in several counties, specifically San Juan, Piute, Garfield and Daggett, have low income and low food access. Although these data document that rural areas are faring particularly poorly in Utah, this information is typically collected at the county level. Within the urban environment, specific areas of Salt Lake, Provo, and Ogden have populations in which over 50% are low income and have low food access. An example of Utah urban neighborhoods with low food access and low income is shown in Figure 2. On the county level, Utah’s urban counties fare well in food security rates, but at the census tract level some urban neighborhoods have up to 90% of the population struggling with low income and low food access.

Figure 1. Food Insecurity Rate in Utah by County in 2015
Figure 2. Urban Population with Limited Food Access, Low Income by Census Tract

Fruit and vegetable consumption is one way to measure overall food insecurity. Studies have found that food insecurity is associated with a lower intake of fruits and vegetables (Mello et al., 2010). In considering the average food security in Utah, the fruit and vegetable consumption is similar to the national average. Based on the Indicator Based Information Systems, 17.3% of Utah adults consume at least 3 servings of fruits and vegetables per day compared to 16.8% of all Americans. Based on data from the Centers for Disease Control, between 37.2 and 39.7% of Utah adults consume fruit less than once per day and 19.4-22.1 consume vegetables less than once per day. These figures are worse than reported measures in Utah in 2011.

In Utah, a community-based participatory research project that involved 396 members of many minority groups focused on food insecurity from a woman’s perspective (Author et al., 2016). As a measure of food insecurity within this study, 36% of participants said that they were concerned about having enough food within the past month. This study exhibited how women are the doorway to influencing a community’s health. After a 12-month evidence-based community wellness coaching program, 64% of children and 59% of spouses/partners had an increased fruit intake and 60% of children and 59% of spouses/partners had increased vegetable intake. Households where women had the primary responsibility for making food decisions were more likely to report increased fruit and vegetable intake (p=0.01). While there were 396 women directly participating in the study, 2499 family members were impacted because they lived with the women involved.

7 Domains of Health

Both food insecurity and fruit and vegetable intake are closely tied with many aspects of the 7 Domains of Health, specifically regarding environmental, physical, and emotional health. Food security and access to nutritious food are important aspects of physical health. Having access to nutritious food, and incorporating fruits and vegetables as a part of a diet, provides individuals with essential vitamins, minerals and fiber, all of which help prevent adverse health outcomes. Through a nutritious diet, including fruits and vegetables, individuals are at a decreased risk for many adverse health outcomes including obesity, diabetes mellitus, and high cholesterol (Ivers & Cullen, 2011).

Individuals with low food security, particularly women, are more likely to have poor physical health than individuals with high food security (Ivers & Cullen, 2011). Having a safe environment in which to easily obtain healthy food is connected to individual health outcomes. It is crucial for individuals to have access to locations that provide affordable and nutritious food so that cost and transportation logistical challenges do not prevent individuals from obtaining these foods. Food security is also connected to emotional health, specifically for women. Women who are food insecure, even marginally, have higher rates of depression and anxiety than women with high food security and men with any level of food security (Ivers & Cullen, 2011).

Resources and Recommendations

Throughout Utah, there are many programs that are being implemented to try to reduce food insecurity and increase access to fruits and vegetables. During the 2017 season, 23 farmer’s markets accepted food stamp benefits. Additionally, some of those markets have created a program that matches funds spent on produce (http://www. doubleupfoodbucks.org/). To increase access to fresh produce, there is a growing group of community gardens in the urbanized areas of the state. To get children involved and to ensure that their needs are met, 30 out of 80 districts in Utah participate in farm-to-school programs which utilize local produce for school breakfast, lunch, snack, and summer programs.

While these programs are slowly gaining traction, Utah ranks 50th in school breakfast program participation (Hewins, 2016). Because of this, the Utah Department of Health and Utahns against Hunger have partnered with Partners for Breakfast in the Classroom (http://breakfastinthe-classroom.org/), a program that provides assistance and grants to schools to increase breakfast participation. Schools are being encouraged to apply for the Healthy School programs, which helps schools create polices and environments to encourage healthy eating and an active lifestyle. Lastly, as seen within the Utah-based study, it is crucial to recognize the role that mothers and other women play regarding healthy eating. Through targeting women and ensuring that women’s health nutrition literacy and access is up to standard, entire families can be impacted.

References

  • US Department of Agriculture. (2016). Definitions of Food Security. Retrieved from https://www.ers.usda.gov/topics/food-nutrition-assistance/food-security-in-the-us/definitions-of-food-security/
  • US Department of Agriculture. (2017). Documentation. Retrieved from https://www.ers.usda.gov/data-prod- ucts/food-security-in-the-united-states/documentation/
  • Coleman-Jensen, A., Rabbitt, M., Gregory, C., & Singh, A. (2016). Household Food Security in the United States in 2015. In. USDA ERS. Retrieved from https://www.ers.usda.gov/publications/pub- details/?pubid=79760
  • Franklin, B., Jones, A., Love, D., Puckett, S., Macklin, J., & White-Means, S. (2012). Exploring mediators of food insecurity and obesity: a review of recent literature. J Community Health, 37(1), 253-264. Retrieved from https://www.ncbi.nlm.nih.gov/pubmed/21644024
  • Hewins, J. (2016). School Breakfast Scorecard. In: Food Research and Action Center. Retrieved from http://frac.org/wp-content/uploads/2016/09/School_Breakfast_Scorecard_SY_2014_2015.pdf
  • Ivers, L. C., & Cullen, K. A. (2011). Food insecurity: special considerations for women. Am J Clin Nutr, 94(6), 1740S-1744S. Retrieved from https://www.ncbi.nlm.nih.gov/pubmed/22089447
  • Mallick, D., & Rafi, M. (2010). Are Female-Headed Households More Food Insecure? Evidence from Bangladesh. In (Vol. 38). World Development. Retrieved from http://www.sciencedirect.com/science/arti- cle/pii/S0305750X09001958
  • Mello, J. A., Gans, K. M., Risica, P. M., Kirtania, U., Strolla, L. O., & Fournier, L. (2010). How is food insecurity associated with dietary behaviors? An analysis with low-income, ethnically diverse participants in a nutrition intervention study. J Am Diet Assoc, 110(12), 1906-1911. Retrieved from https://www.ncbi. nlm.nih.gov/pmc/articles/PMC3005628/
  • Zhang, W., Mukundente, V., Davis, F., Sanchez-Birkhead, A., Tavake-Pasi, F., . . . Digre, K. Healthy Women Lead Healthy Families: The impact of a wellness coaching program for women of color on the phys- ical activity and eating behaviors of family members. In: American Public Health Association. Oct 29- Nov 2 2016; Denver, CO.

Citation

Willis SK, Hemmert R, Baayd J, & Schliep K. (2019). Food Insecurity & 5 Fruits and Vegetables. Utah Women’s Health Review. doi: 10.26054/0KX2REJ04M.

PDF

View/download