Secondary Data Analysis of Non-Communicable Diseases Among Adult Female Refugees Arriving in Utah Between 01/01/2012 and 12/31/2015

Background

By the end of 2015, there were 21.3 million refugees worldwide (UNHCR, 2016), with around 50 percent women and girls (UNHCR, 2017b). Since the Federal Refugee Act of 1980, more than two million refugees have arrived in the US; this is almost two-thirds of the three million refugees who have been resettled in high-income countries (Amnesty-International, 2015; IBIS-PH, 2015). Utah hosts a relatively small number of refugees: in 2014, Utah received 1,085 of 69,986, or 1.55% refugees arriving in the US (USDHHS, 2015). Between 1998 and 2014, 16,273 refugees from different regions of the world have resettled in Utah, with an average of 1,183 persons per year during 2012-2014 (IBIS-PH, 2015).

According to the UN definition, refugees have been forced to flee their country of birth “because of persecution, war or violence.” Furthermore, refugees have “a well-founded fear of persecution for reasons of race, religion, nationality, political opinion or membership in a particular social group” (UNHCR, 2017a). The ethnicity of refugees arriving Utah is dependent on world and/or regional turbulence and varies over time. Thus, periodic adjustment of health policies for the mandatory health screening programs and further follow-ups within the first two years of arrival, based on refugees’ land of origin and interim location(s), seems beneficial.

Currently, the number of refugees from Africa and the Near East (including North Africa and Middle East) is increasing, while the number of refugees from South, Central and East Asia, and the Pacific is decreasing. Since 2007, hardly any refugees from Europe, Eurasia or Latin America have arrived in Utah (Graph 1) (IBIS-PH, 2015). While the latter groups might have more cultural similarity with the US host community, currently arriving refugees often have cultural values that are in sharp contrast with local culture.

For example, despite achieved progress towards women’s empowerment and gender equality in recent years, there are still failures in addressing gender-based disparities that may limit female refugees’ access to health care (UN, 2017), particularly in regions with war conflicts. Female refugees’ exposure to discrimination and violence during pre-migration and migration often requires immediate attention, upon resettlement, to their physical, mental, and emotional health. This, in turn, may affect a variety of other domains related both to health and successful resettlement (Frost et al., 2013).

Currently, refugee resettlement in the US includes overseas screening administered by the International Organization for Migration (IOM) – typically days to weeks prior to departure – and domestic medical screening overseen by receiving agencies and/or state and local health departments within 30-90 days post-arrival. Communicable diseases of public health significance, such as malaria and intestinal parasites and their presumptive treatments pre-departure, and tuberculosis during the initial health screening in the US are the main concerns (CDC, 2013).

Additionally, in the domestic health screening, refugees are assessed for hearing and visual acuity, and chronic conditions such as diabetes or hypertension (IBIS-PH, 2015), for which referral for care is provided if needed. In the long term, refugees’ impaired health conditions may affect their quality of life and impose a heavy burden on public resources. In Utah, refugees are eligible to apply for Medicaid for a period of eight months (UDOH, 2017). Then, they may continue their Medicare coverage (for certain conditions), or they may have to move to some other source for healthcare coverage. Most of the currently available epidemiological assessments have mainly concentrated on the infectious diseases and mental health issues of resettled refugees. In this cross-sectional study, we assessed the prevalence of referral for non-communicable health conditions of adult female refugees who arrived in Utah between 2012 and 2015. The primary study purpose was to understand how to better concentrate future efforts on adult female refugees’ health.

Graph 1: Number of refugee arrival to Utah by region
Graph 1: Number of refugee arrival to Utah by region. (IBIS-PH, 2015).

Methods

To assess the prevalence of non-communicable diseases among adult female refugees, we used the domestic health screening conducted upon arrival in Utah, obtained from the Utah Department of Health (UDOH). This dataset originally included 2,213 female refugees, irrespective of age, who arrived in Utah between 1/1/2012 and 12/31/2015. After excluding 1,006 female refugees age 18 or younger and 172 adult refugees without a medical referral, the final dataset included 1,035 (83.68% of adult female refugees), who at the initial domestic medical screening in Utah were referred for at least one medical condition.

The original dataset included 66 variables indicating a health condition these variables can be divided into 6 subgroups: 1) body systems, such as gastrointestinal; 2) medical specialties, such as cardiology; 3) subjective symptoms based on women’s self-reports, such as dysmenorrhea; 4) laboratory findings, such as eosinophilia; 5) clinical signs, such as murmur; and 6) diagnosis, such as arthritis. As the purpose of this data snapshot was to assess the frequency of referrals for individual non-communicable diseases, as well as identify variation in referrals by ethnicity, we took steps to avoid duplicative counts – if any of the referrals was related to a particular body system, we count-ed only one referral for that system. For example, if the data indicated that the woman was referred to ophthalmology for a corneal cavity or vision issue or other ophthalmology issue, we counted it as one referral, even if the three variables were identified. There were 112 women with referrals described as a comment rather than in a coded data field. These comments were coded into the six subgroups described above, and are briefly discussed further in this report.

Results

Table 1 summarizes the limited available demographic information and the refugees’ medical referrals. According to this table, 83.56% of the final adult study population with at least one medical referral were in their reproductive ages (18-49 years). The mean age of adult women with a referral was 36.2 years (STD 13.2 years). These women were from diverse backgrounds, representing 40 different countries or ethnicities, and almost 60 percent were from three countries: Iraq (n=270, 26.8%), Somalia (n=181, 18.0%), and Bhutan (n=150, 14.9%).

Table 1: Demographic characteristics and medical referral status of 1,010 female refugees arriving in Utah between 2012 and 2015, with at least one medical referral at initial domestic health screening
Table 1: Demographic characteristics and medical referral status of 1,010 female refugees arriving in Utah between 2012 and 2015, with at least one medical referral at initial domestic health screening. *Excluding conditions mentioned in the comments

Based on the coding methods described above, the five highest referrals were related to mental health (53.4%), vision (26.1%), musculoskeletal (23.6%), gastrointestinal (21.7%), and obstetrics/gynecology issues (20.3%). Adding medical conditions coded from the comment section of the records of 112 women changed the percentages slightly but did not substantially alter the percentage or relative position of the referral categories. Although referral for primary care services was not among the variables in the database, our coding of the comment section identified that 57 women (5.64% of all women with at least one referral, and 50.9% of women with a comment on the screening form) were referred for preventive care. According to the data comment section, due to the stigma attached to the mental health issues in some cultures, some women declined further mental screening.

Graph 2 summarizes the number of referrals per participant by country of origin/ethnicity as reported on the screening form. The average number of referrals for the entire population was 2.8 (STD: 1.7), with a minimum of one and a maximum of 10 referrals.

Graph 2: Distribution of average number of referrals by country of origin

Graph 2: Distribution of average number of referrals by country of origin is sorted by sub-population size, with the larger box sizes representing larger sub-populations – these have been sorted in descending order, exclusive of the last category, which combines 31 countries/ethnicities with smaller numbers of refugees per country/ethnicity. Overall, summary numbers are provided at the top of the graph. Country/ethnicity-specific mean (diamonds), median (horizontal bar within each box), and minimum and maximum referrals (numbers below the boxes) are also provided. Utah, 2012-2015

Discussion

More than half of the female adult refugees (53.4%) arriving in Utah between 2012 and 2015 had a referral for mental health at initial domes-tic screening. Irrespective of mental health condition, 104 women (10.3% of total study population) were victims of torture and violence, and 96 women (9.5% of total study population) suffered depression, which is lower than the prevalence of female adult depression in the US (16.8%-18.1%) and Utah (20.7%-21.7%) between 2012-2015 (IBIS-PH, 2016).

When considering a holistic approach with multiple domains of health (Frost et al., 2013), it becomes apparent that in addition to the physical, mental, and emotional disorders relating to pre-migration and migration hardships, post-migration resettlement in Utah – or any other developed host community – exposes refugees to new cultures, systems, religions, and technologies. These may adversely affect refugees’ spiritual and social domains of health. Language barriers and discounting refugees’ employment qualifications and experience, due to their different educational and training systems and labor market, may affect refugees’ intellectual and financial domains of health, which in turn, can negatively affect their mental and physical health. Any intervention to bridge refugees’ disrupted sociocultural connection, and to improve their intellectual and financial health, can positively influence all their domains of health.

With regard to physical health, referral data lacked information on referral for screening tests, such as mammography or Pap smear, which are needed for early diagnosis and treatment of breast and cervical cancer, two of the most prevalent cancers affecting women (WHO, 2017). According to our analysis, only 57 female refugees (5.64% of study population, but nearly 51% of women with a comment on the domestic screening form) were referred for primary care. Therefore, it is very likely that the domestic screening form does not adequately capture referrals to establish primary care.

However, the dataset lacks information on the referral centers; and number of referrals for preventive care may be more than what is stated here. Not only can establishing primary care be beneficial to the young female refugees who will spend the majority of their life in their new community; but also, from a public health point of view, this introduces a cost-effective method for spending public resources.

While the most common immediate referral for refugee women in Utah is for mental health services, consideration of the demographic characteristics of adult female refugees in Utah suggests that emphasis should also be placed on reproductive health, family planning, maternal health, and workshops or trainings on adopting healthy lifestyles. Promoting a healthy lifestyle, such as physical activity and healthy eating, can positively affect all domains of health, including physical and mental health. Among the most common physical health referral categories from our study were musculoskeletal (low back pain, arthritis, musculoskeletal pain), and gastrointestinal (constipation and diarrhea) complaints, all of which can be positively impacted by adopting a healthy lifestyle. Further, empowering women through improving their intellectual, social and financial health can have a positive impact on the mental and physical health of refugee women.

Acknowledgments

We would like to thank the Refugee Health Program at the Utah Department of Health for sharing dataset information.

References

  • Amnesty-International. (2015). Global Refugee Crisis – by the numbers. Retrieved from https://www.amnesty.org/en/latest/news/2015/10/global-refugee-crisis-by-the-numbers/
  • CDC. (2013). Refugee health guidelines: Guidelines for pre-departure and post-arrival medical screening and treatment of U.S.-bound refugees. Retrieved from https://www.cdc.gov/immigrantrefugeehealth/guidelines/refugee-guidelines.html
  • Frost, C. J., Murphy, P. A., Shaw, J. M., Jones, K. P., Varner, M., Mihalopoulus, N., . . . Digre, K. B. (2013). Refram- ing the view of women’s health in the United States: Ideas from a multidisciplinary national center of excellence in women’s health demonstration project
  • Clinics Mother Child Health, 11(1), 1-3. doi:10.4172/2090-7214.1000156
  • IBIS-PH. (2015). Complete Health Indicator Report of Refugee Arrivals. Retrieved from https://ibis.health.utah.gov/indicator/complete_profile/RefArr.html
  • IBIS-PH. (2016). Health Indicator Report of Depression: Adult Prevalence. Retrieved from https://ibis.health.utah.gov/indicator/view/Dep.UT_US.html
  • UDOH. (2017). Refugee Medicaid. Retrieved from https://medicaid.utah.gov/refugee-medicaid
  • UN. (2017). Goal 5: Achieve gender equality and empower all women and girls. https://www.un.org/sustainabledevelopment/gender-equality/
  • UNHCR. (2016). With 1 human in every 113 affected, forced displacement hits record high. Retrieved from http://www.unhcr.org/news/press/2016/6/5763ace54/1-human-113-affected-forced-displacement-hits-record-high.html.
  • UNHCR. (2017a). Who is a refugee? Retrieved from http://www.unrefugees.org/what-is-a-refugee/
  • UNHCR. (2017b). Women. Retrieved from http://www.unhcr.org/en-us/women.html
  • USDHHS. (2015). Fiscal Year 2014 Refugee Arrivals. Retrieved from https://www.acf.hhs.gov/orr/resource/fiscal-year-2014-refugee-arrivals
  • WHO. (2017). Promoting health through the life-course : Ten top issues for women’s health. Retrieved from http://www.who.int/life-course/news/commentaries/2015-intl-womens-day/en/

Citation

Najmabadi S, Gren LH, & Frost CJ. (2019). Secondary Data Analysis of Non-Communicable Diseases Among Adult Female Refugees Arriving in Utah Between 01/01/2012 and 12/31/2015. Utah Women’s Health Review. doi: 10.26054/0K4DRRS478.

PDF

View/download

Voting and Civic Engagement Among Utah Women

Acknowledgement:  This manuscript has been adapted from its initial release by the Utah Women & Leadership Project on October 3, 2016, as Research Snapshot No.  1:  Voting and Civic Engagement Among Utah Women (see http://www.uvu.edu/uwlp/research/briefs.html; accessed April 26, 2019).

Utah has a strong history of women’s political and civic involvement. The state was an early leader in giving women the vote, was home to the first female state senator in the nation (MacKay, 2005), and, as recently as 1996, had the strongest women’s voter participation in the United States (Davidson, 1996). However, these factors do not give the full picture; and in 2015 the Institute for Women’s Policy Research (2015) ranked Utah dead last in the area of political participation. Much of this ranking was due to the lack of women running for and serving in public office, but Utah women’s voter ranking and some aspects of civic involvement also were found to have room for improvement. As engagement in the community can be a key indicator of social health, while also providing opportunities for emotional and intellectual growth, these issues deserve attention. This research snapshot focuses on three key areas:

  1. Utah women’s voting participation rates and national ranking when it comes to voter turn-out,
  2. Utah women’s policy priorities, compared with those of Utah women and men nationwide, and
  3. Utah women’s levels of civic and community engagement, focusing on volunteer work but also exploring other ways in which Utah women are involved in their communities.

Women Voters in Utah

In Utah, although women’s voter registration and turnout rates are slightly higher than those of Utah men, they are currently lower than women’s rates in the nation as a whole. In the 2012 presidential election, voter turnout among all women in Utah (not just eligible voters) was approximately 54%, compared to 58.5% for women nationally (Hess & Williams, 2014).

Utah women have not always lagged in voter turnout. In the late 20th century, for three consecutive presidential elections (1988, 1992, and 1996), 76% of eligible women in Utah voted (Davidson, 1996). At that point, Utah had the highest women’s turnout of any state in the United States, where the national average for women voters was 63.8%. The following presidential election year, 2000, only 59.3% of eligible Utah women voted, a big drop from 1996 but still above the national average for women, which was 56.2% that year (United States Census Bureau, 2002). In 2012, only 54.0% of eligible Utah women voted, compared to the national percentage, 58.5% (United States Census Bureau, 2013). That year, Utah women’s voting participation ranking dropped to 46 of 51 states (including Washington, D.C.) for registered women voters nationally (United State Census Bureau, 2013). In the 16 years from 1996 to 2012, Utah’s ranking for the percentage of women voting dropped 45 spots. This drastic decline was highlighted in a 2015 ranking of Utah women’s political participation, wherein Utah was ranked 43 of 50 states for the percentage of women registered to vote, and 46 out of 50 for women who actually voted (Institute for Women’s Policy Research, 2015).

Nationally, voter turnout is highest in presidential years (e.g., the elections highlighted above) (DeSilver, 2014); and Utah voters, like all Americans, tend to cast ballots in much smaller numbers during midterm elections. Perhaps, Utah’s decreased voter turnout is even more pronounced because Utah is one of only nine states that elects its governor during presidential election years. This turnout decline holds for women; for example, in 2014, only eight states had a lower turnout than Utah among their women voters. Three of those states also choose their governors during presidential election years (Davidson, 2014). Only 37.6% of Utah’s eligible women voters came to the polls in 2014, versus 43% of women nationally (United States Census Bureau, 2015). Over the past 30 years, Utah women’s voting participation has been steadily decreasing, and the ranking versus women nationally is also on the decline.

Utah Women’s Policy Priorities

According to a 2016 survey by the Utah Foundation, women in Utah are most concerned about social issues such as homelessness, poverty, crime, and the environment. Specifically, the top ten policy issues for Utah women voters are as follows:

  1. K-12 education
  2. Healthcare
  3. Air quality
  4. State taxes and government spending
  5. Crime
  6. Homelessness and poverty
  7. Water supply and quality
  8. Jobs and the economy
  9. The environment
  10. Partisan politics

In contrast to Utah men who are, as a group, more likely to be concerned about property and sovereignty issues, Utah women’s focus on social issues is more closely aligned with Utahns’ priorities as a whole (Utah Foundation, 2016). Addition-ally, Utah women share several concerns with U.S. women in general; one recent study showed that women list (1) equal pay, (2) public school funding, (3) lower taxes, (4) paid sick leave, and (5) campaign reform as their top five issues (Green-berg Quinlan Rosner Research, 2016).

Civic Engagement

Utah women are heavily involved in volunteer work; Utah ranks first in the United States (by a large margin) for percentage of residents who regularly volunteer (Frohlich & Lieberman, 2015). While we were unable to locate data that specifically reports on Utah women’s volunteering, we know that across the nation, women’s volunteer rates are 6% percentage points higher than men’s (27.8% vs. 21.8%) (Bureau of Labor Statistics, 2016).

While specific data for Utah women’s volunteer rates (as distinct from rates of all Utahns) are unavailable, volunteer rates for all residents of Utah are highest in the nation, at 43.2%—almost 10% higher than the second-ranked state. According to the Corporation for National and Community Service, Utah volunteers give 75.6 hours of their time annually per capita. The report states that a large majority of Utahns’ volunteer service is given through religious organization (65.4%), followed by education (15.2%) and social service (6.8%) organizations. However, this high number for “religious” service does not necessarily mean that all the service given is religious in nature. Some of the main volunteer activities in which Utahns participate are teaching/tutoring (48.3%), mentoring youth (30.6%), collecting and distributing food (20.3%), and general labor (18.3%) (Corporation for National and Community Service, 2014).

Finally, in addition to their volunteering efforts, women in Utah are well-represented on non-profit boards (holding 45.8% of available seats) (Madsen, Backus, Jones, & Fischer, 2014), but less so on government boards and commissions where the rate is around 30% (Madsen & Goryunova, 2016). Utah women’s involvement in their communities, both through political activity (including voting) and through civic engagement such as volunteering and serving on boards, can improve aspects of their social, emotional, and intellectual health. Overall, finding ways to support women in such efforts will strengthen the positive impact of women in communities and the state as a whole.

The following list provides additional resources or information about women’s voter participation and civic engagement:

  • Real Women Run
  • United Ways in Utah
  • Utah Commission on Service and Volunteerism
  • Utah Foundation Reports
  • Utah League of Women Voters
  • Utah Women & Leadership Project Reports
  • Utah Women’s Networks and Groups
  • YWCA Utah

References

  • Bureau of Labor Statistics. (2016, February 25). Volunteering in the United States, 2015. Retrieved from http://www.bls.gov/news.release/volun.nr0.htm. Accessed April 26, 2019
  • Corporation for National and Community Service. (2014 data). Volunteering and civic engagement in Utah: Trends and highlights overview. Retrieved from https://www.nationalservice.gov/vcla/state/Utah. Accessed April 26, 2019
  • Davidson, L. (1996, March 13). Utah women are tops in voter turnout tallies. Deseret News. Retrieved from http://www.deseretnews.com/article/477166/UTAH-WOMEN-ARE-TOPS-IN-VOTER-TURNOUT-TALLIES.html Accessed April 26, 2019
  • Davidson, L. (2014, December 1). Utah had 3rd-lowest voter turnout among states. Salt Lake Tribune. Re-trieved from http://www.sltrib.com/news/1873023-155/utah-had-3rd-lowest-voter-turnout-among. Accessed April 26, 2019
  • DeSilver, D. (2014, July 24). Voter turnout always drops off for midterm elections, but why? Pew Research Center. Retrieved from http://www.pewresearch.org/fact-tank/2014/07/24/voter-turnout-always-drops-off-for-midterm-elections-but-why/. Accessed April 26, 2019
  • Frohlich, T. C., & Lieberman, M. (2015, March 23). States Volunteering the Most (and Least). 24/7 Wall Street. Retrieved from http://247wallst.com/special-report/2015/03/23/states-volunteering-the-most/4/. Accessed April 26, 2019
  • Greenberg Quinlan Rosner Research. (2016, February 17). Winning Women in 2016: Findings from a Web Survey of American Adults. Retrieved from http://www.americanwomen.org/research/document/American-Wom-en-Survey-Millennial-Memo-02.18.16.pdf. Accessed April 26, 2019
  • Hess, C., & Williams, C. (2014, May). The Well-Being of Women in Utah: An Overview. Institute for Women’s Policy Research & YWCA Utah. Retrieved from http://www.iwpr.org/publications/pubs/the-well-being-of-wom-en-in-utah-an-overview. Accessed April 26, 2019
  • Institute for Women’s Policy Research. (2015). The Status of Women in Utah, 2015: Highlights. IWPR #R455. Status of Women in the States. Retrieved from https://statusofwomendata.org/wp-content/themes/witsfull/fact-sheets/factsheet-utah.pdf, accessed April 26, 2019
  • MacKay, K. L. (2005). Women in Politics: Power in the Public Sphere. In P. L. Scott, L. Thatcher & S.A. Whet-stone (Eds.), Women in Utah History: Paradigm or Paradox? (pp. 360–393). Logan, UT: Utah State University Press. DOI: 10.2307/j.ctt4cgr1m
  • Madsen, S. R., & Goryunova, E. (2016, September 6). The Status of Women on Utah State Boards & Commis-sions. Utah Women & Leadership Project. Retrieved from http://www.uvu.edu/uwlp/docs/uwlpbrief2016no8.pdf. Accessed April 26, 2019
  • Madsen, S. R., Backus, C., Jones, G., & Fischer, B. (2014, February 24). The Status of Women Leaders in Utah Nonprofits. Utah Women & Leadership Project. Retrieved from http://www.uvu.edu/uwlp/docs/uwlp_brief_2014_no._2.pdf. Accessed April 26, 2019
  • United States Census Bureau. (2002). Voting and registration in the election of 2000. Table 4a. Retrieved from https://www2.census.gov/programs-surveys/cps/tables/p20/542/tab04a.xls. Accessed April 26, 2019
  • United States Census Bureau. (2013, May). Voting and registration in the election of November 2012. Report Number: P20-568, Table 4B. Retrieved from http://www2.census.gov/programs-surveys/cps/tables/p20/568/tab-le04b.xls. Accessed April 26, 2019
  • United States Census Bureau. (2015). Voting and registration in the election of November 2014. P20-577. Table 4B. Retrieved from https://www2.census.gov/programs-surveys/cps/tables/p20/577/table04b.xls. Accessed April 26, 2019 Utah Foundation. (2016, March). 2016
  • Utah priorities project: Part I: Survey of voters’ issues and concerns. Report number 739. Retrieved from http://www.utahfoundation.org/uploads/rr739.pdf. Accessed April 26, 2019

Citation

Madsen S & Scribner R. (2019). Voting and Civic Engagement Among Utah Women. Utah Women’s Health Review. doi: 10.26054/0KJCWN73EZ.

PDF

View/download

Utah Women and STEM

Acknowledgement: This manuscript has been adapted from its initial release by the Utah Women & Leadership Project on December 2, 2016, as Research Snapshot No. 4: Utah Women and STEM (see http://www.uvu.edu/uwlp/research/briefs.html).

Employment opportunities in Science, Technology, Engineering, and Math (STEM) sectors in Utah are estimated to reach 101,000 by 2018 (Carnevale, Smith, & Melton, 2011). These jobs are recognized nationwide as being well-compensated and generally recession-proof. Yet Utah women continue to hold a lower percentage of STEM-sec-tor jobs than women nationally; in fact, Utah is ranked last in the United States in terms of the percent of women employed in STEM. In addition, Utah women work in STEM occupations at a rate that is less than half that of Utah men (Institute for Women’s Policy Research (IWPR), 2013). Recognizing the role women must play as an integral part of a strong statewide workforce, Utah educational and civic leaders are working to increase opportunities and pathways for more Utah women to enter and thrive in STEM fields. Such efforts, including educational support and labor force incentives, will allow women to have greater success in their intellectual and financial health and overall well-being. This research report reviews three key areas:

  1. Current STEM employment data in Utah and nationwide,
  2. Possible explanations for the persistent gender gap in STEM, and
  3. A discussion of ongoing efforts in Utah to increase female participation and success in STEM fields.

Employment Data

The U.S. Bureau of Labor Statistics has project-ed that, between 2014 and 2024, total employment in science and engineering will increase (Fayer et al, 2017). While Utah currently boasts a 3.1% unemployment rate (compared with a 4.0% un-employment rate in the United States) (Lee, 2019), STEM occupations have accounted for only 4.56% of Utah’s workforce, slightly below the 4.58% national average (Prosperity Through Education, 2015). More recently, the National Science Foundation has documented higher rates in Utah for science and engineering occupations as a percent-age of all occupations (National Science Foundation, 2018). Yet, Utah women are not necessarily part of this growth, as they may be lagging behind men in STEM participation. A 2011 study by the Georgetown University Center on Education and the Workforce highlighted the persisting lack of gender diversity across the nation within both STEM education and the STEM occupations that are acknowledged as being among the most influential and high-paying sectors (Carnevale et al., 2011).

Nationally, a 2015 report by the U.S. Bureau of Labor Statistics illustrated marginalization of women within STEM, both in management (from 0% for natural sciences, 7.6% for engineering, to 26.7% for information technology) and in professional occupations (15.4% for engineering and 25.6% for computers and math) (Bureau of Labor Statistics, 2015). This situation is likely even worse in Utah, as is shown by a report from the Institute for Women’s Policy Research that estimates that women comprise only 23.5% of all STEM-sector workers in Utah, compared to 28.8% for women nationwide. That amounts to only 5.2% of Utah women being employed in STEM occupations, compared to 13.2% of men. Utah is ranked 51st out of 50 states and D.C. in this category (IWPR, 2019).

Possible Explanations for the Gender Gap

The U.S. Department of Commerce recognizes STEM education as the clear pathway to STEM-sector jobs (U.S. Department of Commerce, 2011), yet educational statistics demonstrate an inadequate supply of talent in the STEM jobs pipe-line among workers both in Utah and nationwide. In 2012–2013, 16.6% of bachelor’s degrees conferred by Utah’s post-secondary institutions were in STEM disciplines, a sliver above the national average of 16.5% (National Center for Education Statistics, 2014). Overall, STEM career progression is frequently referred to as a “leaky pipeline” be-cause of a diminishing interest in science and math as students move through the educational system (Prosperity Through Education, 2015). However, the decline is particularly true of female students, as gender stereotypes and a scarcity of female STEM role models continue to affect decisions made by girls and women in regards to their education and future career (Carnevale et al., 2011).

In the United States, only 12% of women with bachelor’s degrees choose STEM majors, compared to 28% of men (Hill, Corbett, & St. Rose, 2010). A recent survey of high school students showed that males expressed much higher interest in pursuing careers in STEM. The Utah graduating class of 2017 showed the highest gap compared to previous years between male and female aspirations to enter STEM careers, at almost 30%—38.8% male vs. 12.6% female (Alliance for Science and Technology Research in America, 2018). In 2012, women in Utah received only 20% of the total number of degrees or certificates awarded in seven STEM fields across the public colleges and universities in the state. The fields that had the lowest percent-age of female graduates were engineering tech (11% female), engineering (12%), and computer/information sciences (13%). The STEM fields with the highest percentage of female graduates were math and statistics (36%), biological/biomedical (38%), and science technicians (39%) (Hanewicz & Thackeray, 2013). In addition, the graduation rate in certain STEM fields is increasing rapidly among young men in Utah but is increasing only modestly among young women. For example, between 2010 and 2015, the number of computing degrees and certificates earned by men in Utah more than tripled, from 1,027 to 3,413. In contrast, the number of degrees women earned increased at a much slower rate, from 321 to 431, during the same time period (Change the Equation, 2015).

Finally, even when women graduate and begin to work in STEM fields, they tend to divert from STEM sectors at a higher rate than men do, and for different reasons. For instance, in the nation, 22% of women (vs. 7% of men) decide to leave STEM positions for family-related reasons, and only 15% (vs. 31% of men) leave based on pay or promotional opportunities, which can often be greater outside of STEM occupations as a career progress-es (Carnevale et at., 2011). Consequently, focused measures are needed, at both national and state levels, to attract, retain, and support the integration and success of students, particularly females, in STEM education and employment.

Finally, even when women graduate and begin to work in STEM fields, they tend to divert from STEM sectors at a higher rate than men do, and for different reasons. For instance, in the nation, 22% of women (vs. 7% of men) decide to leave STEM positions for family-related reasons, and only 15% (vs. 31% of men) leave based on pay or promotional opportunities, which can often be greater outside of STEM occupations as a career progress-es (Carnevale et at., 2011). Consequently, focused measures are needed, at both national and state levels, to attract, retain, and support the integration and success of students, particularly females, in STEM education and employment.

Efforts to Increase Participation

In order to ensure a sufficient local supply of qualified employees to fill future STEM jobs, Utah stakeholders are focusing increased efforts in promoting STEM fields (specifically to women in STEM) at all levels, including K–12, higher education, and professional employment. To that end, in 2013 the Utah legislature appropriated $10M for the creation of a STEM Action Center (Utah State Legislature, 2013) to promote science, technology, engineering, and math through best practices in K–12 education. The Center’s goal is to “produce a STEM–competitive workforce to ensure Utah’s continued economic success in the global marketplace” (STEM Action Center, n.d.). Additionally, in 2015 the Utah legislature approved $4.5M for an engineering initiative (Salt Lake Chamber, 2015), as well as a one-time appropriation of $280,000 for each of two schools in support of the Southern Utah STEM Initiative at Southern Utah University and of Dixie State University, as both target underserved and disadvantaged rural communities (Burt, 2015; Salt Lake Chamber, 2015). These state-appropriated funds could be utilized, directly or indirectly, to develop initiatives steering female students towards STEM education, and to support women in STEM occupations. For instance, Dixie State University was selected to host one of only 22 “Tech-Savvy” conference pilot programs nation-wide; the conference features a day-long STEM event for girls (Applegate, 2016).

Overall, Utah is taking positive steps and investing heavily in raising support and awareness for STEM education as a gateway to high-paying job opportunities, and many of these efforts are aimed specifically at overcoming STEM–gender challenges. For instance, Utah is one of 19 states to participate in the National Alliance for Partnerships in Equity (NAPE) STEM Equity Pipeline Project, which is a collaborative effort between higher education institutions and Utah school districts to increase female participation in STEM. This is a research-based program with specific quantitative goals that allows stakeholders to measure increased involvement among Utah girls (see http://www.napequity.org/stem/stem-equity-proj-ect/ for more information on this national project). In addition, the STEM Action Center now offers a dedicated STEM-girls webpage that features links to women-led scientific and engineering projects nationwide. The Center also hosts “girls only” events, which can allow girls to explore and learn in a comfortable environment (see http://stem.utah.gov/stem-girls/). Likewise, many institutions in the Utah System of Higher Education organize K–12 girls-only STEM summer camps to encourage higher participation in STEM fields. See, for example, SheTech (various locations), eSMART camp (Dixie State University), Girls Go Digital (various locations), and Hi-Gear (University of Utah) (Utah System of Higher Education, 2015).

In addition to university outreach programs aimed at K–12 students, the major universities and colleges in the state offer numerous programs and organizations for post-secondary female students in STEM. These groups provide mentoring, net-working, competitions, community outreach, training, and other support. For example, the Society for Women Engineers, a national organization, has chapters at Weber State University, Utah State University, the University of Utah, Brigham Young University and Neumont University, as well as a Greater Salt Lake chapter which encompasses all of Utah. In 2001, only Utah State University had a chapter of the Association for Computing Machinery—Women, a national organization; in 2016, Dixie State University, Snow College, the University of Utah, Brigham Young University, and South-ern Utah University formed chapters. Other groups include Women in Engineering and Technology at Brigham Young University and the ACCESS Program for Women in Science and Mathematics at the University of Utah, among many others. Interested female students at any Utah post-secondary institution can consult STEM departments or check the programs’ websites in order to locate and participate in these programs.

Finally, at the professional level, various state-wide associations for women, including the Amer-ican Association of University Women—Utah, Utah Women in Higher Education Network, and the Women Tech Council, offer visibility (such as the annual Women Tech Awards), networking, and mentoring on various issues of personal and professional growth both for career professionals in the STEM sector and for women in technology occupations in other industry sectors. In addition to supporting women individually, these organizations can also advocate for improved corporate culture among STEM companies and in career paths. Industries and their various pipelines will have to continue to make significant changes to better recruit, develop, and retain women in STEM fields, as women currently hold such a small per-centage of these jobs. For more details about these organizations, please refer to the Utah Women & Leadership Project’s extensive list of Utah Women’s Networks and Groups (http://www.uvu.edu/uwlp/resources/groups.html), which includes many as-sociations and chapters for women in STEM. In addition, see the list of STEM programs and offerings through Utah school districts, schools, colleges, networks, associations, and beyond (http://www.uvu.edu/uwlp/education/programs_support.html).

Conclusion

Mirroring national trends, the growing number of employment opportunities in Utah’s STEM sec-tor requires both more STEM talent overall and more equitable gender representation within the sector. Accordingly, Utah needs to continue its significant investments into programs that encourage and mentor Utah girls and women to pursue STEM education and careers, and industries must continue to improve corporate climate to attract and retain top women in STEM fields. STEM careers can provide solid opportunities for increased knowledge and intellectual growth, secure employment, and financial stability—all key areas to a woman’s overall health and well-being. Successful efforts to increase female participation in STEM fields will strengthen the positive impact of women in the state of Utah.

References

  • Alliance for Science and Technology Research in America. (2018). Utah’s 2018 STEM and Innovation report card. Retrieved from https://www.usinnovation.org/state/pdf_cvd/ASTRA-STEM-on-the-Hill-Utah2018.pdf. Accessed May 2, 2019
  • Applegate, J. (2016, March 2). Tech Savvy event for girls in STEM coming to Dixie; public participation encouraged. St. George News. Retrieved from http://www.stgeorgeutah.com/news/archive/2016/03/02/jla-tech-savvy-event-for-girls-in-stem-coming-to-dixie-public-participation-encouraged/#.WAl44SR2H-s. Accessed May 2, 2019
  • Bureau of Labor Statistics. (2015). Women in the labor force: A datebook. Retrieved from http://www.bls.gov/opub/reports/womens-databook/archive/women-in-the-labor-force-a-databook-2015.pdf. Accessed May 2, 2019
  • Burt, J. (2015, March 16). SUU engineers Utah’s future STEM education. Retrieved from https://www.suu.edu/news/2015/03/-suu-engineers-utahs-future-stem-education.html. Accessed May 2, 2019Carnevale, A. P., Smith, N., & Melton, M. (2011). STEM. Georgetown, University Center on Education and the Workforce. Washington, D.C. Retrieved from Georgetown STEM Report at https://cew.georgetown.edu/wp-con-tent/uploads/2014/11/stem-complete.pdf. Accessed May 2, 2019
  • Change the Equation. (2015). Vital signs: Utah. Retrieved from http://vitalsigns.ecs.org/state/utah/print. Accessed May 2, 2019
  • Fayer, S, Lacey, A., & Watson, A. (2017). STEM Occupations: Past, Present, And Future. U.S. Bureau of Labor Statistics. Retrieved from https://www.bls.gov/spotlight/2017/science-technology-engineering-and-mathematics-stem-occupations-past-present-and-future/pdf/science-technology-engineering-and-mathematics-stem-occupations-past-present-and-future.pdf. Accessed May 2, 2019
  • Hanewicz, C., & Thackeray, S. (2013). Utah women in STEM. Utah Women and Education Initiative. Retrieved from http://www.uvu.edu/uwlp/docs/uweibrief3.pdf. Accessed May 2, 2019
  • Hill, C., Corbett, C., & St. Rose, A. (2010). Why so few? Women in science, technology, engineering, and mathematics. AAUW. Retrieved from https://www.aauw.org/files/2013/02/Why-So-Few-Women-in-Science-Tech-nology-Engineering-and-Mathematics.pdf. Accessed May 2, 2019
  • Institute for Women’s Policy Research (IWPR). Women in STEM Occupations by State, 2013. Table B2.9. Retrieved from https://statusofwomendata.org/explore-the-data/employment-and-earnings/employment-and-earn-ings/#WomeninSTEMOccupations. Accessed May 2, 2019
  • Institute for Women’s Policy Research (IWPR). (2019). Status of women in the States. Utah. Retrieved from http://statusofwomendata.org/explore-the-data/state-data/utah/. Accessed May 2, 2019
  • Lee, J. (2019). Utah unemployment rate at 3.1 percent. Retrieved from https://www.deseretnews.com/arti-cle/900058794/utah-unemployment-rate-at-31-percent.html. Accessed May 2, 2019
  • National Center for Education Statistics. (2014). Digest of educational statistics. Retrieved from https://nces.ed.gov/programs/digest/d14/tables/dt14_319.30.asp. Accessed May 2, 2019
  • National Science Foundation. (2018). Data, chapter 8: State indicator S-32. Retrieved from https://www.nsf.gov/statistics/state-indicators/indicator/se-occupations-to-all-occupations. Accessed May 2, 2019
  • Prosperity Through Education. (2015). Salt Lake Chamber. Retrieved from https://slchamber.com/wp-content/uploads/2015/11/Updates2015-Prosperity-Through-Education.pdf. Accessed May 2, 2019
  • Salt Lake Chamber. (2015). Report card for the 2015 legislative session (FY 2015/2016). Retrieved from http://slchamber.com/wp-content/uploads/2015/10/REPORT-CARD.pdf. Accessed May 2, 2019
  • STEM Action Center. (n.d.). About the Utah STEM action center. Retrieved from https://stem.utah.gov/about-stem/. Accessed May 2, 2019
  • U.S. Department of Commerce. (2011). STEM: Good jobs now and for the future. ESA Issue Brief #03-11. Retrieved from https://eric.ed.gov/?id=ED522129. Accessed May 2, 2019
  • Utah System of Higher Education. (2015, June 30). USHE institutions engage K–12 students in STEM through interactive summer camps. Retrieved from https://higheredutah.org/ushe-institutions-engage-k-12-students-in-stem-through-interactive-summer-camps/. Accessed May 2, 2019
  • Utah State Legislature, H.B. 139. (2013). Retrieved from http://le.utah.gov/~2013/bills/hbillint/HB0139S05.htm. Accessed May 2, 2019

Citation

Madsen S, Goryunova E, & Scribner RT. (2019). Utah Women and STEM. Utah Women’s Health Review. doi: 10.26054/0KMZBM100A.

PDF

View/download

The Status of Women in Utah Politics: Congress, Statewide Executive Offices, and the State Legislature

Acknowledgement: This manuscript has been adapted from its initial release by the Utah Women & Leadership Project on December 2, 2016, as Research Snapshot No. 4: Utah Women and STEM (see http://www.uvu.edu/uwlp/research/briefs.html).

A host of national reports and media (e.g., Chu & Posner, 2013) in the past decade have ranked Utah last or near last in terms of women being in positions of decision making and leadership, and women in Utah politics is foundational to this issue. Raising awareness of the reasons why this is the case is critical to social change efforts focused on improving the representation of women in political roles within the state. Women serving in public office within the state of Utah have positive implications for women’s health. Research shows that when more women are involved in decision-making roles related to public policy, families and societies benefit (Madsen, 2015). Female legislators tend to extend greater support than their male counterparts toward legislation focused on health, education, and social programs that tend to positively impact families and society. This report compares current Utah data to national trends in terms of women in Utah politics, with a specific focus on Congress, state executive offices, and state legislatures. Tracking progress through updated status reports is an important way to help decision makers and other influencers clarify what is working and to determine and refine best steps moving forward.

Congress

National

The most current 2019 data show that, at the national level, women hold 23.7% of seats (127 of 535) in the 116th U.S. Congress (House and Senate) (Center for American Women and Politics [CAWP], 2019), which is an increase from the 113th U.S. Congress (CAWP, 2012). With 25% of U.S. Senate seats held by women, the total number of women serving in the chamber is at a record high (25 of 100) (CAWP, 2019). Of the 25 female Senators, eight are Republican. In addition, 23.4% (102 of 435) of the seats in the U.S. House of Representatives—up from 79 seats reported in 2014 (Madsen & Backus, 2014)—are now held by women, with 87.2% of them being Democrat (89 D, 13 R) (CAWP, 2019). It is interesting to note that of the 83 women who served in the House in 2017, two defeated incumbents in their district, eight won open seats, and 73 were re-elected as incumbents (CAWP, 2016d).

Four women non-voting delegates (2D, 2R) represent American Samoa, the District of Columbia, Puerto Rico and the Virgin Islands in the United States House of Representatives. (CAWP, 2019). New Hampshire, Washington, Nevada, and California continue to have both of their Senate seats filled by women. Vermont is the only state that has yet to elect a woman to serve in; Mississippi recently dropped from the list, electing its first female senator in 2018. In addition, the 116th Congress has the highest count of women of color in United States history, with 36 Democrats and three Republicans, a total of 39 seats (CAWP, 2019a). In addition, Washington elected the first Indian American Woman to the Congress in 2016.

Historically, the first woman in the House, Jeannette Rankin, a Montana Republican, was elected in 1917. However, it was not until 1978 that a woman, Nancy Landon Kassebaum (R-KS), was elected to the Senate without having previously filled an unexpired term (CAWP, 2016a). Nancy Pelosi (D-CA) became the first female Speaker of the House in 2007.

Utah

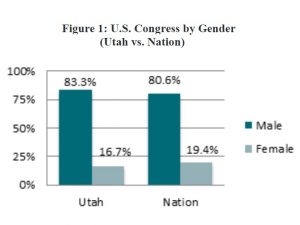
Utah has six seats in its national delegation (two senators and four representatives). Congresswoman Mia Love was elected to the U.S. House of Representatives in 2014, taking office in 2015, which put Utah at 16.7% (1 of 6) of its congressional delegation as female. Love, who was the first Utah woman elected to Congress since 1995, was not re-elected in 2018, so at this time there are no women in Utah’s national delegation. Figure 1 compares Utah with the national average in terms of congressional seats by gender as of 2016.

Figure 1: U.S. Congress by Gender (Utah vs. Nation)

Prior to Congresswoman Love’s victory, only three Utah women had served in Congress since its statehood: Rep. Reva Z. Beck Bosone (1949–1953), Rep. Karen Shepherd (1993–1995), and Rep. Enid Greene Waldholtz Mickelsen (1995–1997) (CAWP, n.d.). Two of the three served one two-year term. Utah has never elected a woman to serve in the U.S. Senate; in 2018, Jenny Wilson ran as the Democratic candidate but was not elected. However, in electing former Rep. Love to its congressional delegation, the state has made some progress since the 2014 Utah Women & Leadership Research & Policy Brief (Madsen, & Backus, 2014).

Statewide Executive Offices

National

At the national level, 2019 data show that women now hold 27.6% (86 of 312) of the state-wide elective executive offices (SEO) (46 D, 38 R) (CAWP, 2016e), having picked up additional seats since 2014 (Madsen & Backus, 2014). The six most often discussed SEOs include the positions of governor, lieutenant governor, secretary of state, state treasurer, attorney general, and state auditor. As of May 2019, 44 women (26 D, 18 R) have served as governors in 30 states (CAWP, 2016c). Of these female governors, 30 were elected in their own right, three replaced their husbands, and 11 became governor by constitutional succession, with six of them subsequently winning a full term. The largest number of women serving as governors at the same time is nine, which occurred in 2004 and 2007 and has occurred again in 2019. In 2019, nine states have female governors (Oregon, New Mexico, Alabama, Iowa, Kansas, Maine, Michigan, South Dakota, and Rhode Island), six Democrats and three Republicans (Fairygodboss), while 15 states have females serving as lieutenant governors (9 D, 6 R) (CAWP, 2016e). As of May 2019, seven of the 50 (14%) state attorney general seats in the nation were held by women (5 D, 2 R) (CAWP, 2016e). Finally, 11 (22%) secretary of state seats, ten (20%) state treasurer seats, and ten (20%) state auditor seats in the country currently are held by women (CAWP, 2016e). All of these numbers reflect increases from the national findings reported in 2014 (Madsen & Backus, 2014).

Utah

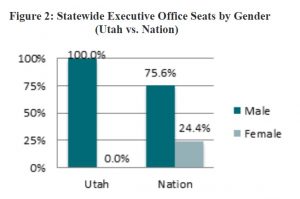
There are currently no women serving in Utah statewide executive offices (SEO) (CAWP, 2016f). Figure 2 compares Utah with the national average in terms of SEO by gender (national data as of 2016).

Figure 2: Statewide Executive Office Seats by Gender (Utah vs. Nation)

Throughout its history, Utah has never elected a woman to serve as governor. However, Utah has had one female governor and lieutenant governor. Olene Walker served as lieutenant governor to Mike Leavitt from 1993–2003, when he was nominated by the Bush Administration to serve as the Secretary of the U.S. Department of Health & Human Services. Walker was then appointed as governor to serve until the end of Leavitt’s term from 2003–2005. She sought re-election but did not win the Republican nomination at convention. The only other woman to serve in a Utah statewide officer role was Jan Graham (D), who was attorney general from 1993–2001 (CAWP, n.d.).

State Legislatures

National

According to the National Conference of State Legislatures, 1,875 women are serving in state legislatures in 2019 (25.4%) (NCSL, 2019). Overall, the percentage of women in state legislatures has increased through the years as follows:

  • 1971: 4.5%
  • 1981: 12.1%
  • 1991: 18.3%
  • 2001: 22.4%
  • 2011: 23.7%
  • 2013: 24.2%
  • 2015: 24.5 % (CAWP, 2016h)
  • 2017: 24.8% (CAWP, 2016b)
  • 2018: 25.4% (NCSL)

In 2016, Arizona and Vermont set the national highs for women in their legislatures (40.0% and 39.4%, respectively), followed by Nevada (38.1%), Colorado (38.0%), Washington (37.4%), Illinois (35.0%), Maine (33.9), Maryland (33.5%), Oregon (33.3%), and Rhode Island (31.9%). In the past, Utah was among the ten states with the lowest per-centages, but with 24.0% women in the legislature, this no longer is the case. (CAWP, n.d.).  It is also interesting to note that, nationally, Democrats make up 62.0% of the total women elected in legislatures, with elected Republican women making up 37.3% and the remaining 1% of seats being held by independents, non-partisans, and other parties.

According to a CAWP report from 10 years ago (Sanbonmatsu, Carroll, & Walsh, 2009), as well as more recent CAWP data, the numbers of Democratic women legislators has continued to increase, while the numbers of female Republican legislators declined since 1981.

Utah

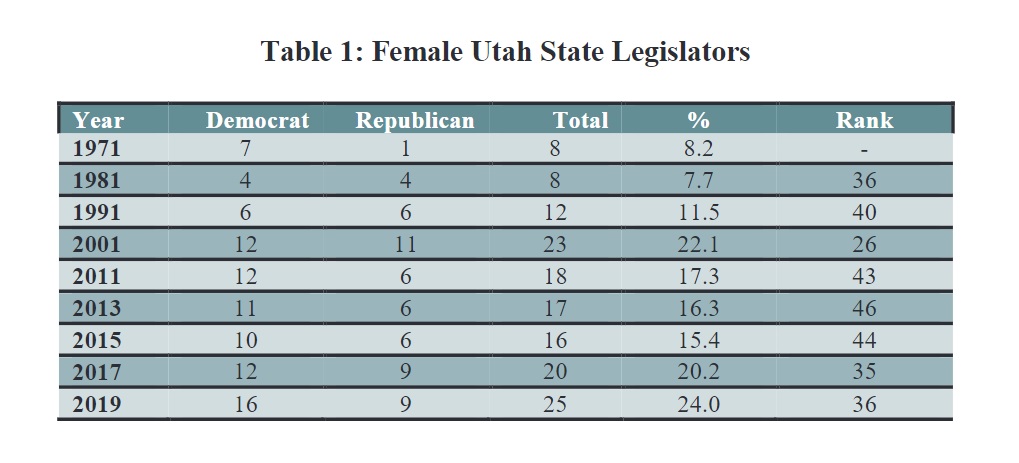
Table 1 (CAWP, n.d.) illustrates the Utah state legislature numbers and percentages since 1971 by party and gender. It is interesting to note that in 1971, 8.2% of Utah state legislators were women, while at the national level only 4.5% of seats were held by women. By 1981 Utah had slipped below the national average. In Utah, data also show that female legislators are more likely to be Democrat than Republican.

Table 1: Female Utah State Legislators

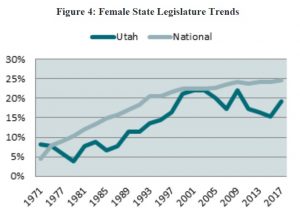
The total number of women serving in Utah’s state legislature had actually been decreasing since 2009, until 2017. The percentage of women serving in the legislature increased by 3.8% between the 2016 and 2017 legislative sessions (see Figure 4 for a comparison of this national versus Utah trend).

In 2014, six states had women serving as Speakers of their House of Representatives, with Utah’s own late Becky Lockhart accounting for one of them (Madsen & Backus, 2014). In 2019, that number has increased to seven (CAWP, 2019b). In terms of 2019 legislative leadership in Utah, of the 12 leadership positions in the House of Representatives, three are held by women, all Democrats: Minority Whip Carol Spackman Moss, Minority Assistant Whip Angela Romero and Minority Caucus Manager Karen Kwan (Utah House of Representatives, 2019). The Senate has 11 leadership positions, four of which are held by women: Assistant Majority Whip Ann Millner (R), Minority Leader Karen Mayne (D), Minority Whip Luz Escamilla, and Assistant Minority Whip Jani Iwamoto (Utah Senate, 2019).

Implications

These data support the notion that we do need more women to run for office at the highest levels in state and national government. Understanding why women do not run is critical to this conversation and can help leaders design more effective interventions to increase the percentage of women serving in these important public roles. We offer a few explanations. First, societal attitudes about electing women are not as much a deterrent as they were in past years, but research tells us that gender socialization still plays a substantial role in whether individuals “self-identify with politics and express ambition to seek elected office” (Lawless & Fox, 2004). Role socialization starts during childhood and extends into adolescence and adulthood.

Second, women’s aspirations and motivations for public office are typically lower than those of men. However, research from the past decade continues to confirm that women are as effective and successful in leadership positions as men (Zenger Folkman, 2012). Yet, studies (e.g., Madsen, 2008a; Madsen, 2008b) have found that women are more likely than men to struggle with envisioning themselves as leaders (leadership identity). If women do not see themselves as leaders and/or do not believe they can be leaders, they will not step forward to do so. Even though men and women often have the same qualifications, one study (Lawless & Fox, 2005) reported that women are significantly less likely than men to view themselves as qualified to run for office. Women often have different motivations to lead as well (leadership purpose).

Figure 4: Female State Legislature Trends

They focus, to a larger extent, on their desires to help the community, to be a voice for those who cannot speak, and to make a difference in people’s lives. If they do not see a leadership role as giving them an opportunity to do these things (or do not understand that a particular role may offer these opportunities), they most likely will not step forward to run.

Third, research continues to confirm that more women will run for office if others suggest they do so and provide support and encouragement. In 2008, the Center for American Women and Politics conducted a national study (Sanbonmatsu et al., 2009), attempting to understand the reasons women decided to run for public office. Researchers found that women and men seek state legislative office for somewhat different reasons. They asked, “Other than your desire to serve the public, what was the single most important reason that you decided to seek the office you now hold?” Of the six primary replies, women responded significantly higher than men to the following: 1) “a party leader or an elected official asked me to run or serve”; and 2) “my concern about one or more specific political issues.” Men responded significantly higher to the following two reasons: 1) “my longstanding desire to be involved in politics”; and 2) “my desire to change the way government works.”   One study (Lawless & Fox, 2005) found that a key factor in explaining the gender gap was that women were far less likely than men to be encouraged to run for office. Interestingly, other researchers (Sanbonmatsu et al., 2009) discovered that women were actually more likely than men to run for their first elected office because they were recruited. This was the primary response in one survey where participants were asked about their decisions to seek office. The bottom line is this: women are encouraged less often to run for office, but when they are encouraged and/or recruited, they are more likely to step forward.

Fourth, gender socialization is typically unconscious, and girls and women are often socialized to-ward an “imposter syndrome” mentality, in which women do not feel they are qualified even when they may actually have more knowledge, skills, and abilities than their male counterparts (Guensburg, 2016). In addition, studies have found that women face a “double-bind”—they are expected to be compassionate, kind, competent, and strong (not tough), but when people believe leaders need to be “tough” to “do the job,” then women do not “fit” a leader role (Phillips, 2016). Women struggle with feeling and being “authentic” within political environments because of pervasive social norms (Ngunjiri & Madsen, 2015).

Fifth, there are differences, both perceived and literal, in female candidates’ treatment. Researchers (e.g., Guensburg, 2016) have found that women candidates experience widespread bias and are scrutinized for appearance and questioned about family responsibilities when men are not.

Sixth, national research shows that the “Good Old Boys Network” continues to have a strong-hold in party politics, and Utah is no exception. Both conscious and unconscious biases continue to influence decision makers toward traditional practices, policies, and processes that keep women from running, networking, and succeeding if they do run. Yet, the evidence is clear (Madsen, 2015): Utah residents, groups, organizations, and communities will benefit from having both men and women serve together in elected public offices. Extensive research has found that the “tipping point” is 30%, which means that to obtain the benefits outlined in Madsen (2015), a leadership team, board, or political body, for example, needs to have at least 30% female representation. These are only six of many reasons that help answer the question related to why more women do not run for public office.

Although there has been some progress in the last few years, we encourage Utah leaders and residents to do more to implement and support these efforts. We also call upon the Utah women to step forward and better serve our communities by adding their important voices to govern and lead Utah and its municipalities and counties. In her introduction of the 1993 book, Women Legislators of Utah, 1896–1993, former Utah Representative Beverly White provided the following advice to Utah women: “We won’t be hypocritical and say it will be easy. It won’t. It takes time, energy, funds and determination to be elected to any political office but if you have resources to give either in education or experience, you should be willing to share them and give to the office you choose your loyalty and dedication. The rewards are further education for you and a satisfaction only you can understand and appreciate and a public that will be well served by the devotion of women who are giving of their time and talents to make this a better world in which to live” (Abbott & White, 1993, p. 3).

References

  • Abbott, D. M., & White, B. J. (1993). Women legislators of Utah, 1896-1993. Salt Lake City, UT: Governor’s Commission for Women and Families.
  • CAWP. (2012, November 7). Record number of women will serve in Congress; New Hampshire elects women to all top posts. Center for America Women and Politics, Eagleton Institute of Politics, Rutgers. Retrieved from http://www.cawp.rutgers.edu/sites/default/files/resources/pressrelease_11-07-12.pdf. Accessed May 3, 2019
  • CAWP. (2016b, December 21). For women in state legislatures and statewide offices, not much change. Center for America Women and Politics, Eagleton Institute of Politics, Rutgers. Retrieved from http://www.cawp.rutgers.edu/sites/default/files/resources/press-release-post-election-stateleg-2016.pdf. Accessed May 5, 2019
  • CAWP. (2016c). History of women governors. Center for America Women and Politics, Eagleton Institute of Politics, Rutgers. Retrieved from http://www.cawp.rutgers.edu/history-women-governors. Accessed May 5, 2019
  • CAWP. (2016e). Women in Elective Office 2019. Center for America Women and Politics, Eagleton Institute of Politics, Rutgers. Retrieved from http://www.cawp.rutgers.edu/women-elective-office-2019. Accessed May 5, 2019
  • CAWP. (2016f). Women in elected office—Utah 2019. Center for America Women and Politics, Eagleton Institute of Politics, Rutgers. Retrieved from http://www.cawp.rutgers.edu/state-by-state. Accessed May 5, 2019
  • CAWP. (2016h). Women in state legislatures 2016. Center for America Women and Politics, Eagleton Institute of Politics, Rutgers. Retrieved from http://www.cawp.rutgers.edu/women-state-legislature-2016. Accessed May 5, 2019
  • CAWP. (2018). Women in state leg 2018. Retrieved from https://cawp.rutgers.edu/women-state-legisla-ture-2018. Accessed May 5, 2019
  • CAWP. (2019). Women in the U.S. Congress 2019. Retrieved from https://cawp.rutgers.edu/women-us-con-gress-2019. Accessed May 3, 2019
  • CAWP. (2019a). Women of Color in Elected Office 2018. Retrieved from https://cawp.rutgers.edu/wom-en-color-elective-office-2018. Accessed May 3, 2019
  • CAWP. (2019b). Women in State Legislatures 2019. Center for America Women and Politics, Eagleton Institute of Politics, Rutgers. Retrieved from https://cawp.rutgers.edu/women-state-legislature-2019. Accessed May 5, 2019
  • CAWP. (n.d.). State fact sheet—Utah. Center for America Women and Politics, Eagleton Institute of Politics, Rutgers. Retrieved from http://www.cawp.rutgers.edu/state_fact_sheets/ut. Accessed May 3, 2019
  • Chu, A., & Posner, C. (2013). The state of women in America: A 50-state analysis of how women are faring across the nation. Center for American Progress. Retrieved from https://www.americanprogress.org/wp-content/uploads/2013/09/StateOfWomen-4.pdf
  • Fairygodboss. (2019). Women governors in the U.S. retrieved from https://fairygodboss.com/career-topics/female-governors. Accessed May 3, 2019
  • Guensburg, C. (2016, May 4). Expanding the political pipeline for women candidates. VOAnews. Retrieved from http://www.voanews.com/a/expanding-the-poltiical-piupeline-for-women-candidates/3330108.html. Accessed May 3, 2019
  • Lawless, J. L., & Fox, R. L. (2004, January). Why don’t women run for office? Taubman Center for Public Policy, Brown University. Retrieved from https://annieslist.com/wp-content/uploads/2013/03/WhyDontWomenRun.pdf. Accessed May 5, 2019
  • Lawless, J. L., & Fox, R. L. (2005). It takes a candidate: Why women don’t run for office. Cambridge, MA: Cambridge University Press. Madsen, S. R. (2008a). On becoming a woman leader: Learning from the experiences of university presidents. San Francisco, CA: Jossey-Bass. Madsen, S. R. (2008b). Developing leadership: Learning from the experiences of women governors. University Press of America.
  • Madsen, S. R. (2015, January). Why do we need more women leaders in Utah? Utah Women & Leadership Project. Retrieved from http://www.uvu.edu/uwlp/docs/uwlpbrief2015no5.pdf. Accessed May 3, 2019
  • Madsen, S. R., & Backus, D. C. (2014, January 8). The status of women in Utah politics. Utah Women & Leadership Project. Retrieved from http://www.uvu.edu/uwlp/docs/uwlp_brief_2014_no._1.pdf. Accessed May 3, 2019
  • National Conference of State Legislatures. (2019). Women in State Legislatures for 2018. Retrieved from http://www.ncsl.org/legislators-staff/legislators/womens-legislative-network/women-in-state-legislatures-for-2018.aspx. Accessed May 5, 2019
  • Ngunjiri, F. W., & Madsen, S. R. (Eds.). (2015). Women as global leaders. Charlotte, NC: Information Age Publishing.
  • Phillips, A. (2016, October 25). Why can’t women just be themselves when they run for office? The Washing-ton Post. Retrieved from https://www.washingtonpost.com/news/powerpost/wp/2016/10/25/why-cant-women-just-be-themselves-when-they-run-for-office/. Accessed May 5, 2019
  • Sanbonmatsu, K., Carroll, S. J., & Walsh, D. (2009). Poised to run: Women’s pathways to the state legislatures. Center for American Women and Politics. Eagleton Institute of Politics, Rutgers. Retrieved from http://www.cawp.rutgers.edu/poised-run-womens-pathways-state-legislatures-0. Accessed May 5, 2019
  • Utah House of Representatives. 2019.). Full Leadership – Utah House. Retrieved from https://house.utah.gov/house-leadership/. Accessed May 5, 2019
  • Utah Senate. (2019). Senate leadership. Retrieved from https://senate.utah.gov/leadership. Accessed May 5, 2019
  • Zenger Folkman. (2012). A study in leadership: Women do it better than men. Retrieved from http://www.zfco.com/media/articles/ZFCo.WP.WomenBetterThanMen.031312.pdf. Accessed May 5, 2019

Citation

Madsen S & Pierucci DC. The Status of Women in Utah Politics: Congress, Statewide Executive Offices, and the State Legislature. Utah Women’s Health Review. doi: 10.26054/0K5FDQ2GQT.

PDF

View/download

The Status of Women in Utah Politics: Counties, Mayors, City Councils, and Boards of Education

Acknowledgement: This manuscript has been adapted from its initial release by the Utah Women & Leadership Project on January 4, 2017, as a Research & Policy Brief titled “The Status of Women in Utah Politics: A 2017 Update” (see http://www.uvu.edu/uwlp/research/briefs.html). This includes only a portion of the data presented in the brief.

Several national reports earlier in the past decade ranked Utah last or near last in terms of women being in positions of decision making and leadership, including a 2013 Center for American Progress report titled “The State of Women in America: A 50-State Analysis of How Women Are Faring Across the Nation” (Chu & Posner, 2013). These and other rankings most often use the following four criteria: 1) gender wage gap, 2) educational attainment, 3) women in management roles, and 4) women serving in state legislatures. Research released through the Utah Women & Leadership Project and the Utah Women & Edu-cation Initiative has also confirmed that Utah has been below the national average in these areas (see http://www.uvu.edu/uwlp/research/briefs.html), although more recently, some improvement has been seen (McCann, 2019).

The lack of women serving in public office in the state of Utah has been troublesome for many reasons, including the negative affect it has had on decision making at all levels of municipality, county, and state governance. Not having equal representation of men and women in elected positions means that our residents are not receiving the representation needed for all voices to be heard. In addition, Utah does not and will not receive the hundreds of benefits research has uncovered related to more diverse and inclusive leadership teams and governance boards (Madsen, 2015). Decisions by local and state elected leaders impact the physical, social, emotional, intellectual, environmental, financial, and even spiritual health of individuals and families who live in Utah.

Because of this, it is important to understand the current status of women in Utah politics, and this report specifically highlights gender data on counties, mayors, city councils, and boards of education. Tracking progress through updated status reports is an important way to help decision makers and other influencers clarify what is working and to determine and refine best steps moving forward. The following sections report on the areas previously outlined by highlighting national data and then comparing it with Utah data. The research methods related to collecting the data have been integrated into each section below.

Counties

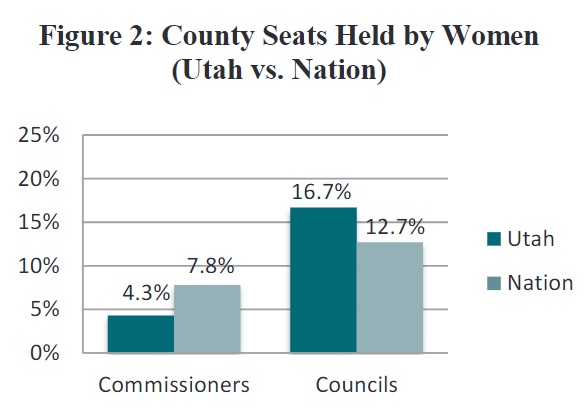
Nation: Despite often being overlooked, county government plays an important role in the lives of individuals and the governing of counties within the state. The National Associations of Counties (NACo) points out that county leadership does in fact matter as counties deal heavily with transportation and infrastructure, community health, criminal justice, and public safety (National Association of Counties, 2015). In addition, county leaders deal with important community issues such as agriculture, workforce development, energy, land use, and education (National Association of Counties, 2019). Working with NACo’s research team, we collected data from a gender study they conducted of county elected officials in 2015. According to NACo, women made up roughly 12.7% of county boards and just 7.8% of county executives. Interestingly, women held 38.2% of elected county row officer seats (e.g., clerk, auditor, treasurer, recorder, assessor, sheriff, controller, district attorney, register of wills, coroner). Overall, in 2015 women made up 24.8% of elected county positions nation-ally (National Association of Counties, n.d.).

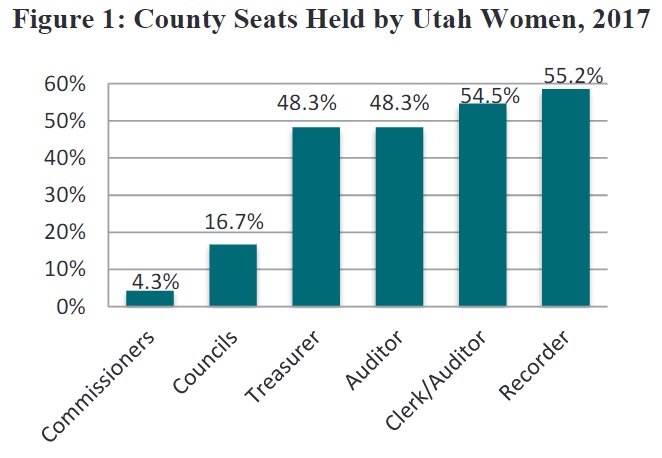
Utah: For Utah, we collected 2016 county data from links listed on the Utah Association of Counties website. We then compared the 2016 database with the lieutenant governor’s online election results site to determine the number of county officials elected in 2016. These results were then verified through contacting county clerks’ offices. Of the 29 counties in the Utah, 23 have elected commissioners, while just six have elected county councils (Cache, Grand, Morgan, Salt Lake, Summit, and Wasatch). In addition, each county elects a clerk/auditor, treasurer, recorder, and assessor. In 2017, of the 69 county commissioners in Utah, 66 (95.7%) were men and three (4.3%) are women, serving in the counties of Beaver, San Juan, and Sanpete. Of the six county councils with a total of 42 seats, 35 (83.3%) council members were men, while seven (16.7%) were women. It is also interesting to note that of the 42 elected county council positions, eight of them are “at-large” positions, representing the entire county; seven (87.5%) of these were held by men, and just one (12.5%) was held by a woman (Salt Lake County).

Additional elected county positions for 2017 revealed that, of the 33 county clerk/auditor seats, 18 (54.5%) were held by women, and 15 (45.5%) by men. There were more than 29 positions, as some counties split the position of clerk and auditor, while most combined the two into one position. The position of county treasurer was split fairly evenly, with 48.3% of seats held by women and 51.7% held by men. Women held 16 of 29 (55.2%) county recorder seats. The position of county auditor was held by 15 men (51.7%) and 14 women (48.3%). We were able to collect county data from both 2016 and 2017 and reviewed the election results to see how many seats were gained and lost. Five seats held by women in 2016 were filled by men in 2017.

Overall, the legislative bodies of county commissions and councils in Utah were overwhelming held by men (91%), while 52.5% of the predominately full-time elected positions of clerk/auditor, treasurer, recorder, and assessor were held by women. See Figure 1 for a summary of county offices held by Utah women in 2017.

Figure 1: County Seats Held by Utah Women, 2017

Compared with the 2015 national data, it may appear that in 2017, Utah was slightly ahead of the national trend, with 31.2% of all county elected official positions held by women, compared to the nation at 27%. However, it is important to note that our data did not include many of the male-dominated positions (e.g., sheriff, attorney), and that most counties in Utah do not have the more male-dominated county row officer seats that are of-ten included in counties across the United States. Hence, it is difficult to compare Utah to the nation accurately.

In 2017, of the 29 counties, only three had exclusively male county elected officials from top to bottom (Davis, Utah, Washington). Twenty-two of the 29 counties had two or more females serving in county elected positions. Yet, of the 23 counties that elect commissioners, just three counties had a female commissioner, and all represented rural areas. Of the six county councils, five had at least one female county council member (Cache, Grand, Morgan, Salt Lake, and Summit), while the Wasatch County Council was all male.

Figure 2: County Seats Held by Women (Utah vs. Nation)

Mayors

Nation: According to the National Foundation for Women Legislators (n.d.), the number of women serving as mayors, on city councils, and as county commissioners is slightly on the rise. In 2019, the percentage of female mayors of cities with a population of at least 30,000 (1,412) increased to 20.9%, an increase since 2016 (when there were 1,391 women mayors) (Center for American Women and Politics [CAWP], 2016 and 2019). Three Utah mayors were included on the 2016 list: Paula Larsen (Kearns), JoAnn B. Seghini (Midvale), and Jackie Biskupski (Salt Lake City). In 2019, 6 Utah mayors are women: incumbents Biskupski and Larsen, along with Michelle Kaufusi (Provo), Dawn Ramsey (South Jordan), Kristie Steadman Overson (Taylorsville), and Debbie Winn (Tooele) (former Mayor Seghini retired in 2018 after more than 30 years in Utah politics). Among the 100 largest cities in the United States, 20 had women mayors (20%) in 2016, which is a slight increase from the number we listed in our 2014 report. It appears that 52 (21.8%) of the 238 U.S. cities with a population over 100,000 had women mayors in 2016 (The United States Conference of Mayors, n.d.). As of March 2019, per the U.S. Conference of Mayors, of the 288 mayors of the U.S. cities with populations 100,000 and over, 59, or 20.5%, were women (CAWP, 2019a).

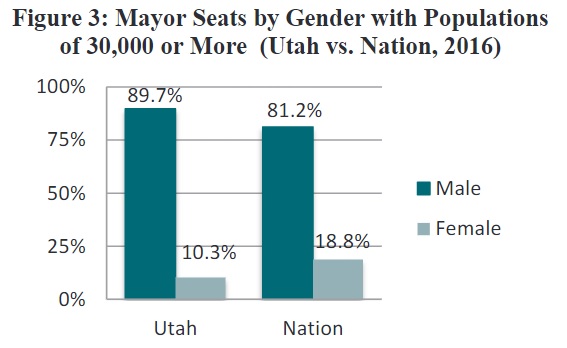
Utah: In 2016, the Utah League of Cities and Towns (NLC) listed 242 municipalities in the state. All but about 30 had websites with mayor information, and calls were made or emails sent to the remaining city or town offices. Of the 242 municipalities studied, 22 had women as mayors (9.1%), reflecting an increase from the 7% we reported in 2014 (Madsen & Backus, 2014). Of those 22 mayors, three represented cities with populations of 30,000 or more; in Utah, 29 cities have populations of that size, which means that 10.3% of mayors of those cities as of 2016 were women. Most female mayors in Utah serve cities with populations of 10,000 or less. See Table 1 with details regarding female mayors by municipality population.

Table 1: Women Mayors in Utah by Municipality Population, 2016

Available national data track the gender of mayors only in cities with populations of 30,000 or more, so Figure 3 represents a national average comparison with Utah in terms of mayoral seats in municipalities with that populace.

Figure 3: Mayor Seats by Gender with Populations of 30,000 or More (Utah vs. Nation, 2016)

City Councils

Nation: Unfortunately, the National League of Cities (NLC) no longer tracks gender data and has not done so for quite some time. However, we were able to find data on the gender balance of city councils of the 15 largest cities in the country for 2016. According to Next City, “men [were] in the majority on all councils studied, though by a relatively small margin in D.C. (where the council is 46 percent female) and in San Diego, Pittsburgh and Detroit (all 44 percent)” (Kinney, para. 8, 2016). Los Angeles had the worst gender imbalance by far with only 7% female members, with San Jose as the second worst at 18% female membership. This article noted that the loss or gain of one female member makes a big difference in percentage. The author found that the overall share of women city council members in these specific cities declined from 33% in 2010 to 30% in 2016 (Kinney, 2016).

In terms of more national historical data on city councils, the NLC reported that representation of women on U.S. city councils increased be-tween 1989 and 2001. They found that the “proportion of women grew from 21 to 25 percent in small cities, 25 to 36 percent in medium-sized cities, and 33 to 36 percent in large cities” (National League of Cities, n.d.). However, between 1979 and 1989, there was actually a drop in gender diversity on city councils from 32% to 26% (NLC, n.d).

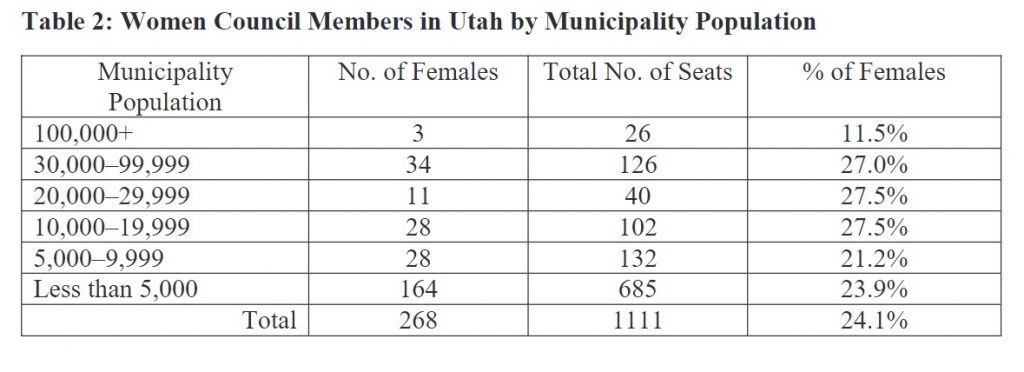
Utah: For Utah, we collected data from every municipality in the state that had a council (N=241). We gathered information from websites, and then emails and calls were made to obtain the data that were not available online. In Utah, 24.1% of city/town council seats were held by women in 2016 (see Table 2 for council member numbers and percentages by municipality population). The four largest cities in Utah had the fewest women represented (11.5%), while all other population ranges had between 21.2% and 27.5% females serving in elected positions.

Table 2: Women Council Members in Utah by Municipality Population

Our analysis showed that as of 2016, there were 58 councils with no women; yet, and there were no clear patterns in terms of population size. One of those councils, West Jordan, is one of the four largest cities in Utah (hence 25% of these municipalities had no women), while four of 25 cities with populations of 30,000–99,999 had no women (16% of them). Two of eight cities (25%) with populations of 20,000–29,999, four of 21 (19%) cities with populations of 10,000–19,999, nine of 27 (33.3%) with populations from 5,000–9,000, and 38 of 156 (24.4%) with less than 5,000 people had councils with no women. It appears that 112 councils in Utah had one woman serving in 2016, while 58 had two women, 12 had three, and only one—Marysvale—had all four seats held by women. Overall, as of 2016 24.1% of all council members in Utah municipalities were female, which put Utah below the national average of data gathered historically in 1979 (32%), 1989 (26%), 2001 (25–36%), and 2016 (30–33%).

Only one town or city in Utah’s history has had an all-female mayor and city council. According to Southern Utah News (2012), “Kanab made history in 1912, when its newly-elected mayor and city council took the oath of office making it the first time in the history of the United States where the town board and mayor were entirely comprised of women.”

Boards of Education

Nation: In January 2014, the National Association of State Boards of Education (2014) provided a list of each state’s board of education membership by gender. It appears that, in 2014, 48.6% of state board members across the country were female. The states with the highest percentages of females at that time were Colorado (85%), South Dakota (78%), Alabama and Nebraska (75%), and Louisiana (72%). The states with the lowest percentages of females on boards of education were Missouri (16.7%), Mississippi (22.2%), and Oklahoma and West Virginia (25%).

Only two sources of national data have report-ed the gender of school district board members historically. First, a 2002 report (Hess, 2002) stated that 38.9% of board seats nationally were held by women at that time, with larger districts having higher percentages than smaller districts. How-ever, a more recent 2010 National School Boards Association study (Hess & Meeks, 2010) reported that 44% of school district board seats across the United States are now held by women. Although a more recent report has not been published, this number has most likely increased since 2010; indeed, as of 2019, the NSBA still reports this percentage (NASB, 2019). The Hess & Meek study also found that male board members dominated in small districts, where men constituted nearly two-thirds of board members, but they made up just under half in large- and medium-sized districts.

Utah: In Utah, eight of 15 (53.3%) State Board of Education elected seats in 2016 were held by women; however, from 2017 to the present, that number has increase to 11 of 15 (73.3%). This is a significant increase from past years and puts Utah as one of the highest states nationally for the percentage of women on a state school board. Currently the Utah State Charter School Board of Education has five of seven (71.4%) seats held by women, but these positions are appointed, not elected.

Utah has 41 school districts throughout the state, and each district has an elected board of education, typically with either five or seven seats. We collected data about these boards via websites, emails, calls, and then followed up by checking the lieutenant governor’s election results website after the 2016 elections (Utah Lieutenant Governor’s Office, n.d.). The 2016 data reflect that, of the 234 total district board of education elected seats in Utah, women held 112 (47.9%). For 2017, the number of women decreased, but only by one (N=111, 47.4%). As of 2019, the Utah school district school boards that have the highest percentages of women include the following: Logan City (100%), Salt Lake City (71.4%), Emery (80%), Grand (80%), Murray (80%), Davis (62.5%), and Granite (71.4%). It does appear that the larger districts have more women, and the districts that have no women are rural; yet, some rural districts do have a strong percentage of women serving, so no pattern emerged.

Overall, Utah is above the national average in terms of the percentage of women serving on the state board of education (73.3% vs. about 50%) and is at least average, if not slightly above, for women holding district board seats.

Moving the Needle

National statistics have shown that women win elections at the same rate as men, but that fewer actually run (Real Women Run, n.d.). The bot-tom line is that women will not get elected unless they run for office—if their names are not on the ballot, they cannot get votes. Dr. Jennifer Lawless, Director of the American University’s Women and Politics Institute, stated in a USA Today article that “the issue isn’t that [women] don’t have the credentials or the background anymore. The issue is that that’s not sufficient to get them to run for office” (Moore, 2013, para. 10). She explained that, according to studies, there are still just not enough women running for office. This phenomenon was confirmed again in a 2016 article published in The New York Times, titled, “The Problem for Women Is Not Winning. It’s Deciding to Run” (Miller, 2016). This is true both nationally and in Utah; it remains one of many key challenges related to why Utah does not have more women serving in elected public office.

The section that follows will first focus on what Utahns can do to prepare more girls and young women to run for office later in life and then pro-vide ideas for more immediate solutions. In terms of what Utahans can do to prepare more girls and young women to run for office, we have three suggestions. First, all children and youth can be taught to be involved in their communities, and they can learn that it is a civic responsibility to serve in the community in various ways, including running for public office. The importance of community and civic engagement can be discussed and modeled in various settings throughout a person’s lifespan. Second, we must help girls and women understand the importance of running for office, provide them with experiences that will increase their aspirations to do so, offer quality networking and mentorships, and create developmental opportunities that will help them see themselves as being able to positively influence people and policy. Finally, girls, teens, and women can attend events and gatherings around the state (see, for example, http://www.uvu.edu/uwlp for statewide listings and leadership summer camps for girls) that help them become aware of the issues and that can also help strengthen the confidence, aspirations, ambitions, and motivations to lead. In addition, those in positions of influence (e.g., parents and relatives; school teachers, counselors, and administrators; political, business, and religious leaders; and college and university administrators, faculty, and staff) are encouraged to attend events as well so that they can more effectively encourage, develop, and strengthen girls and women toward leadership.

Initial findings and national studies have shown that certain types of shorter-term efforts can also result in more women running for elected office and winning these elections. First, Utah women can be actively engaged in their local precincts by attending their caucus meetings and running for delegate positions. Both major parties in the state operate on a caucus system, and even with the passage of SB 54 (enabling candidates to go the petition route), running as a state delegate can provide women with opportunities to participate in the local, state, and national levels of politics. This may provide them with opportunities to interact with other like-minded individuals, run on a lower scale for an elected position, and network with influential elected leaders in the state. Caucus dates and times are posted on both the Republican and Democratic State Party websites. In addition, women can also determine the issues and causes they are most passionate about. Becoming an advocate for these issues can build leadership and networking, and it can also compel women to do more.

Second, Utah women—whether they are interested in running for office or not—can attend Real Women Run (RWR) trainings and events to learn about becoming more civically engaged. RWR is a “collaborative nonpartisan initiative to empower women to participate fully in public life and civic leadership through elected political office at all levels, appointments to boards and commissions, participation in campaigns, and engagement in the political system” (Real Women Run, n.d.).

Third, women who are interested in running for elected office at the city, county, state, or national level can also join a cohort in the Women’s Leadership Institute’s Political Development Series. This six-month interactive and instructive program teaches women the how and why of running for public office (Women’s Leadership Institute, n.d.).

Fourth, female college students can join training and development programs that provide them with tools to be more engaged in running for student body offices on their own campuses. One such program is Running Start (n.d.), which is a daylong workshop on why and how to run for public office—starting with student government. This national program, through a nonpartisan project, partners with universities around the county to host these on campuses.

Fifth, those in leadership positions can strategically recruit more women for these roles. In addition, since the majority of Utah women who run and win do so through the Democratic Party, we call on local and state Republican leaders and politicians to carefully analyze the practices, processes, culture, and opportunities that, through unconscious bias, may be preventing women from running, winning, and serving. We also call on Republican women to step forward and lead in their party as well. However, progress can be made in strengthening the impact that women can have for the state of Utah through all political parties.

This article has summarized available research on the status of women in Utah politics in Utah counties, cities (mayors and councils), and with boards of education. It was written to provide a more detailed look at the past and current state of affairs and should be beneficial as a benchmark for measuring improvement in years to come. It was also written as a call to action for Utah residents and leaders to do more to encourage and support future efforts to diversify voices on Utah’s Capitol Hill and in cities and counties around the state. Although there has been some progress in the last few years, we encourage Utah leaders and residents to do more to implement and support these efforts. We also call upon Utah women to step forward and better serve our communities by adding their important voices to govern and lead Utah and its municipalities and counties.

References

  • Center for America Women and Politics. (2016). Women mayors in U.S. cities 2016. Rutgers Eagleton Institute of Politics. Retrieved from http://www.cawp.rutgers.edu/levels_of_office/women-mayors-us-cities-2016. Accessed May 6, 2019
  • Center for America Women and Politics. (2019). Women mayors in U.S. cities 2019. Rutgers Eagleton Institute of Politics. Retrieved from http://www.cawp.rutgers.edu/levels_of_office/women-mayors-us-cities-2019. Accessed May 6, 2019
  • Center for America Women and Politics. (2019a). Women in elective office 2019. Retrieved from https://www.cawp.rutgers.edu/women-elective-office-2019. Accessed May 6, 2019
  • Chu, A., & Posner, C. (2013). The state of women in America: A 50-state analysis of how women are faring across the nation. Center for American Progress. Retrieved from https://www.americanprogress.org/wp-content/up-loads/2013/09/StateOfWomen-4.pdf. Accessed May 6, 2019
  • Hess, F. M. (2002). School boards at the dawn the 21st century: Conditions and challenges of district governance. National School Boards Association. Retrieved from https://eric.ed.gov/?id=ED469432. Accessed May 6, 2019
  • Hess, F. M., & Meeks, O. (2010). School boards circa 2010: Governance in the accountability era. National School Boards Association. Retrieved from https://www.nsba.org/sites/default/files/SBcirca2010_WEB.pdf. Accessed May 6, 2019
  • Kinney, J. (2016, February 2). How 15 city councils rate on gender balance. Next City. Retrieved from https://nextcity.org/daily/entry/us-city-councils-women-members. Accessed May 6, 2019
  • Madsen, S. R. (2015, January). Why do we need more women leaders in Utah? Utah Women & Leadership Project. Retrieved from http://www.uvu.edu/uwlp/docs/uwlpbrief2015no5.pdf. Accessed May 6, 2019
  • Madsen, S. R., & Backus, D. C. (2014, January 8). The status of women in Utah politics. Retrieved from http://www.uvu.edu/uwlp/docs/uwlp_brief_2014_no._1.pdf. Accessed May 6, 2019
  • McCann, A. (2019). Best & Worst States for Women’s Equality. WalletHub. Retrieved from https://wallethub.com/edu/best-and-worst-states-for-women-equality/5835/. Accessed May 6, 2019
  • Miller, C. C. (2016, October 25). The problem for women is not winning. It’s deciding to run. The New York Times. Retrieved from http://nyti.ms/2eAeF4s. Accessed May 6, 2019
  • Moore, M. T. (2013, September 19). Women still struggling to win big-city mayoral jobs. USA Today. Retrieved from http://www.usatoday.com/story/news/politics/2013/09/18/women-mayor-quinn-greuel-richie/2833261/. Accessed May 6, 2019
  • National Association of Counties. (2019). 2019 policy briefs. Retrieved from https://www.naco.org/advocacy/2019-policy-briefs. Accessed May 6, 2019
  • National Association of Counties. (n.d.). Data obtained directly from that NACo Research team. National Association of Counties. (2015). Transportation and infrastructure. Retrieved from http://www.naco.org/counties-matter#transportation-infrastructure. Accessed May 6, 2019
  • National School Boards Association. (2019). Frequently Asked Questions about School Boards and Public Education: What do we know about school board members? Retrieved from https://www.nsba.org/about-us/frequently-asked-questions. Accessed May 6, 2019
  • National Association of State Boards of Education. (2014, January). State boards of education data [Data file]. National Foundation for Women Legislators. (n.d.). Retrieved from http://www.womenlegislators.org/. Accessed May 6, 2019
  • National League of Cities. (n.d.). City councils. Retrieved from http://www.nlc.org/build-skills-and-networks/resources/cities-101/city-officials/city-councils. Accessed May 6, 2019
  • Real Women Run. (n.d.). About. Retrieved from https://realwomenrundotorg.wordpress.com/about/. Accessed May 6, 2019
  • Running Start. (n.d.). Homepage. Retrieved from http://runningstartonline.org/. Accessed May 6, 2019
  • Southern Utah News. (2012, January 11). Kanab celebrates 100 Year Anniversary of nation’s first all-woman city council. Retrieved from http://www.sunews.net/article.cfm?articleID=1019. Accessed May 6, 2019
  • The United States Conference of Mayors. (n.d.). 2016 final mayoral election results. Retrieved from http://legacy.usmayors.org/elections/displayelections2016.asp. Accessed May 6, 2019
  • Utah Lieutenant Governor’s Office. (n.d.). Utah election results. Retrieved from https://electionresults.utah.gov/elections/. Accessed May 6, 2019
  • Women’s Leadership Institute. (n.d.). WLI political development series. Retrieved from http://wliut.com/political-development-series/. Accessed May 6, 2019

Citation

Madsen S & Pierucci DC. The Status of Women in Utah Politics: Counties, Mayors, City Councils, and Boards of Education. Utah Women’s Health Review. doi: 10.26054/0KPXT3PPNM.

PDF

View/download

Labor Force Participation Among Utah Women

Susan R. Madsen, Robbyn T. Scribner / Utah Valley University

Acknowledgement: This manuscript has been adapted from its initial release by the Utah Women & Leadership Project on December 2, 2016, as Research Snapshot No. 5: Labor Force Participation Among Utah Women (see http://www.uvu.edu/uwlp/research/briefs.html).

Over the past half-century or so, Utah women’s participation in the labor force has steadily increased at a rate of about 8% per decade (Utah Women & Leadership Project, 2019). According to the most recent (2017) U.S. Census Bureau estimates, women in Utah make up 45% of the state workforce, which is slightly lower than the U.S. women’s share of the national workforce, 47.8% (United States Census Bureau, 2017a). In general, Utah women are about as likely to be employed as U.S. women, but Utah women are less likely to work full-time year-round (Department of Work-force Services, 2014). Numerous factors influence Utah women’s experiences in the labor force, including such barriers to successful employment such as trouble accessing affordable childcare and occupational segregation in lower-paying industries. Since solid employment is a key aspect of financial health, as well as a contributor to intellectual and social well-being, understanding labor force issues is critical. This research snapshot focuses on three key areas:

  1. An overview of Utah women’s labor force participation, broken down by demographics,
  2. An exploration of the industries and occupations in which Utah women are most likely to work, and
  3. A discussion of ways to increase Utah women’s success in the labor force.

Demographics

A recent American Community Survey estimates that for people ages 16–65, 74.0% of Utah women worked during the previous 12 months, a slightly higher rate as compared to U.S. women (72.7%) (United States Census Bureau, 2017a). Estimates for the same time period give different numbers for the specific category of Utah women “in the labor force,” which includes those who are unemployed but looking for work, though with those data as well Utah women’s rates are higher than the national average (60.9% vs. 58.3%) (United States Census Bureau, 2017b). However, Utah women were less likely than U.S. women to work full-time, year-round: 36.7% vs. 43.5%. Utah women are also considerably less likely to work than Utah men: 87.9% of Utah men had worked in the previous 12 months, and 62.6% of them had worked full-time, year-round (United States Census Bureau, 2017a). A recent report ranked Utah first in the nation for the percentage of employed women who worked part-time (40.2% vs. the national average of 29.4%) (Institute for Women’s Policy Research (IWPR, 2013).

Various factors play a role in determining Utah women’s likelihood to participate in the labor force. For example, age significantly impacts women’s employment rates. In both the United States and Utah, younger women are very likely to be in the labor force. According to 2017 U.S. Census Bureau estimates, Utah women participate in the labor force at a higher rate than the national average in their late teens and early 20s. Beginning at age 25, however, the national average for women’s labor force participation becomes higher than Utah women’s participation rate and remains higher through age 59. Utah women’s labor force participation drops considerably below the national average from ages 25–45, the years when many women are having children. After age 45 the labor force participation rate for Utah women jumps up to levels near the national average. See Table 1 for more detail (United State Census Data, 2017c).

Table 1: Percentage of Women in the Labor Force by Age

Table 1: Percentage of Women in the Labor Force by Age
Source: U.S. Census Bureau, 2013-2017 American Community Survey 5- Year Estimates

Marital status is another telling factor when it comes to Utah women’s employment. Married women in the state are less likely to be in the labor force than married women in the national average, but Utah women who are not currently married are more likely to be in the labor force than the aver-age U.S. woman. Specific labor force participation rates are as follows: 57.1% of Utah married women (vs. 59.4% U.S.), 70.5% of Utah women who have never been married (vs. 66.5% U.S.), 72.7% of Utah women who are separated (vs. 66.2% U.S.), 67.8% of Utah women who are divorced (vs. 63.3% U.S.), and 21.2% of Utah women who are widowed (vs. 18.2% U.S.) (United States Census Bureau, 2017d).

Utah women’s labor force participation also varies by ethnicity: a recent report showed that 65.5% of Black women, 64.5% of Hispanic women, 64.6% of women who identified as “other” or two or more races, 60.7% of Asian women, 58.5% of White women, and 54.5% of Native American women are in the labor force (IWPR, 2018).

Although a majority of Utah mothers do participate in the labor force, Utah mothers of young children are less likely to be employed than U.S. mothers. 2012 U.S. Census Bureau estimates show that 61% of Utah mothers with children under age 6 work (vs. 70% U.S.), 51% of Utah mothers with children under age 6 and children ages 6–17 work (vs. 64% U.S.), 73% of Utah mothers whose children are all between the ages of 6–17 work (vs. 77% U.S.), and 76% percent of Utah mothers with no children under age 18 work (this is higher than the national average of 73%) (Langston, 2014). Utah ranks last in the nation for children with both parents in the labor force: 52%, well below the national average of 65% (Langston, 2014). Utah also has the largest gap in the nation between fathers’ and mothers’ participation in the labor force, at 42.7% (IWPR, 2015b).

Women’s labor force participation rates also vary somewhat according to where they live in Utah. A recent report stated that the counties with the highest female labor force participation are Summit (65.3%), Salt Lake (64.8%), Grand (64.7%), and Beaver (62.9%); the counties with the lowest rates are Washington (49.8%), Duchesne (49.3%), Piute (49.0%), and Daggett (45.0%) (Langston, 2014).

Occupational Segregation

One key aspect of understanding the female labor force in Utah is occupational segregation—the phenomenon of women holding a high percentage of jobs in certain industries as well as specific positions within those industries. Utah Department of Workforce Services Economist Lecia Langston has noted that large-scale occupational changes by gender were slow in coming. Specifically, she has observed that “detailed occupations where Utah women comprise at least 90 percent of employment include several healthcare-related occupations: occupational therapy assistants, medical transcriptionists, dental hygienists, dental assistants, dieticians/nutritionists and medical assistants. Utah females also account for more than 90 percent of employment in two occupations which relate to the care of younger children—preschool/kindergarten teachers and childcare workers. Other occupations showing 90-percent or more female employment include cosmetologists, other personal care workers, teacher assistants, tailors, billing clerks and proofreaders. This roster closely mirrors the 2000 Census list of occupations with 90-percent or greater female employment” (Langston, 2014a). 

Utah women still make up a high percentage of all workers in certain occupations, many of which require relatively lower skills and receive lower pay. According to 2017 U.S. Census Bureau estimates, the three areas in which Utah women are mostly highly segregated are healthcare support occupations (79.3% of workers are women), personal care and service occupations (78.7%), and health technologists and technicians (75.4%) (United States Census Bureau, 2017e). The median incomes for all workers in these three occupational areas are, respectively, as follows: $21,703, $12,369, and $27,499. The median income for each of these three female-dominated professions is below average for all professions in the state ($32,986) (United States Census Bureau, 2017f). In contrast, the occupations in which the lowest percentage of jobs are held by women are construction and extraction occupations (2.2%); installation, maintenance, and repair occupations (2.3%); and law enforcement workers including supervisors (11.7%) (United State Census Bureau, 2017e). The median earnings for all workers in these three male-dominated occupational areas are, respectively, as follows: $36,259, $44,131, and $52,521, all above the median income for all professions in the state (United States Census Bureau, 2017f).  Not only do Utah women make up high percent-ages of workers in certain occupations, but a large number of all Utah working women are segregated in a few specific (and lower-paying) jobs. More than 40% of Utah women work in just two occupational groups: office and administrative support, where 24.0% of employed Utah women work; and service occupations, where 18.8% of them work (Hess & Williams, 2014). Both of these groups of jobs have median wages below the state average (United States Census Bureau, 2017f). Utah men, on the other hand, are more likely than Utah women to be concentrated in higher-paying industries and job types (Hess & Williams, 2014).

Increasing Utah Women’s Employment Success

Public entities, corporations, and individual women can make efforts to increase women’s success in the Utah labor force. Working women in the state face various challenges; for example, parents may have difficulty finding quality childcare, which is cost-prohibitive for many families in Utah, as it is in the rest of the nation (Economic Policy Institute, 2016). This dilemma is amplified in Utah, as we tend to have more children than the national average (Hard @ Work, 2014). Interestingly, a recent study ranked Utah 50th in the country in its “Childcare Index,” which ordered states by the relative costs of infant care, the proportion of four-year-olds in publicly funded Pre-K programs, and the policies in place to promote quality Pre-K care (IWPR, 2019). Another barrier specific to low-income women’s employment success is the “cliff effect,” wherein women who have been receiving public benefits risk losing this support as they become eligible for promotions or raises at work, and the loss of public benefits occurs faster than rising incomes replace their value (The Women’s Foundation of Colorado, n.d.). Various groups and policy makers are working to address these types of issues legislatively.

Utahns could also benefit from increased sup-port for women entrepreneurs. Census estimates from 2012 show only 30.3% of firms in Utah are owned by women (compared to 35.8% nationally), and sales by women-owned businesses in Utah make up only a very small share of total sales by all firms (United States Census Bureau QuickFacts, n.d.; Langston Hard @ Work).

Corporations in the state can also do much to improve employment success for women who choose to or need to work. For example, the Women’s Leadership Institute has invited companies statewide (both public and private) to participate in the ElevateHER Challenge, which has among its stated goals to increase the percentage of women in senior leadership positions and on boards, to retain women at all organizational levels, and to close gender pay gaps (https://wliut.com/elevate-her-challenge/). In addition, all organizations in the state would do well to reevaluate their systems and processes regarding employee recruitment, hiring, development, and promotion to ensure they have diverse and inclusive work environments that offer flexibility and maximum potential for employee success. Finally, individual Utah women, schools, universities, and other stakeholders can work to close the education gap between genders in the state. Utah women are less likely than U.S. women to work in jobs that require higher education. As more women in Utah earn at least bachelor’s degrees, specifically in high-paying, growth industries, they will have more choices and opportunities for successful employment (Department of Workforce Services, 2014). Additionally, some women might benefit from exploring training and certification in fields that are traditionally male-dominated yet may lead to careers that are relatively high-paying and flexible.

Women in Utah make up a significant proportion of the overall labor force in the state, but many are employed in low-paying jobs that have limited room for advancement. For many Utah women, the majority of whom work for pay, training for and securing successful employment can be crucial in order to ensure financial health; solid employment also affects other aspects related to overall quality of life. Finding ways to improve various factors for Utah women in the labor force will not only better their lives but also strengthen the positive impact of women in communities and the state as a whole.

References

  • Economic Policy Institute. (2016). The cost of childcare in Utah. Retrieved from http://www.epi.org/child-care-costs-in-the-united-states/#/UT. Accessed May 2, 2019
  • Hess, C., & Williams, C. (2014, May). The well-being of women in Utah: An overview. Institute for Women’s Policy Research. #R379. Retrieved from https://iwpr.org/publications/the-well-being-of-women-in-utah-an-over-view/. Accessed May 2, 2019
  • Institute for Women’s Policy Research (IWPR). (2013 data). Status of women in the states: Employment and earnings. Table B2.6. Retrieved from http://statusofwomendata.org/explore-the-data/employment-and-earnings/employment-and-earnings/#PartTimeWork%20. Accessed May 2, 2019
  • IWPR. (2018). The status of women in Utah. Fact Sheet, IWPR #R525. Retrieved from https://statusofwomen-data.org/wp-content/themes/witsfull/factsheets/economics/factsheet-utah.pdf. Accessed May 3, 2019
  • IWPR. (2019). Status of women in the states: Work and family. Retrieved from http://statusofwomendata.org/explore-the-data/work-family/. Accessed May 2, 2019
  • Langston, L. P. (2014) Hard @ work: Women in the Utah labor force. Utah Department of Workforce Services. Retrieved from https://jobs.utah.gov/edo/womeneconomy/utahwomen.pdf. Accessed May 2, 2019
  • Langston, L. P. (2014a). What’s My Line? The Occupations of Utah Women. Retrieved from http://econo-myutah.blogspot.com/2014/01/whats-my-line-occupations-of-utah-women.html. Accessed May 3, 2019
  • Langston, L. P. (2010c, July/August). What’s the truth about Utah women in the labor force? Trendlines. Utah Department of Workforce Services. Retrieved from http://jobs.utah.gov/wi/pubs/trendlines/julaug10/whatshap-pening.pdf
  • United States Census Bureau. (2017a). Sex by full-time work status in the past 12 months for the population 16 to 64 years. K202302. U.S. and Utah. American Community Survey. Retrieved from https://factfinder.census.gov/bkmk/table/1.0/en/ACS/17_SPL/K202302/0100000US|0400000US49 Accessed May 8, 2019
  • United States Census Bureau (2017b) Selected Population Profile in the United States. S0201. U.S. and Utah. American Community Survey 1-Year Estimates. Retrieved from https://factfinder.census.gov/bkmk/table/1.0/en/ACS/17_SPL/K202302/0100000US|0400000US49 Accessed May 8, 2019
  • United States Census Bureau. (2017c). Sex by age by employment status for the population 16 years and over. B23001. U.S. and Utah. 2013-2017 American Community Survey 5-Year Estimates. Retrieved from https://factfind-er.census.gov/bkmk/table/1.0/en/ACS/17_SPL/K202302/0100000US|0400000US49 Accessed May 8, 2019
  • United States Census Bureau. (2017d). Marital status by sex by labor force participation. B12006. U.S. and Utah. 2013-2017 American Community Survey 5-Year Estimates. Retrieved from https://factfinder.census.gov/bkmk/table/1.0/en/ACS/17_SPL/K202302/0100000US|0400000US49 Accessed May 8, 2019
  • United States Census Bureau. (2017e). Occupation by sex for the civilian employed population 16 years and over. S2401. U.S. and Utah. American Fact Finder. Retrieved from https://factfinder.census.gov/bkmk/table/1.0/en/ACS/17_SPL/K202302/0100000US|0400000US49 Accessed May 8, 2019
  • United States Census Bureau. (2017f). Occupation by sex and median earnings in the past 12 months (in 2017 inflation-adjusted dollars) for the civilian employed population 16 years and over. S2411. Amer-ican Fact Finder. Utah. Retrieved from https://factfinder.census.gov/bkmk/table/1.0/en/ACS/17_SPL/K202302/0100000US|0400000US49 Accessed May 9, 2019
  • United States Census Bureau. (n.d.). QuickFacts. Utah; United States. Retrieved from https://www.census.gov/quickfacts/fact/table/ut,US/AGE295217. Accessed May 2, 2019
  • Utah Women & Leadership Project. (2019). Labor Force Participation Among Utah Women. Retrieved from http://www.utahwomenandleadership.org/labor-force-participation-among-utah-women/. Accessed May 1, 2019
  • Women’s Foundation of Colorado, The. (n.d.) What is the “cliff effect?” Retrieved from http://www.wfco.org/document.doc?id=520. Accessed May 2, 2019

Citation

Madsen SR & Scribner RT. (2019). Labor Force Participation Among Utah Women. Utah Women’s Health Review. doi: 10.26054/0K4TDRE9TQ.

PDF

View/download

The Utah Women’s Health Review | May 2019