Older women are more at risk of experiencing depression than older men. Each year, approximately, 6 million adults, 65 years of age and older [1], suffer from depression, and only ten percent receive treatment for the condition (See figure 1) [2]. In the Diagnostic and Statistical Manual of Mental Disorders-IV-TR, the criteria for mental health professionals to diagnosis severe depression or a Major Depressive Episode in an individual includes: “five (or more) of following symptoms have been present during the same 2-week period and represent a change from previous functioning;
depressed mood most of the day…
markedly diminished interest or pleasure in all, or almost all, activities most of the day…
significant weight loss or weight gain when not dieting, or decrease or increase in appetite…
insomnia or hypersomnia…
psychomotor agitation or retardation…
fatigue or loss of energy…
feelings of worthlessness or excessive or inappropriate guilt…
diminished ability to think or concentrate, or indecisiveness…
recurrent thoughts of death, recurrent suicidal ideation…
For this diasgnosis, the individual needs to experience the above symptoms nearly everyday [3].
Figure 1. Depression and Treatment of American Adults 65 Years and Older. Source: Geriatric Mental Health Foundation
Utah Data
In a 2002-2003 Utah Behavioral Risk Factor Surveillance System Survey, 11.0% of Utah women ages 65-74 reported experiencing seven or more poor mental health days in the past month compared to 3.5% of Utah men in the same age group. This percentage is comparable to the national average for women in this age group, at 11.5%, but is less than the national average for men, at 6.2%. As shown in Figure 2, the same trend applies for older age groups (Figure 2) [4].
Figure 2. Percentage of Older Adult Who Reported Poor Mental Health. Source: Utah Department of Health.
Risk Factors
Depression in later life often co-exists with other physical disabilities and illnesses, such as diabetes, stroke, heart disease, and cancer [5]. Psychological, emotional, and physical consequences of depression can be extremely damaging and potentially life threatening to older women who suffer from it. Further symptoms often include back pain, muscle aches, joint pain, chest pain, headaches, fatigue, sleeping problems, changes in appetite or weight [6], persistent sadness, excessive crying, hopelessness, helplessness, and thoughts of death or suicide, or suicide attempts [7].
Services
Depression is a treatable condition, which is highly responsive to treatment. For further information on depression contact your family doctor.
References
Geriatric Mental Health Foundation: Late Life Depression Factsheet. Available online at http://www.gmhfonline.org/gmhf/consumer/factsheets/depression_factsheet.html. Accessed November 8, 2006.
Mental Health: Helpguide. Available online at http://www.helpguide.org/mental/depression_elderly.htm. Accessed November 12, 2006.
American Psychiatric Association: Diagnostic and Statistical Manual of Mental Disorders, Fourth Edition, Text Revision. Washington, DC: American Psychiatric Association, 2000.
Utah Department of Health: Aging and Health in Utah Implications for Public Health. Available online at http://health.utah.gov/bhp/Aging_Report_April05.pdf. Accessed November 12, 2006.
National Institute of Mental Heath: Older Adults and Mental Health. Available online at http://www.nimh.nih.gov/healthinformation/depoldermenu.cfm. Accessed November 5, 2006.
WebMD: Recognizing the Symptoms of Depression. Available online at http://www.webmd.com/content/article/106/108345.htm. Accessed November 1, 2006.
National Institute of Mental Heath: Depression. Available online at http://www.nimh.nih.gov/publicat/nimhdepression.pdf. Accessed October 29, 2006.
Past research has focused on women’s mental health disorders being related primarily to childbirth. Postpartum depression research continues with new information constantly emerging; however, information is now available to show that women may suffer mental health issues as a result of many different contributing factors and disproportionately suffer from a variety of mental health disorders, including depression, anxiety, phobias and post-traumatic stress disorder (PTSD).
Scientists have discovered a connection between various biological and psychosocial factors to mental health and mental illness in both women and men, and are finding that mental health issues affect women differently than men. For example, women have depression more often than men, and are depressed in different ways. (See figure 1). Research shows that before adolescence and late in life, females and males experience depression at about the same frequency. Because the gender difference in depression is not seen until after puberty and decreases after menopause, scientists hypothesize that hormonal factors are involved in women’s greater vulnerability. Women also are more likely to be the victim of a violent crime such as rape and domestic abuse, which in turn increases the likelihood of mental health issues.
Common Mental Health Disorders
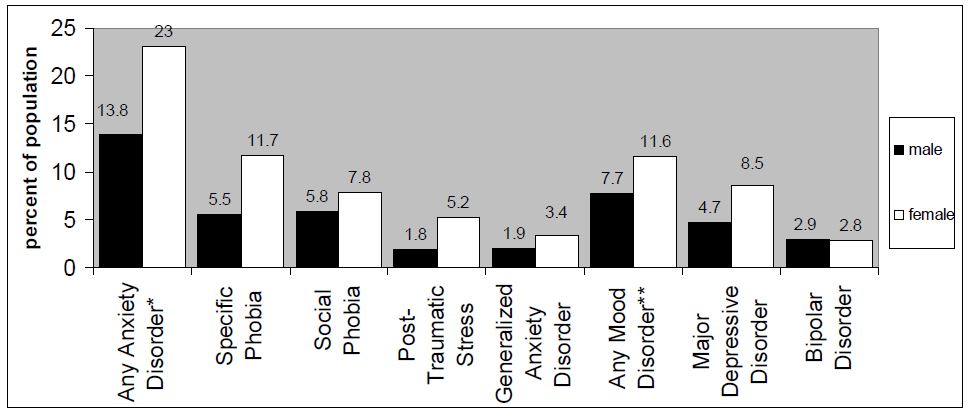
Figure 1. Mental Disorders Among Adults Aged 18 and Older by Sex 2001-2003. Source: National Comorbidity Survey Replication (NCS-R)
*Anxiety disorders include panic disorder, phobias, obsessive-compulsive disorder, and generalized anxiety disorder. **Mood disorders include major depressive disorder, bipolar disorders, and dysthymia.
Women and men may suffer from the same types of mental disorders; however, as previously stated, women suffer from depression and anxiety at a higher rate than men. In addition, women are more likely to be victims of intentional injury crimes, which contribute to the higher incidence of depression and anxiety specifically anxiety related to PTSD.
Research completed by the U.S. Department of Health and Human Services Health Resources and Services Administration in 2003 found that 23% of women had experienced an anxiety disorder during the past year, compared to 14% of men. The most common anxiety disorders experienced by women include specific phobias, social phobia, PTSD and generalized anxiety disorder (GAD).
More than 17 million Americans experience depression every year. Over half are women. In fact, women experience depression twice as often as men and they often experience it earlier, longer, and more severely. Higher rates of depression in women may be linked to biological and social differences. The same research found that mood disorders, such as depressive disorder and bipolar disorder are also more common among women than men. The study found that 11.6% of women experienced a mood disorder as opposed to 7.7% of men.
Women are more likely than men to experience depression in association with other conditions such as eating disorders, anxiety, and stress. On the other hand, men tend to have depression associated with alcoholism, antisocial behaviors, obsessive-compulsive personalities, and self-centered behaviors. A study completed by the U.S. Department of Health and Human Services, Health Resources and Services Administration in 2003 found that nearly one-quarter of new mothers suffer mild depression, 9.7% show moderate and 6.5% show symptoms of severe depression.
Women’s Mental Health in Utah
Data from the Utah’s Health Status Survey in 2004 indicated that 22% of Utah women report below average mental health. In 2005 20% of the women queried indicated that for 7 or more of the past 30 days their mental health had not been good. Data from 2004 indicated that 16% of women queried about general mental functioning felt that they accomplish less.
Low general mental functioning suggests feelings of depression, despair, anxiety, etc. When looking specifically at issues related to depression and focusing on maternal depression the numbers bear out. For example, postpartum depression affects more women in their reproductive years than does gestational diabetes (2.2%), pregnancy associated hypertension (5.6%), and even preterm birth (9.5%), yet it receives much less detection, treatment and research.
In Utah, a quarter of all women who delivered a live birth reported feeling moderately depressed, very depressed, or very depressed and had to get help during 2000-2002. (See figure 2). Utah’s prevalence of postpartum depression is higher than what much of the literature indicates (25% compared to 10-20%). In a recent analysis of PRAMS data, the Centers for Disease Control and Prevention (CDC) discovered that 62% of Utah women who delivered a live birth during 2000 reported low to moderate levels of depression. Utah ranked highest among the six states compared. These data are of tremendous concern to those working in maternal and child health because of the health implications that they may have for women and their infants throughout the state.
Figure 2. Utah Women Who Report Postpartum Depression 2000-2001. Source: Utah PRAMS Data Book 2000-2001, Utah Department of Health, Division of Community and Family Health Services Maternal and Child Health Bureau, Reproductive Health Program. January, 2005.
Summary
Mental disorders in women are increasing at an alarming rate. An understanding of the common mental health issues, their symptoms and recommended treatment is imperative. Mental illness is a very treatable disorder. The evidence for treatment being more effective than placebo is overwhelming. The degree of effectiveness tends to vary, depending on the disorder and the target population. Recovery is variously called a process, an outlook, a vision, and a guiding principle. There is neither a single agreed-upon definition of recovery nor a single way to measure it. But the overarching message is that hope and restoration of a meaningful life are possible, despite serious mental illness.
References
About Women’s Health, The New York Times Company, 2006 at: http://womenshealth.about.com/library/blppd.htm
American Psychiatric Association , Healthy Minds, 2006 at: http://healthyminds.org/expertopinion10.cfm
National Institute of Mental Health, Women and Mental Health at: http://www.nimh.nih.gov/healthinformation/depwomen.cfm
U.S. Department of Health and Human Services, Women’s Mental Health, 2006 at: http://www.4women.gov/mh/
U.S. Department of Health and Human Services, Substance Abuse and Mental Health Services Administration, Mental Health Topics,
Women, Violence and Trauma, 2006 at: http://mentalhealth.samhsa.gov/topics/explore/womenandtrauma/
U.S. Department of Health and Human Services, Health Resources and Services Administration. Women’s Health USA 2006. Rockville, Maryland: U.S. Department of Health and Human Services, 2006. This publication is available online at www.hrsa.gov/womenshealth
Utah Department of Health, Division of Community and Family Health Services, Maternal and Child Health Bureau, Reproductive Health Program. Utah PRAMS Data Book 2000-2001, January, 2005.
World Health Organization, Gender and Women’s Mental Health, 2006 at: http://www.who.int/mental_health/prevention/
The literature indicates that 10-20% of women suffer from postpartum depression (PPD) after childbirth. The onset of PPD usually occurs within twelve weeks after delivery; if it is not detected early and is left untreated symptoms can last 1-2 years [1,2].
There are a variety of interventions available to treat PPD, such as education, support, therapy and medication [3]. However, these interventions are disappointingly underused. The Healthy People’s 2010 goal is to increase the percentage of adults with recognized depression who receive treatment to 50% (current measure 23%). This objective (18-9b) is not limited to women experiencing postpartum depression, but certainly includes them.
Risk Factors
PPD is a debilitating illness that affects women of all types. However, higher rates of PPD are reported among women who:
Have low education
Are of race other than white
Are unmarried
Are on Medicaid
Have a lower socioeconomic status
Have an unintended pregnancy
Experience abuse
Experience significant life stressors
Have a history of depression
Utah Data
Utah PRAMS 2004 data (Pregnancy Risk Assessment Monitoring System) indicates that 14.7% of Utah women who delivered a live birth reported PPD. A quarter (25.5% N~ 1666) of women with less than high school education reported PPD, compared to 8.5% (N~1109) of women who completed college. (See figure 1).
Figure 1. Percentage of Women Who Reported Postpartum Depression, by Maternal Education– Utah PRAMS 2004
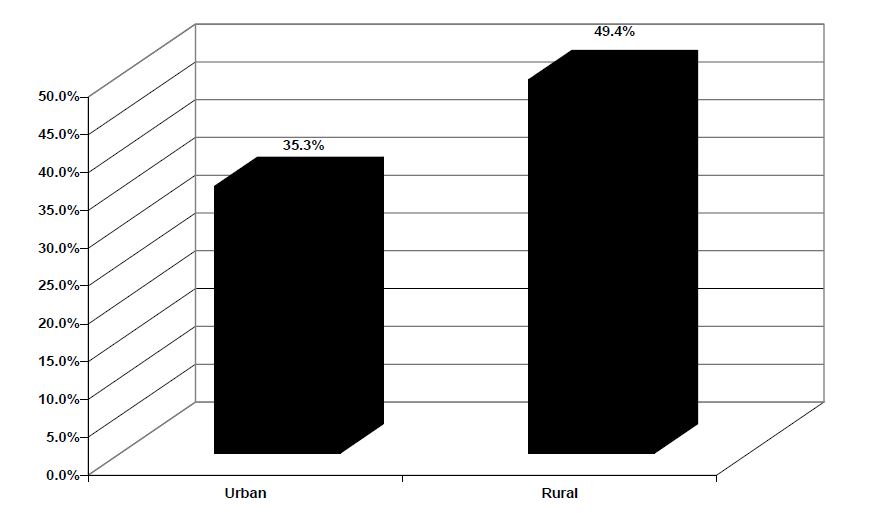
Of the women who reported PPD, 39.5% reported seeking help for the depression. Women who had a history of seeking help for depression during pregnancy were the most likely to seek help postpartum (72.8% vs. 24.9%). Surprisingly, women who lived in rural communities also had higher rates of seeking help for their depression (49.4% vs. 35.3%). (See figure 2).
Figure 2. Among Women Who Reported Postpartum Depression, The Percentage of Women Who Sought Help, by Urban/Rural Residency– Utah PRAMS 2004
Services
Maternal and Child Health Library: A virtual guide to MCH information Knowledge Path: Postpartum Depression: mchlibrary.info/KnowledgePaths/kp_postpartum.html
The Macarthur Initiative on Depression and Primary Care at Dartmouth & Duke: www.depression-primarycare.org/.
References
Horowitz, J. A., Goodman, J. (2004) A Longitudinal Study of Maternal Postpartum Depression Symptoms. Research and Theory for Nursing Practice: An International Journal, 18 (2/3), 149-163.
Postpartum Depression. The National Women’s Health Information Center. Project of the U.S. Department of Health and Human Services, Office of Women’s Health. Retrieved from http://www.4woman.gov/faq/postpartum.htm on October 25, 2006.
Genovese, Alisa. Thoughts and Essays: A Guide to Postpartum Emotional Difficulties Common Questions. Retrieved from http://www.supportgroupformothers.com/thoughts8.htm on October 25, 2006.
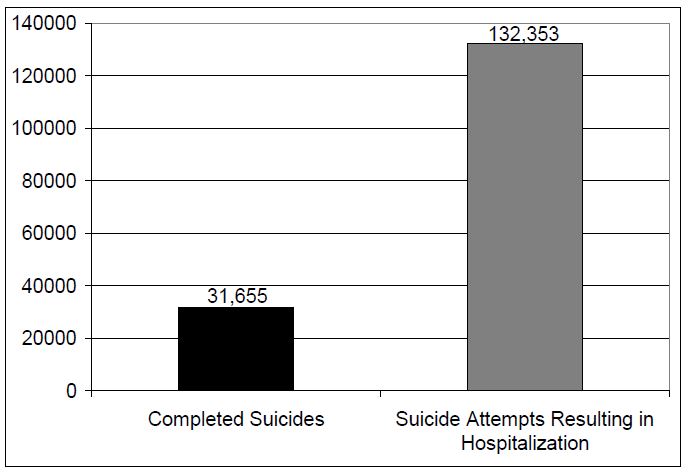
Suicide is an unfortunate and potentially preventable public health issue. Men complete suicide with four times the frequency of women, but women attempt suicide three times more often than men [1]. In 2002, 31,655 U.S. adults completed suicide [1], and 132,353 were hospitalized for attempting suicide (See figure 1) [2].
Utah Data
Suicide is the leading cause of death in Utah. In 2001, it ranked as the second cause of death for persons aged 10-34 years and the primary cause of death for those 35-44 years [3]. The Utah Department of Health Violence and Injury Prevention Program (VIPP) reports from 1999-2003 Utah had the 8th highest suicide rate in the United States [3]. Suicide rates are higher in Utah when compared to the national suicide rates among all age groups. In Utah, the rate of suicide is 13.74 per 100,000 which is higher than the national rate of 10.66 per 100,000 [4]. Additionally, the Department of Health indicates that from 1999-2003, Utah men completed suicide fives times more frequently than Utah women with 1,563 men completing suicide compared to 293 women (see figure 2) [4].
The Utah Department of Health VIPP reports that the men’s most commonly used method to complete suicide in Utah is the use of a firearm at 64%; whereas, the most commonly used method used by women is poisoning at 39%.
Figure 1. Attempted and Completed Suicides in the United States. Source: National Center for Injury Prevention and Control Suicide.
Risk Factors
Common risk factors that increase the likelihood that an adult will attempt or complete suicide include a prior suicide attempt, depression, substance abuse, recent death of a loved one, financial loss, serious physical illness, perception of poor health, changes in social roles, hopelessness, and isolation [3]. Further, common protective factors that mitigate the possibility of suicide among adults include limited access to firearms, family and community support, clinical services for mental and physical health, religious and cultural beliefs that reject suicide, and skills in problem solving and conflict resolution [3].
Figure 2. Number of Utah Men and Women that Completed Suicide from 1999-2003. Source: Utah Department of Health.
The psychological and emotional consequences of depression can be extremely damaging and potentially life threatening to the women and men who suffer from it. Each year, approximately, two-thirds of suicides are related to a major depression episode. Also, persons who are depressed are 50% more likely to attempt/complete suicide than those who are not [5].
Services
If you or someone you love is contemplating suicide, contact the National Suicide Prevention Lifeline at 1-800-273-8255. For immediate help dial 9-1-1.
References
American Association of Suicidology: Suicide in the U.S.A. Available online at http://www.suicidology.org/associations/1045/files/SuicideInTheUS.pdf. Accessed December 6, 2006.
National Center for Injury Prevention and Control Suicide: Factsheet. Available online at http://www.cdc.gov/ncipc/factsheets/suifacts.htm. Accessed December 2, 2006.
Utah Department of Health. Violence and Injury Prevention Program: Suicide. Available online at http://health.utah.gov/vipp/pdf/suicide_2006.pdf. Accessed December 9, 2006.
Utah Department of Health. Violence and Injury Prevention Program: Suicide. Available online at http://health.utah.gov/vipp/suicide/index.html. Accessed December 3, 2006.
American Association of Suicidology: Facts about Suicide and Depression. Available online at http://www.suicidology.org/associations/1045/files/Depression.pdf. Accessed December 5, 2006.
The frequency of women completing suicide generally declines after the age of 60.1 However, older adults have the highest frequency of completed suicides in the United States [2]. In 2001, 5,393 adults 65 years and older completed suicide, with 85% of them men, and 15% of them women (See figure 1) [3]. Further, older adults encompass 12.4% in the United States population, but account for 16.7% of all completed suicides [1].
Older adults generally use extremely lethal methods to complete suicide. Firearms are the most commonly used method. Older men use firearms to complete suicide approximately twice as often as older women with 73% for men compared to 34% for women. Additional commonly used methods include hanging and poisoning [1].
Utah and U.S. Data
Elderly white males have the highest risk of completing suicide with an average of 32 suicides per 100,000 each year [1]. Further, 85% of suicides among older adults are completed by men, which is 5.5 times greater than suicides completed by elderly women [1]. Comparably, in Utah men aged 55 and older were seven times more likely to complete suicide than women [2].
Figure 1. Suicide Among Older Adults by Gender. Source: National Center for Injury Prevention and Control.
In 2003, the suicide rate in Utah for persons aged 55 and older was approximately 20.1 per 100,000 and for those 85 and older the rate was 22.7 per 100,000. Further, across all age groups, Utah’s suicide rate is the tenth highest in the nation [2].
Risk Factors
Common risk factors that increase the likelihood than an older adult will complete suicide include social isolation, recent death of a loved one, serious physical illness, perception of poor health, and changes in social roles [1]. Further, common protective factors that mitigate the possibility of suicide among the elderly include family and community support, clinical treatment for mental and physical health, religious and cultural beliefs that reject suicide, and skills in problem solving and conflict resolution [2].
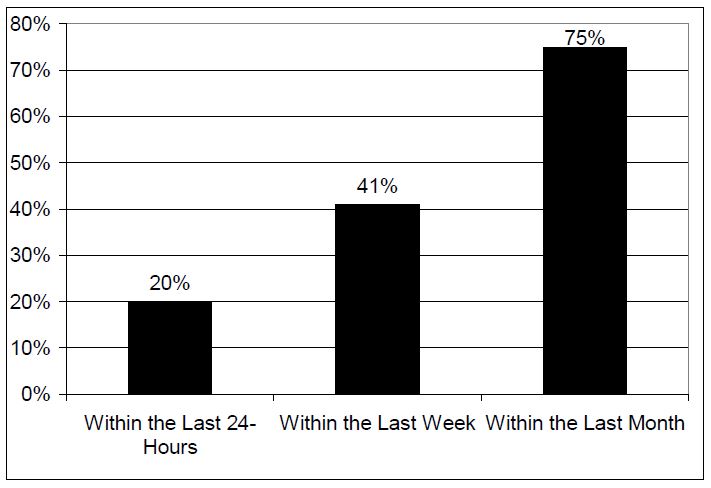
Figure 2. Percentage of Older Adults that Visited a Physician Prior to Completing Suicide. Source: American Psychological Association Online.
The psychological and emotional consequences of depression can be extremely damaging and potentially life threatening to the older women and men who suffer from it. One of the primary causes of suicide among older adults is depression that goes undiagnosed and/or without treatment. Persons diagnosed with a major depressive disorder are 50% more likely to complete suicide than the general population [4].
Additionally, approximately 20% of older adults that complete suicide had an appointment with a physician within the prior 24 hours of the incident, 41% had a visit within the last week, and 75% within the last month (See figure 2) [5].
Services
If you or someone you love is contemplating suicide, contact the National Suicide Prevention Lifeline at 1-800-273-8255. For immediate help dial 9-1-1.
References
American Association of Suicidology. Elderly Suicide: Factsheet. Available online at http://www.suicidology.org/associations/1045/files/Elderly.pdf. Accessed November 23, 2006.
Utah Department of Health: Aging and Health in Utah Implications for Public Health. Available online at http://health.utah.gov/bhp/Aging_Report_April05.pdf. Accessed November 30, 2006.
National Center for Injury Prevention and Control. Suicide: Fact Sheet Available online at http://www.cdc.gov/ncipc/factsheets/suifacts.htm. Accessed December 2, 2006.
Institute on Aging: Suicide and the Elderly. Available online at http://www.gioa.org/programs/cesp/sfacts.html. Accessed November 14, 2006.
American Psychological Association Online: Facts about Suicide in Older Adults. Available online at http://www.apa.org/ppo/issues/oldersuicidefact.html. Accessed December 31, 2006.
Women, Incarceration and Serious Mental Illness in Utah State Prison System
Women with Mental Illness and the Growth of the U.S. Prison Population
In the United States, there are two distinct groups that constitute the fastest growing element of the incarcerated population: women and persons with mental illness. The U.S. Bureau of Justice Statistics (BJS) reported that in 2005, 95,096 women were incarcerated in state prisons, compared to 82,058 in 2001 and 57,263 in 1994 [1]. Recent years have seen a similar rise in number of persons with mental illness incarcerated in U.S. state prisons. At present, more than 700,000 people with mental health problems live in state prisons, or 56% of the entire U.S. state prison population [2]. Women in State prisons have higher rates of mental health issues compared with male prisoners, with 73% of the female state prisoner population expressing symptoms of mental disorder, compared to 55% of the male population [2].
Further, in 1999 the BJS reported the highest frequency of mental illness among white women in State prison. In State facilities, approximately, 29% of white women, 22% of Hispanic women, and 20% of African American women were categorized as mentally ill [3]. This brief report highlights this intersection by describing the mental health, offense and recidivism status of incarcerated women with serious mental illness (SMI) in the UT State prison system. In addition to citing statistics published at the national and state levels, we also report on pilot data and preliminary findings of our ongoing study of recidivism, serious mental illness and prison and community-based treatment in Utah State prisoners released from prison 1998-2002 [4].
Women in Utah Prisons: Rates of Incarceration and Demographics
In 2004, Utah ranked 35th in its female incarceration rate, with 42 female inmates per 100,000 female residents [5]. In 2006, 570 women were housed in Utah State Prison compared with 30 women in 1977 [5]. Women now comprise 9% of the Utah prison population, a higher ratio than the U.S. average of 7% [1]. As of May 2006, women of minority status represented slightly over 2% of the overall Utah prison population, with the following distribution by racial and ethnic category: Asian/Pacific Islander, 0.18%; African American, 0.48%; Native American/Alaskan Native, 0.27%. White women currently represent 7% of the total prisoner population in the Utah State system [4].
Women with Mental Illness in Utah State Prison 1998-2002. Descriptive Statistics Related to Demographics and Incarceration Patterns 1998-1999
The descriptive statistics reported in this and the next section were generated from a sub-sample of women identified as seriously mentally ill (SMI) 6 who were released from Utah State Prison 1998-1999 (N = 246).
Of these women, 226 were identified as White (92%), 11 as African American (4.5 %), 1 as Asian (0.4%), 1 as Pacific Islander (0.4%), and 5 as Alaskan Native (3.3 %). Fourteen percent of this sub-sample was identified as Hispanic, while 86% were not. The average and median age of first incarceration in state prison for women with SMI was 30 years of age, with a range from 17 to 61. However, the most frequent age of first incarceration in our sample was 24 (20 women or 8.2%) and the next most frequent was 31 (6.9%) with 33 (6.5%) and 34 (6.1%) close behind. This highlights the interesting point that the frequency distribution for age of first incarceration had a distinct bimodal pattern, with age of first admission clustering in the mid-twenties and the early to mid-thirties (Figure 1). The average and most frequent number of total prison admissions through 12/31/2002 for this sample was 3 (26%) with a range of 1 (18%) to 9 (0.4%) admissions.
Psychiatric Diagnoses and Symptoms
In addition to collecting data related to demographics, incarceration patterns and recidivism, we also collected data related to psychiatric diagnoses, symptoms and treatment for women with SMI in our 1998-1999 sub-sample. Sixty percent of women prisoners with SMI were screened for mental illness as part of the prison admission process while 40% were not. Of those screened, 9% were flagged as positive for mental illness requiring follow-up evaluation. Further, 98% of those who received follow-up clinical evaluation were diagnosed as mentally ill. By far, the most common DSM-IV psychiatric diagnosis of these women is Major Depressive Disorder, with 144 or 59% of women in our sample having this diagnosis recorded in their prison medical charts. The second most common psychiatric diagnosis in this sample was Bipolar Disorder (55 women or 22%). Finally, individual chart reviews for all women with SMI showed that in 44% of charts, staff had recorded significant symptoms of serious mental illness such as mania, hallucinations, delusions, disorganization, self-isolation, poor hygiene and compulsive behaviors.
Recidivism Rates for Women Parolees with a Mental Illness
Overall, recidivism rates for both women and men are higher in Utah than the national average, due in part to stricter and more intensive monitoring of parolees than might be practicable in states with larger offender populations. Our larger study sample includes all persons released from Utah State Prison 1998-2002, and identifies those who meet study criteria for SMI [6]. In our sample of Utah State prisoners, 87% of women with SMI and 84% of men with SMI are released to parole, so our initial analyses of recidivism have focused on parolees. For 1998-2002, the average percentage of men and women with SMI who returned to prison within 36 months of release was 77%, compared with 62% for non-SMI men and women. Analyzing the women’s data separately, we found that 72% of women with SMI released from Utah State Prison between 1998 and 2002 returned within 36 months, nearly one and a half times the percentage for women without SMI (49%).
Primary Offense of Conviction: Alcohol and/or Drug Related and Violent Offenses
Across the U.S., the crimes for which women are primarily incarcerated are alcohol and drug-related offenses. BJS states that in 2000, 1 in 3 women were imprisoned for a drug-related crime and roughly 50% of women imprisoned in State prisons were under the influence of drugs or alcohol at the time of their offense [7]. A Utah Commission on Criminal and Juvenile Justice Study (CCJJ) reported in 2006 found that 62.5% of Utah women are incarcerated for a drug- related offense, and 77.6% of women committed their crime while under the influence of alcohol or drugs [7].
When examining the data related to primary offense for our sample of women prisoners with SMI released from Utah State prison, we found the following: For the five year period 1998-2002, the average percentage of women parolees with both SMI and an alcohol and drug related primary offense was 56%, compared with 63% for women parolees without SMI, 29% for men parolees with SMI, and 38% for men parolees without SMI. Thus percentages of alcohol and/or drug related primary offenses are high for both SMI and non-SMI women when compared with the male population. During 1998-2002, the average percentage of women parolees with SMI and violent offenses [8] was 11%, compared with 8% for women without SMI. The difference in percentages of women parolees both with and without SMI who committed violent offenses is notable, when compared with male parolees, with average percentages of 32% (SMI) and 28% (non-SMI), respectively. Data related to primary offense are summarized in Table 1.
Figure 1. Age of First Incarceration in Utah State Prison for Women with SMI 1998-1999.
Table 1: Percentages of Parolees with Alcohol/Drug and Violent Primary Offenses.
References
Bureau of Justice Statistics Bulletin: Prisoners in 2005. Available online at http://www.ojp.usdoj.gov/bjs/pub/pdf/p05.pdf. Accessed January 25, 2007.
Bureau of Justice Statistics Special Report: Mental Health Problems of Prison and Jail Inmates 2006. Available online at http://www.ojp.usdoj.gov/bjs/pub/pdf/mhppji.pdf. Accessed December 27, 2006.
Bureau of Justice Statistics Special Report: Mental Health and Treatment of Inmates and Probationers 1999. Available online at http://www.ojp.usdoj.gov/bjs/pub/pdf/mhtip.pdf. Accessed January 2, 2007.
The research study described here is supported by funding from the Utah Commission on Criminal and Juvenile Justice, the University of Utah Research Committee (Faculty Research Seed Grant) and the University of Utah College of Nursing Research Committee.
Institute on Women and Criminal Justice: Hard Hit: The Growth in the Imprisonment of Women, 1977-2004. Available online at http://www.saferfoundation.org/docs/HardHitReport4.pdf. Accessed December 31, 2006.
Cloyes et al. Assessment of Psychosocial Impairment in a Supermaximum Security Unit Sample. Crim Just and Behav 2006: 33(6): 760- 81. For details on how the published algorithm for SMI was adapted and applied in this study, contact Dr. Cloyes.
Utah Commission on Criminal and Juvenile Justice: A Survey of Women Inmates in Utah. Available online at http://www.justice.utah.gov/Research/Adult/ExCell%20Survey.pdf. Accessed December 20, 2006.
In calculating the percentages of women and men with and without SMI with violent primary offense, we included the offense categories of murder, person and first and second degree felony, registerable sex offenses.
The relationship between race and low birth weight (LBW) is complex and a growing perinatal concern throughout the U.S. and in Utah for parents, health care professionals, health care systems, educators, and legislators. LBW disproportionately affects certain races/ethnicities, especially non-Hispanic blacks and Asian/Pacific Islanders. Barriers to information and care for minority populations include financial, language/cultural, and geographic. Certain characteristics of Utah’s population place it a greater risk for a higher incidence of LBW: rapidly increasing racial minority populations especially Asian/Pacific Islanders, young and rapidly increasing general population, a high birth rate, a few densely populated urban areas with easily accessible assisted reproductive technology, and large expanses of rural/frontier areas with few health care providers. LBW births account for 10% of all U.S. health care costs related to children. Providing education, health care and child care to children of LBW from infancy to age 15 costs the U.S. $5.5 to 6 billion annually. (1) When compared to normal weight infants, health care costs in Utah are 6 times higher for LBW babies weighing and almost 85 times higher for Very Low Birth Weight (infants weighing less than 1500 grams – VLBW) infants. (2)
LBW, babies weighing less than 2500 grams, includes babies born before 37 weeks (preterm or premature – 60% of all LBW babies) and small babies born at term (small for gestation age – SGA and intrauterine growth retardation – IUGR). LBW infants can belong to one or both groups and face unique potential complications.
Healthy People (HP) 2010 objectives and goals specifically address reducing the incidence of LBW and preterm births. The U.S. HP 2010 goal is to reduce LBW to no more than 5% of live births and VLBW to no more than 0.9% of live births. (3) Utah is failing to meet the HP 2010 goals.
Risk Factors
Racial minority groups are more likely to have conditions that are associated with LBW. These include late entry into prenatal care, history of a previous LBW baby, lower income, lower education level, higher incidence of teen pregnancy, smoking, low maternal weight gain, short inter-pregnancy interval, and maternal and fetal medical conditions. Other risk factors include multiple births (twins, triplets, etc.), maternal age of over 40, and assisted reproductive technologies for infertility problems. Some of the maternal medical conditions associated with LBW are high blood pressure, infections, uterine anomalies, placental insufficiency, and cardiac, kidney, or lung problems. Fetal conditions include defects from genetic or environmental causes.
Utah Data: How are we doing? The overall incidence of LBW and the rates in certain racial groups continues to rise nationally and in Utah. Between 1981 and 2003, the rates of premature births and LBW in the U.S. and in Utah increased. (4)
Since 1989, the actual number of all LBW babies born in Utah dramatically increased from 2,015 in 1989 to 3,520 in 2005 (6.83% of all live births). (5)
The incidence of LBW in Utah’s growing racial minority population is consistently higher than Utah’s white population over the last four years. (6)
Summary
National, state, and local entities are attempting to address the issues that surround LBW. Local organizations, such as the Utah March of Dimes and certain provider groups, are attempting to increase access to prenatal care.
Departments within the Utah State government produce educational materials for providers and women to prevent LBW, conduct perinatal morbidity and mortality reviews, provide limited prenatal care funding through the Baby Your Baby Program (BYB), provide supplemental food and nutritional education through the Women, Infants, and Children (WIC) Program, and collect birth certificate and Pregnancy Risk Assessment Monitoring System (PRAMS) data to guide interventions. After failing to meet the HP 2000 goals, the Utah State Department of Health (UDOH) addressed the rising incidence of LBW in its Report on Low Birth Weight in Utah in 1999. Almost all of the challenges identified in this report remain the challenges in 2007.
References
Lewit, E., Baker, L., Corman, H., & Shiono, P. 1995. The direct cost of low birth weight, Future Child, 5:35-56.
Utah Department of Health. (2006). Retrieved November 16, 2006, from http://ibis.health.utah.gov/.
U.S. Department of Health and Human Services (2000). Healthy People 2010.Washington, D.C.
March of Dimes Birth Defects Foundation, (November, 2006). Babies Born too Soon. Retrieved December 17, 2006 from http://www.marchofdimes.com/peristats.
Complied by Sara Ellis Simonsen, RN, MSPH, and Michael Varner, MD
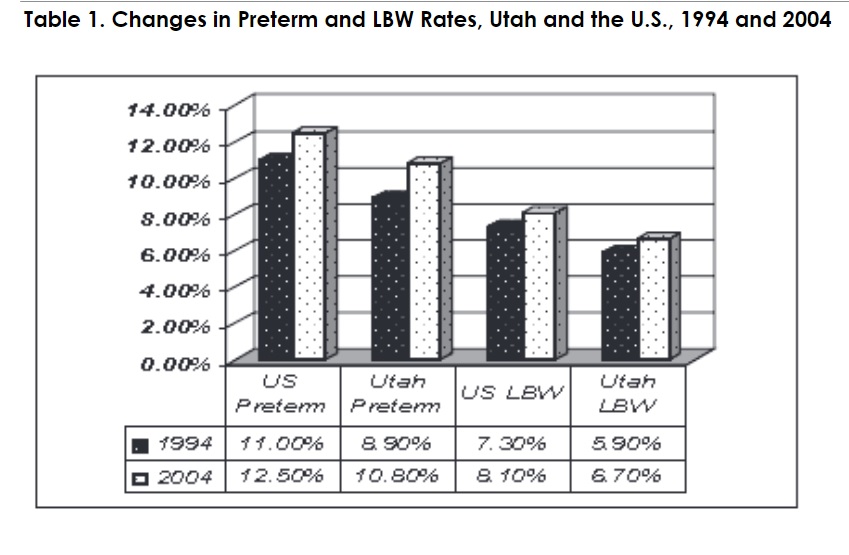
Preterm birth, defined as the birth of an infant at less than 37 completed weeks of gestation, is a serious public health problem in Utah and the United States. Infants born prematurely are at increased risk for morbidity and mortality when compared to infants born at term. Neonatal and infant mortality rates increase proportionally with decreasing gestational age, and preterm birth is the leading cause of infant mortality in the United States for non-anomalous liveborns. In Utah, approximately 80% of neonatal deaths occur in premature infants.
Preterm births are on the rise in both Utah and the United States, as illustrated by data in Figure 1. In Utah, preterm birth occurs less frequently than in the United States.
Healthy People 2010’s goal regarding preterm birth is that no more than 7.6% of deliveries should occur prior to 37 weeks gestation; in Utah, 10.8% of live births were preterm in 2004, as compared to 8.9% in 1994. Thus, the preterm birth rate increased by 21.3% in Utah between 1994 and 2004. More importantly, when accounting for the increasing number of overall deliveries each year in Utah (38,271 in 1994 and 50,653 in 2004), the number of babies born prematurely increased by 60.9% during the same interval.
Risk factors for preterm birth include maternal health status, obstetric and family history, gynecologic health, multiple gestations, low pre-pregnancy weight/BMI, preeclampsia, presence of a birth defect, maternal tobacco, alcohol, and drug use, minority race/ethnicity, low socioeconomic status, chronic stress, young/advanced maternal age, marital status, and occupational and environmental exposures. In Utah, preterm birth occurs most frequently among African American and American Indian/Alaskan Native women. The proportion of preterm births occurring in Utah African American women is 44% greater than the proportion occurring in Utah Caucasian women, a finding consistent with national statistics (see Figure 2). Teenage mothers and women with advanced maternal age are also at increased risk for preterm birth (see Figure 3). Data for Figures 2 and 3 is from the Utah Department of Health’s Indicator Based Information System for Public Health Birth Query Module.
The complications associated with preterm birth cost billions of dollars in direct costs and unrealized potential each year in the United States alone. The economic burden associated with preterm birth in 2005 was $26.2 billion, with an average cost of $51,600 per premature infant. These figures do not include long-term burdens or lost potential. Prevention of preterm birth is imperative if we are to reach the Healthy People 2010 goal. Risk factors for preterm birth that are most likely to be impacted by public health interventions include inadequate prenatal care, smoking, drug and alcohol use, inadequate weight gain, and poor diet.
References
March of Dimes. Ten Leading Causes of Infant Mortality. Available online at http://www.marchofdimes.com/aboutus/1529.asp. Accessed July 20, 2006.
National Center for Health Statistics. Preliminary Births for 2004: Infant and Maternal Health. Available online at http://www.cdc.gov/nchs/products/pubs/pubd/hestats/prelimbirths04/prelimbirths04health.htm. Accessed July 20, 2006.
U.S. Department of Health and Human Services. Office of Disease Prevention and Health Promotion. Healthy People 2010. Available online at: http://www.health.gov/healthypeople/. Accessed July 20, 2006.
Utah Department of Health. IBIS-PH Birth Query Module. Available online at http://ibis.health.utah.gov/query/module/selection/ birth/BirthSelection.html. Accessed December 12, 2006.
March of Dimes. Peristats. Available online at http://www.marchofdimes.com/peristats/. Accessed December 12, 2006. 6. Institute of Medicine. Preterm Birth: Causes, Consequences and Prevention. 2006. The National Academies Press, Washington D.C. Available at: http://www.nap.edu/catalog/11622.html. Accessed July 20, 2006.
Women who receive early and consistent prenatal care (PNC) enhance their likelihood of giving birth to a healthy child. Health care providers recommend that women begin prenatal care in the first trimester of their pregnancy. Healthy People 2010 Objective 16.6a: Prenatal care beginning in first trimester U.S. Target for 2010: 90% Utah Target for 2010: 90%
Risk Factors
Pregnant teens 15-19 years of age have a number of risk factors including:
low level of education
race other than White
Hispanic ethnicity
being unmarried
lower socio-economic status
lack of health insurance
smoking or drinking prior to pregnancy
unintended pregnancy
Women who recognize their pregnancy later than nine weeks of gestation are less likely to get early prenatal care. Lack of health insurance affects both the timing and frequency of prenatal care visits, resulting in poor pregnancy outcomes such as premature birth, low birth weight, and complicated delivery. Availability of family planning services is another system factor that reduces the risk of unintended pregnancy. If a pregnancy is planned, a woman is more likely to seek early and adequate prenatal care.
Utah data vs. U.S. How are we doing
The Utah rate had been consistent for the last few years and in 2005 the rate increased slightly. The Utah rate in 2005 (78.8%) was below that of the nation (83.9%).
Services/Hotlines
The Utah Department of Health Baby Your Baby Program sponsors a statewide media campaign and provides information and referral services to pregnant women in Utah. The Baby Your Baby toll-free hotline can be reached by dialing 1-800-826-9662. The hotline is open weekdays from 8:00 a.m. to 5:00 p.m. Its operators can provide information, referrals, assistance in finding financial aid and access to community health care services. A pregnancy risk line is available to pregnant women. The Pregnancy Risk Assessment Monitoring System (PRAMS) collects and analyzes data to identify characteristics of Utah women and their utilization of prenatal care.
Prenatal Care Retrieved on 1/18/07 from Utah Department of Health, Center for Health Data, Indicator-Based Information System for Public Health website: http://ibis.health.utah.gov/
Studies show that obese pregnant women are at increased risk for gestational diabetes, preeclampsia, eclampsia, cesarean section, macrosomia, instrumental delivery, fetal distress, antepartum stillbirth, and early neonatal death[1, 2]. Obese women have been found to have longer labor, are more likely to have inadequate contraction patterns during labor, and are more likely to receive labor induction and augmentation [3].
Utah Data
Healthy People 2010 goal 19-2 is to decrease the proportion of adults who are obese to 15 percent. Utah Vital records data indicate that in 2005, 14.5% of women with a live birth were obese before becoming pregnant, an increase of 30% since 1994. Utah is very close to exceeding the Healthy People goal among its pregnant women.
Risk Factors
An analysis of Utah PRAMS data found that women who were obese prior to pregnancy were more likely to be older, of a race other than white, multiparous, and living at a lower poverty level. The analysis also found that obese Utah women were at increased risk of developing diabetes or hypertension, delivering a macrosomic infant, having labor induced, having their infant admitted to the newborn intensive care unit, and reporting postpartum depression [4]. Vital Records data show that the highest rates of obesity in pregnant women are among the Pacific Islander and Native American women.
Services
As weight loss is not recommended during pregnancy, weight issues should be addressed with women before they become pregnant. Body Mass Index should become a recorded measure on patient charts and reproductive aged women who have high weights should be counseled about achieving a healthy weight before pregnancy and their risks during pregnancy if they are at an unhealthy weight. Intermountain Health Care has published guidelines on the medical management of obesity; the document is available online at: https://kr.ihc.com/ext/Dcmnt?ncid=520199293
References
Baeten, J.M., Bukusi, E.A., and Lambe, M.: Pregnancy complications and outcomes among overweight and obese nulliparous women. Am J Public Health 91:436-40 (2001).
Cedergren, M.I.: Maternal morbid obesity and the risk of adverse pregnancy outcome. Obstet Gynecol 103:219-24(2004).
Vahratian, A., et al.: Maternal prepregnancy overweight and obesity and the pattern of labor progression in term nulliparous women. Obstet Gynecol 104:943-51(2004).
Baksh, L., et al.: Maternal prepregnancy body mass index and pregnancy outcomes in Utah. PRAMS Perspectives, 2005.
Vital Records data retrieved on 1/12/2007 from Utah Department of Health, Center for Health Data, Indicator Based Information System for Public Health website: http://ibis.health.utah.gov.