
Table of Contents
Abstract
Substance use and abuse is a factor of great concern to health care stakeholders. The objective of this study was to characterize pharmaceutical prescription utilization among female compared to male Utah Medicaid patients.
- Analgesics, SSRIsa, anticonvulsants, and gastric acid secretion reducers were the drug classes with the highest fill rates among female patients covered by Medicaid in Utah
- The majority of patients used multiple prescription drugs throughout the study period
- The drug class with the highest cost was the antipsychotics, which had a per-patient cost for female patients at only 40% of that for male patients
- Contrary to what was expected based on previous research, the overall per-patient prescription drug cost was not higher among females versus males
- There were differences in drug utilization between age groups; most drug classes showed increasing utilization and cost with increasing age
Background and Introduction
Substance abuse has been formulated as one of the leading health indicators in the Healthy People 2010 framework (U.S. Department of Health and Human Services, 2000). Differences in prescription medication use patterns between males and females have been documented by Roe, et al in a retrospective database analysis of 1,294,295 members of a large pharmacy benefit manager (Roe, McNamara, & Motheral, 2002). Investigators found that compared to men in the United States women generally utilize more medications. This finding has also been demonstrated worldwide (Obermeyer et al., 2004). Our goal was to evaluate the status of drug usage by women and compare it to that of the men in the Utah Medicaid prescription claims database.
Study Procedures
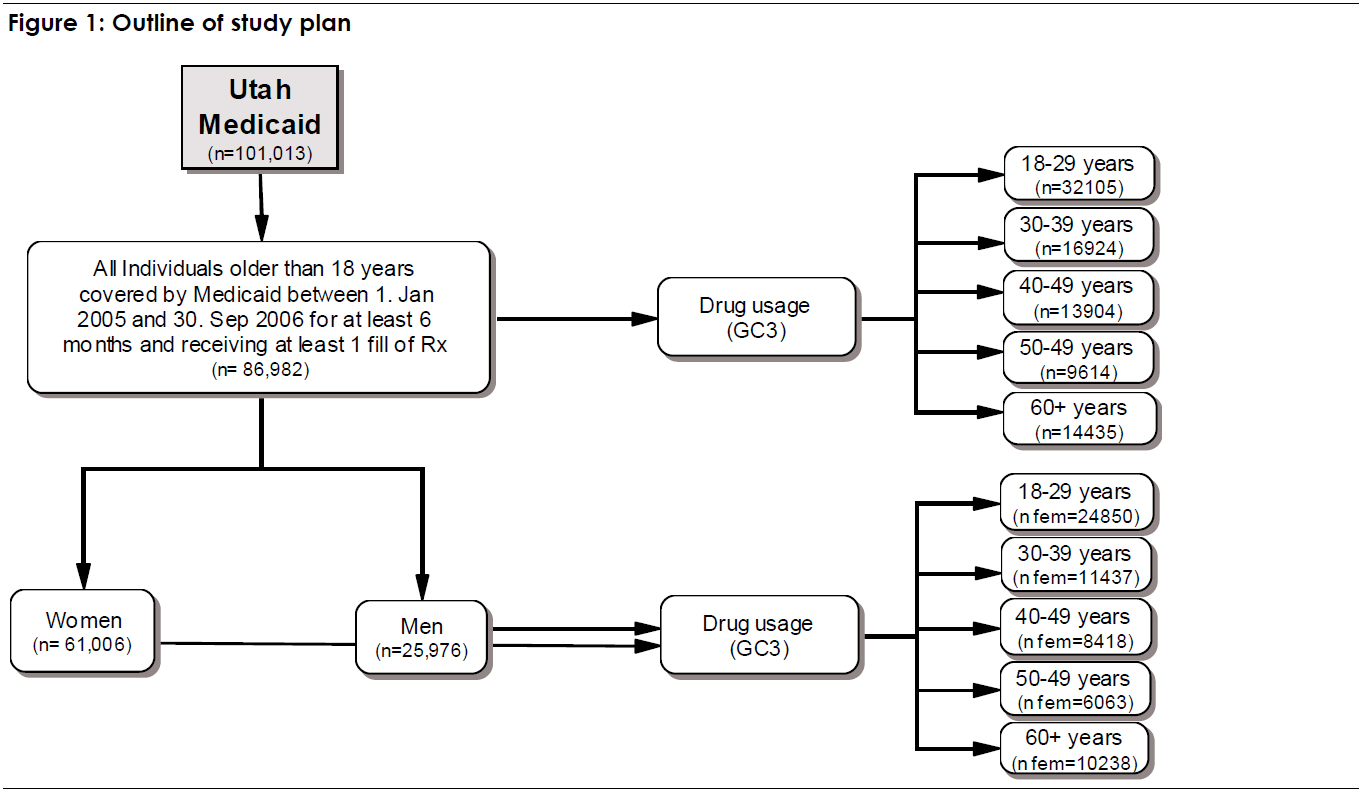
All prescription data for adult patients age 18 and above who were covered for at least 6 months and who filled at least one prescription between January 2005 and September 2006 were used. 70% of the patients were female. Patients were divided by gender and age; age categories were grouped as 18-29, 30-39, 40-49, 50-59, and 60+ years. For each drug classb, the proportion of patients that filled at least one prescription within the study period was calculated by gender and age. The top 15 drug classes for each gender-specific age group were reported. The study plan is summarized in Figure 1.
Results
Demographics
Of all patients eligible for the Medicaid drug plan for at least 6 months during the study period (101,013) 86% were included in this analysis, because they had at least one drug fill during the study period.

Patients between 18 and 29 years constituted the largest group both for women (41%) and men (28%), as shown in Figure 2. 23% of the female patients over 60 and 28% of the male patients over 60 were not older than 64.
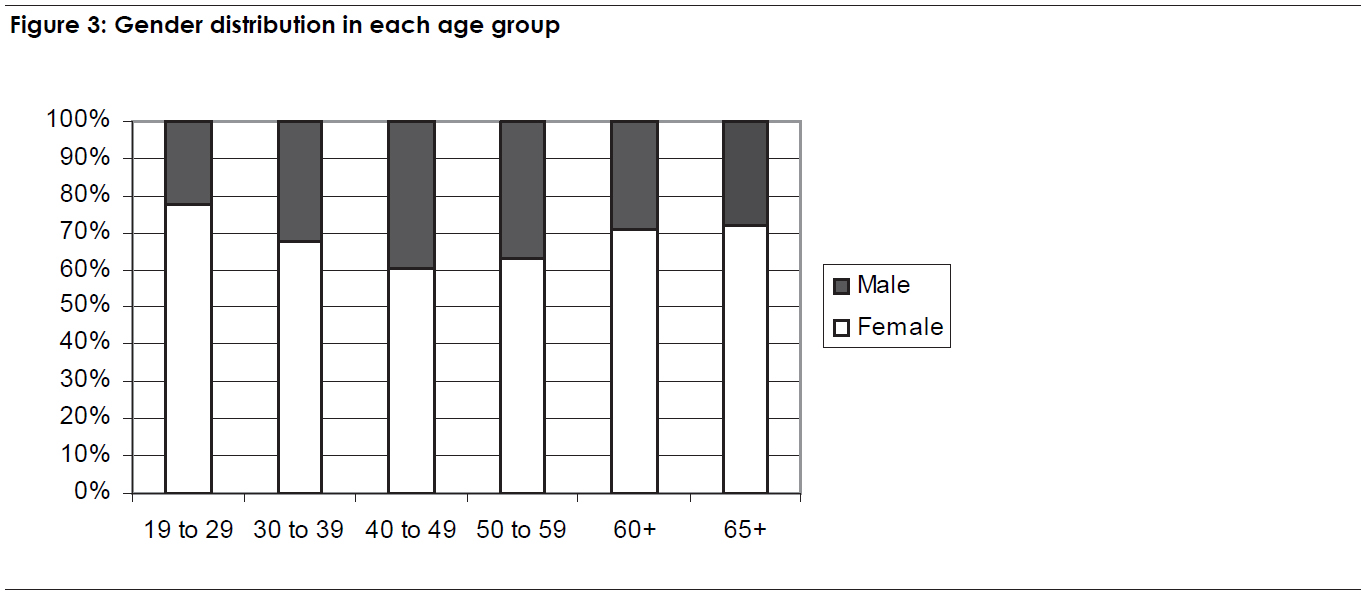
Overall, males made up 30% of the study population. However in the age classes between 40 and 59 there was a higher proportion of males (39.5% for the 40 to 49 years old patients and 36.9% for the 50 to 59 year olds) than in the other age groups. The lowest rate of males was found in the 18 to 29 year age group (see Figure 3). This was not surprising given that Medicaid recipients differ in several aspects as the existing entry barriers will favour different populations from one or the other gender.
Absolute Consumption of High Use Drug Classes
Analgesics and narcotics were the drug classes with the highest fill rates and the highest number of users in both gender groups, followed by non-steroidal anti-inflammatory drugs (NSAIDs). The drug classes with the highest cost overall were the anti-psychotics and anticonvulsants.

The drug classes used by the highest number of pati ents were analgesics, NSAIDs, and selective serotonin reuptake inhibitors (SSRIs) among women and the analgesics, NSAIDs, and gastric acid secretion reducers among men. The most obvious difference between men a nd women in terms of the ranking of drug classes was the use of contraceptives by women (overall rank 12) and the use of thyroid hormones, ranking as the 7th most used drug class among women. Men displayed a relatively higher use of anti-psychotics, anti-hypertensives, and insulin (see Figure 4).
Consumption of High Use Drug Classes Relative to Female or Male Population
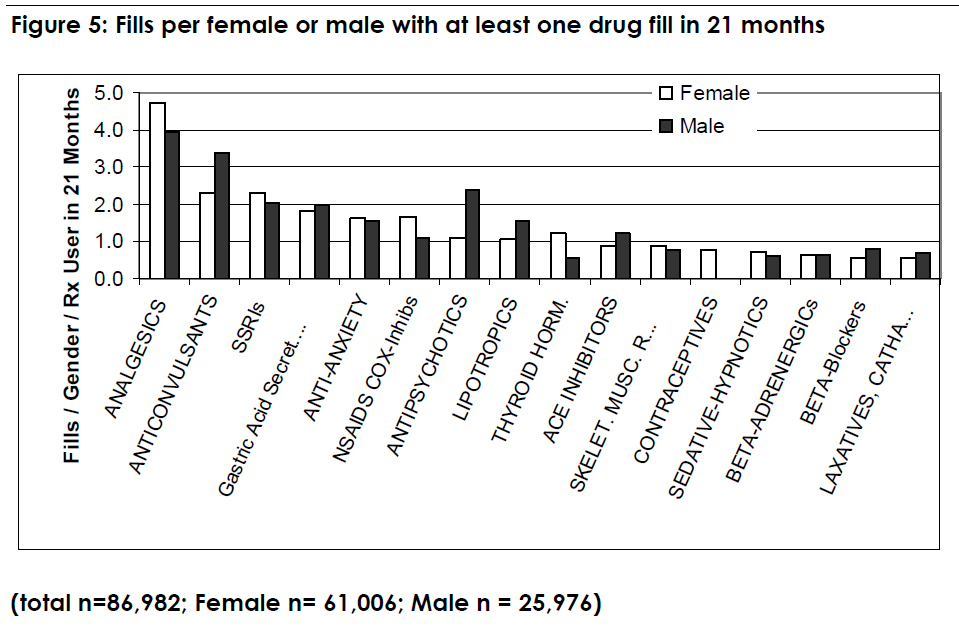
Although in absolute numbers, women in the Utah Medicaid prescription database had much higher utilization compared to men, the picture changed when looking at the number of fills per drug class and per patient (see Figure 5). The highest number of fills was registered for the class of analgesics with 4 fills per patient among males and 4.7 fills per patient among females. These numbers correspond to 67% of females and 49% of males having fills for an analgesic (see Figure 6). Anticonvulsants, with 2.3 fills per patient among females and 3.4 fills per patient among males, corresponded to 19 and 23% of female or male patients taking a drug from this class.
Although NSAIDs were associated with a fill rate of 1.7 among females and 1.1 among males, about 48% of females and 31% of males had at least 1 prescription for NSAIDs. Antipsychotic drugs were filled 2.4 times per male patient and 16% of males had at least one fill for an antipsychotic; this was higher than in the female population, which only had 1.1 fill per patient and only 9% had at least 1 fill for an antipsychotic.

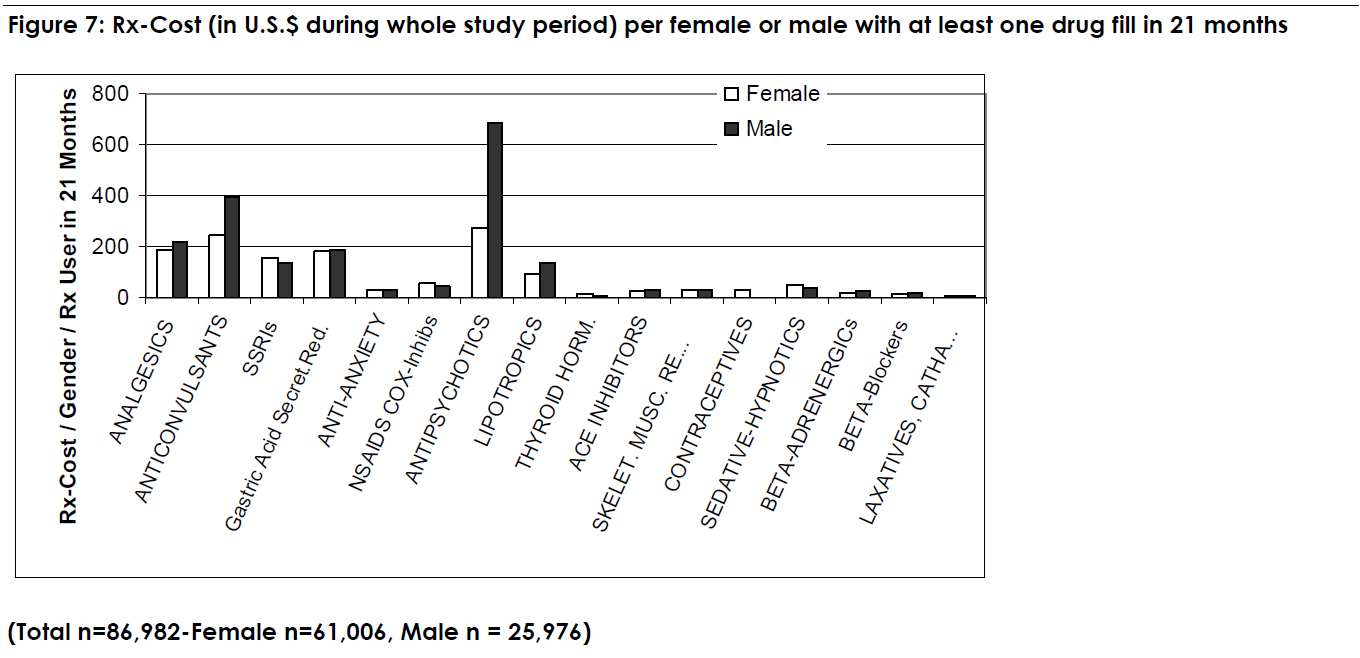
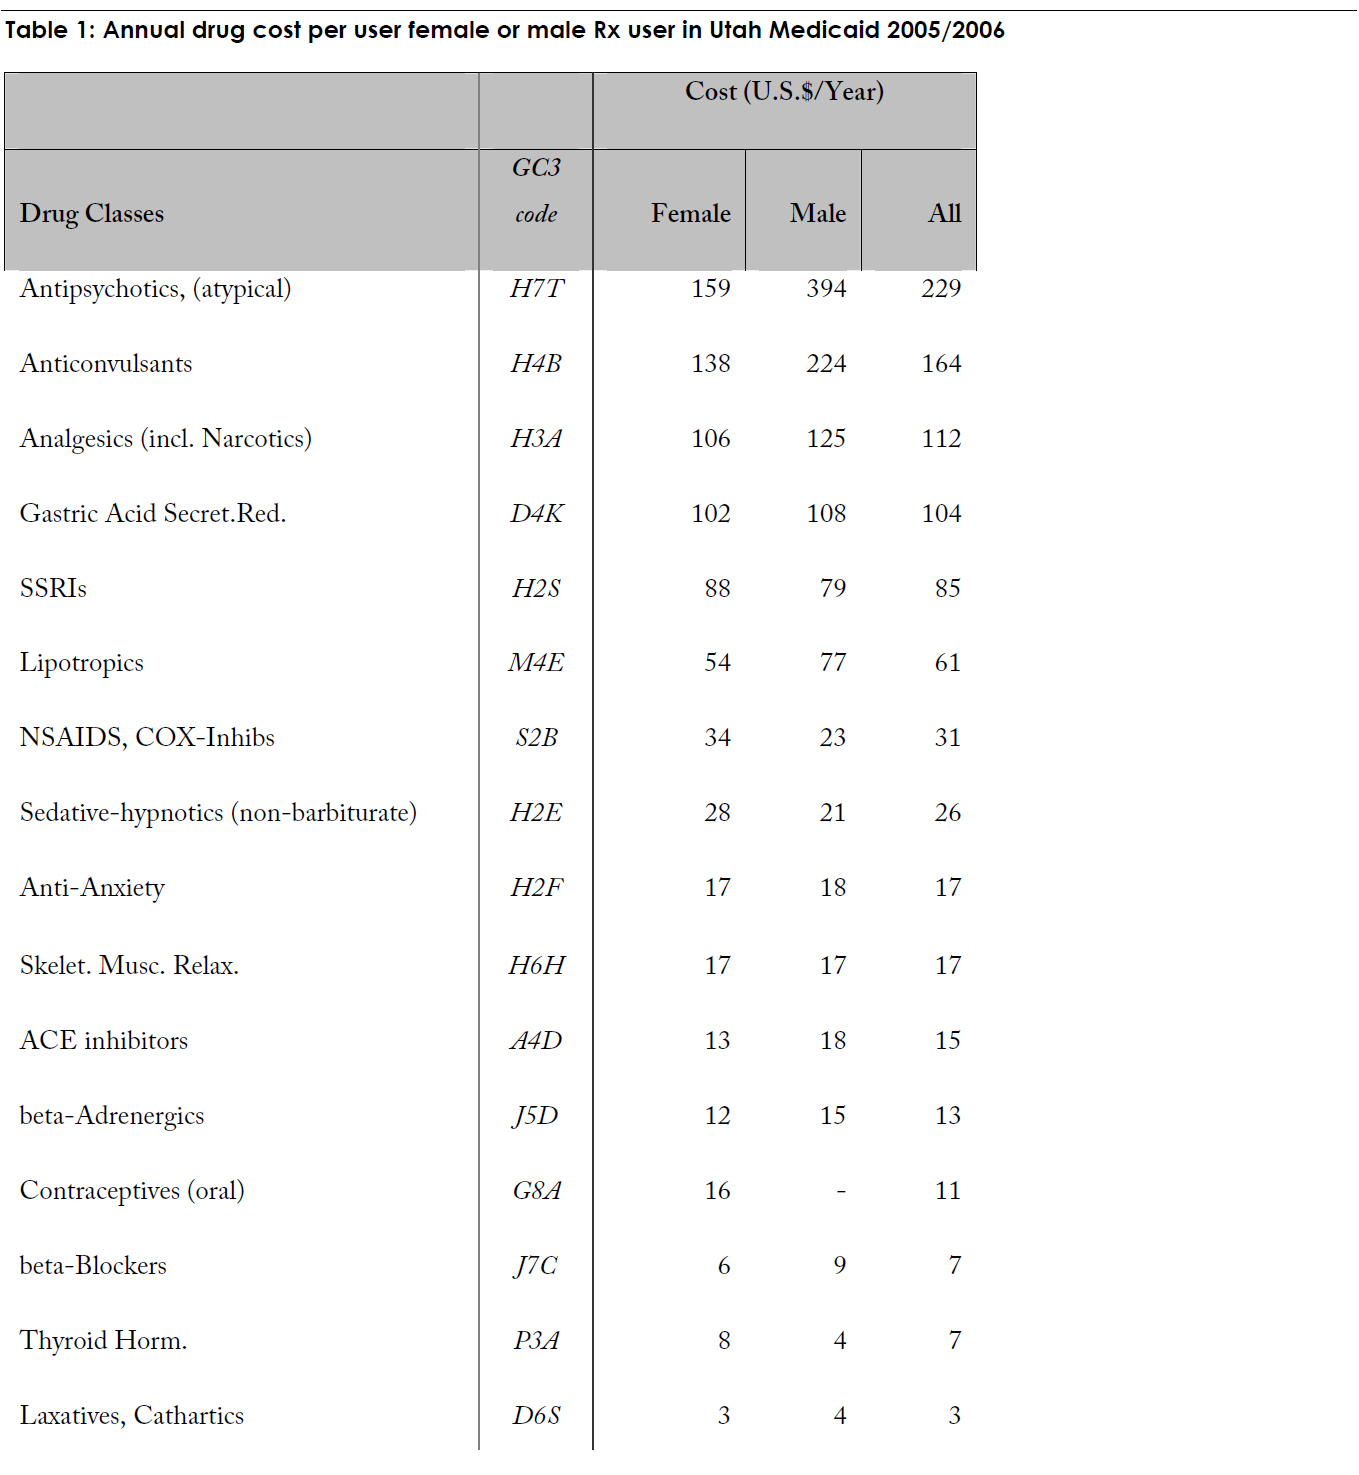
While analgesics were the highest utilized class by the largest number of patients, they were not the most costly. The per-patient cost associated with analgesics was U.S.$186 for females and U.S.$219 for males). Antipsychotic medications had the highest cost per patient at U.S.$ 690 for males versus U.S.$ 278 for females (see Figure 7). This was followed by anticonvulsants at U.S.$391 for males versus U.S.$242 for females. Among females, antipsychotics and anticonvulsants had the highest cost per patient.
The complete ranking for cost in relation to female or male or all Rx users is listed in the table below:
Age-Related Consumption of High Use Drug Classes in the Female Population
Among females, the average number of fills per patients within each class was calculated by age group (see Figure 8). The class with the largest number of fills per pati ent was antipsychotics, with 14.3 fills per patient among patients age 50 to 59. Analgesics, anticonvulsants, thyroid hormones and insulin also had per-patient fill rates of more than 10 in this age group.
There was an increasing number of fills per patient with increasing age in most drug classes up to age 59. There was a drop in fill rates among patients over age 60, most likely due to the fact that a large percentage of that group was only covered by Medicaid for the first 12 months of the study period. In January 2006, with the introduction of Medicare Part D, many patients over age 65 years were no longer covered by Medicaid.
We also found that some drug classes were used more among younger women (e.g. contraceptives) while others were used more among older patients (e.g. antihypertensives, insulins, bone resorption suppressants etc.).

Cost per Female by Age Group
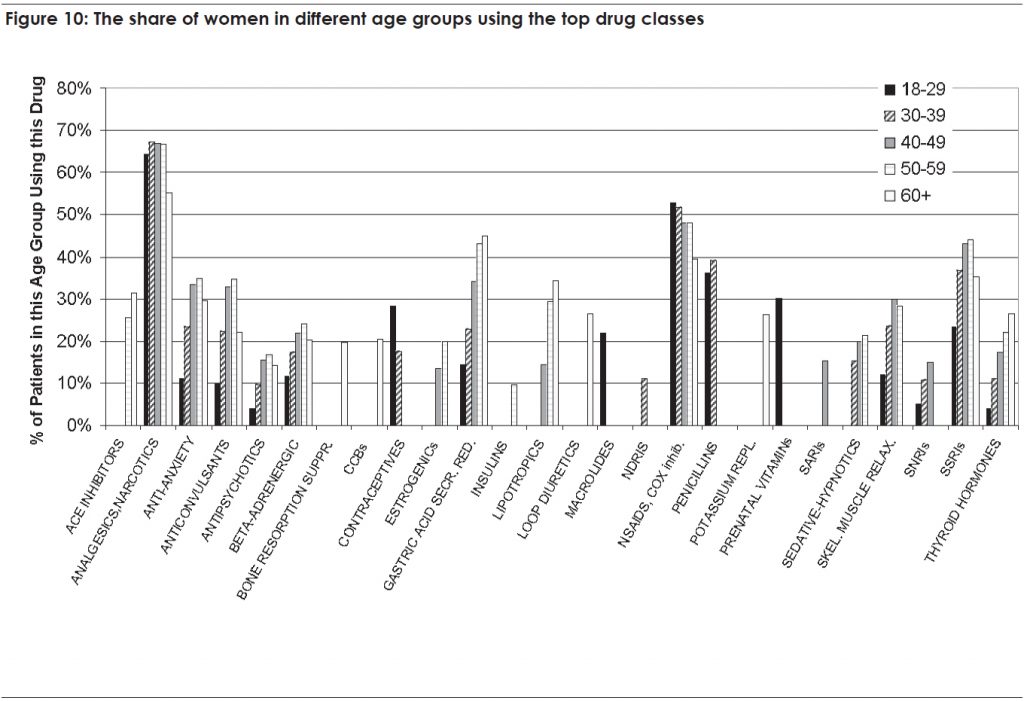
The average cost per patient for each drug class is shown in Figure 9. In general, cost per patient tended to increase with increasing age. For example, the per-patient cost of antipsychotics among patients age 18-29 was U.S.$93.70 and among patients age 50-59 was U.S.$623.40 – an increase by a factor of 7.6. is phenomenon can be explained by both higher fill rate per user (see Figure 8) and an increased percentage of patients using this drug class (see Figure 10).

The antipsychotics class was associated with the highest per-patient cost reaching a cost level comparable to that of the overall male population among females age 50 to 59 (U.S.$690 per patient; see Figure 7)
The cost of anticonvulsants, analgesics, and gastric acid secretion reducers started at U.S.$149, 62, and 54 per patient among women age 18 to 29, and increased to U.S.$431, 380, and 372 per patient among women age 50 to 59.
Discussion
Analgesics were the drug class with the highest number of fills for women and men as well as the highest percentage of the study population using them (see Table 2). SSRIs ranked higher for women and anti-psychotics higher for men. The latter, however, had the highest cost impact for both genders.
In a study on prescription drug use and expenditure in California, analgesics were also the most used drug class with 5.3% of the total population having prescriptions (Bymark & Waite, 2001). There are some striking differences between the Utah Medicaid population and the California general population:
- In the California study, antihypertensives (ACE inhibitors, CCBs, beta-blockers) all ranked very high, while none of them was among the ten most used drugs in the Utah Medicaid female population
- Amoxicillin antibiotics were ranked 5 in the Californian study, but did not appear among the highest 15 in Utah
- In the California study, contraceptives (rank 4) and hormone replacement therapy (rank 10) are much more prominent, even in the general population, than among females in the Utah Medicaid population. In Utah, contraceptives were ranked 12 and hormone replacement was only among the top 15 classes among females between 50 and 59. This high variation may be explained, at least in part, by general cultural differences between populations in the 2 states. In addition, California instituted a program, known as the Family Planning, Access, Care and Treatment Program (Family PACTc ) in 1997 that promotes access to contraceptives for low income families with the goal of preventing unwanted pregnancies and their consequences.

It is interesting to note that the percentage of patients using any single drug class in the California study was much lower in our analysis; for example, in California 5.3% of the population had prescriptions for analgesics, compared to 58% of Utah patients. This may be due to the fact that we only calculated usage rates among patients who received at least one prescription, while the California study reported rates among the total population. In addition, we can assume that the overall drug use in a Medicaid population with typically low income and high percentages of chronically ill people will deviate from that of a general mix population. The observation that contraceptives and hormone replacement therapy only make a minor contribution to the drug related gender differences is in line with the observations of Roe et al (Roe, McNamara, & Motheral, 2002).
In an analysis by the Agency for Healthcare Research and Quality (AHRQ) of prescription data from the general outpatient population, investigators found that 44.2% of the population bought at least one central nervous system agent (including analgesics), 37.5% bought a cardiovascular agent, 36.9% bought any kind of hormone, 22% an anti-hyperlipidemic and 20.1% a psychotherapeutic agent (Stagnitti, 2006). These were the 5 drug classes producing the highest cost in the general population.
It has been shown by several researchers, that women in general utilize more drugs than men, that drug cost are also higher for women, and that the ranking of different drug classes differs between women and men. (Obermeyer et al., 2004; Roe, McNamara, & Motheral, 2002; Stagnitti, 2006)
A ‘Medical Expenditure Panel Survey Prescribed Medicines’ reported that 64% of the total U.S. population had a prescription in 2003. (“2003 Medical Expenditure Panel Survey Prescribed Medicines File”, 2005) It is also reported that a higher percentage of the Medicare population (90%) had prescriptions than the non-Medicare population (60%). It was also seen that women represented 55.5% of the Medicare population and caused 58.5% of the Medicare drug expenditure. The general population was composed of 50% women, but they caused 59% of the drug expenditures. In our study, we see that in relation to the 15 drugs used most in the Utah Medicaid
population, that male patients represent a higher cost per patient than women (see Table 1). Figure 3 also shows that the gender distribution in Utah Medicaid is significantly different from the distribution in the non-Medicaid populations, with only between 23% (age 18 to 29) and 39.5% (age 40 to 49) being male. Therefore, our results are specific for the type of male or female population being covered for pharmaceutical benefits by Utah Medicaid.
This study reported on the drug consumption rates of women in different age categories. While analgesics remained the most used drug class (about 65 % of all patients) in all age groups, some differences were found in the ranking of the other classes between age groups. For most medications, fill rates increased with increasing age (see Figure 8): Those patients using a drug class seemed to use it more often if they were older. One explanation for that could be that persistency increases with increasing age of the patients. The Utah Medicaid data would have to be analysed in more detail to confirm this assumption.
Limitations
We analysed the prescription claims among in the Utah Medicaid database. The data represent the drug consumption behaviour of a very specific population and cannot necessarily be representative of the general population. In addition, the gender-related findings of this study are restricted to this specific population. For further interpretation, it would be important to understand the demographic, social and health related differences between the female and male populations covered by Utah Medicaid.
In this study drugs were classified according to the Specific Therapeutic Class Code (GC3) published by First Data Bank, Inc. Results may vary if using a different type of classification. For example, different types of antihypertensives will be found in different GC3 groups. If they were pooled into one group, antihypertensives might rank much higher than reported here. For comparability and standardization reasons, we have decided to use the GC3 class without further pooling of data in this study.
Another limitation is related to the changes in the prescription drug coverage for elderly patients. Starting in January 2006, many patients were transferred to the Medicare Part D program and were no longer covered by Medicaid. Therefore, the data for patients over age 60 were only collected for 12 months of the 21 month study period. This time difference for a rather large part of the population (see Figure 3) distorted the results for the group over age 60.
References
- 2003 Medical Expenditure Panel Survey Prescribed Medicines File. (2005). Agency for Healthcare Research and Quality, Rockville, MD. MEPS HC-077A.
- Bymark, L., & Waite, K. (2001). Prescription drug use and expenditures in California: Key trends and drivers: California Healthcare Foundation (CHCF).
- Obermeyer, C. M., Schulein, M., Hardon, A., Sievert, L. L., Price, K., Santiago, A. C., et al. (2004). Gender and medication use: an exploratory, multi-site study. Women Health, 39(4), 57-73.
- Roe, C. M., McNamara, A. M., & Motheral, B. R. (2002). Gender- and age-related prescription drug use patterns. Ann Pharmacother, 36(1), 30-39.
- Stagnitti, M. N. (2006). The Top Five Therapeutic Classes of Outpatient Prescription Drugs Ranked by Total Expense for Adults Age 18 and Older in the U.S. Civilian Noninstitutionalized Population 2004. Agency for Healthcare Research and Quality, Rockville, MD. Statistical Brief, 154.
- U.S. Department of Health and Human Services. (2000). Health People 2010 2nd ed. With Understanding and Improving Health and Objectives for Improving Health. . Washington, DC: U.S. Government Printing Office.
